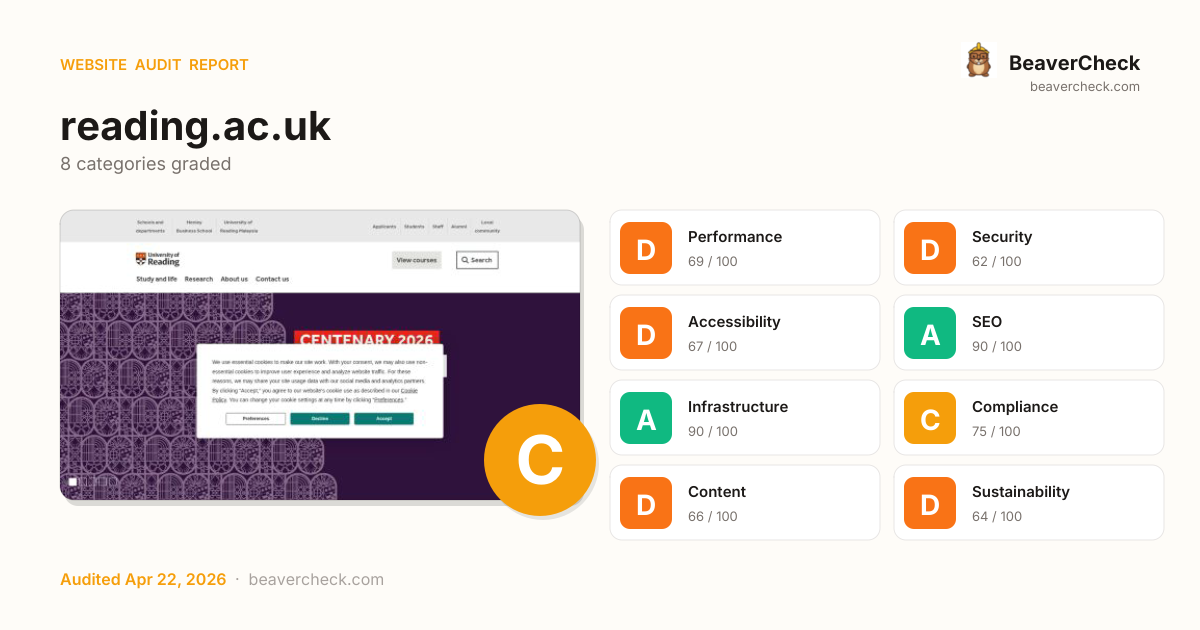
Mobile 375 × 812

Desktop 1440 × 900

Score: 71 / 100
Based on 8 categories, 0 sections
Room to improve — your 20.1s load time is above Google's 2.5s 'Good' threshold.
Several missing protections leave your users and data exposed.
Several issues make your site difficult for assistive technology users.
Well-optimized for search — your content is discoverable.
Solid infrastructure — fast server responses across the board.
Mostly compliant — a few items need attention.
Missing metadata means poor previews on social media and search.
Heavier than average — reducing page weight saves energy and bandwidth.
The overall score is a weighted average of individual category scores. Categories with more impact on user experience and security carry more weight.
Weights reflect general web best practices. Individual needs may differ.
Content-Security-Policy header is missing
Security gaps expose your site and users to attacks, eroding trust.
No Content-Security-Policy header found
Security gaps expose your site and users to attacks, eroding trust.
2 control(s) without accessible label
Accessibility issues exclude users with disabilities — up to 15% of your potential audience.
4 link(s) with no accessible text
Accessibility issues exclude users with disabilities — up to 15% of your potential audience.
No <main> landmark found
Accessibility issues exclude users with disabilities — up to 15% of your potential audience.
High impact, low effort — start here.
High impact, requires investment.
Small gains, minimal effort.
Nothing in this quadrant — good news.
Low impact, high effort — do last.
Nothing in this quadrant — good news.
[](https://beavercheck.com/results/73bdb68f-4e6f-46f3-916d-7c38e2f80468)<a href="https://beavercheck.com/results/73bdb68f-4e6f-46f3-916d-7c38e2f80468"><img src="https://beavercheck.com/badge?url=https%3A%2F%2Freading.ac.uk" alt="BeaverCheck Score"></a>https://beavercheck.com/badge?url=https%3A%2F%2Freading.ac.ukThis badge auto-updates with your latest scan result.
Your site performs reasonably well, but a few targeted fixes could meaningfully improve results. Addressing the critical issues below would have the most immediate impact on your user trust.
8 barrier(s) likely increasing bounce by ~29%.
Page takes 20.1s to load
+12% bounceUsers abandon at ~3s — you're 17.6s over the 2.5s threshold
Fix: Optimize render-blocking resources, preload the hero image, and compress images
High main-thread blocking time
+2% bouncePage is non-interactive for 455ms after first paint
Fix: Defer third-party scripts and split large bundles
No HSTS header
+1% bounceReturning visitors are briefly exposed to downgrade attacks on first request
Fix: Set Strict-Transport-Security: max-age=31536000; includeSubDomains
No Content-Security-Policy header
+1% bounceHigher XSS blast radius — one compromised script can exfiltrate the checkout form
Fix: Ship a reporting-only CSP first, then enforce once violations are clean
2 form field(s) without a label
+4% bounceScreen readers skip unlabeled fields; autofill can't identify them; checkout abandonment spikes
Fix: Associate every input with a visible <label for="…">; add autocomplete attributes
No Open Graph tags
+2% bounceLinks shared on LinkedIn / Slack / Facebook show bare URLs — referral clicks drop
Fix: Add og:title, og:description, og:image, og:url to the page head
No structured data
+2% bounceNo rich-result eligibility in Google — lower SERP CTR vs competitors with stars and prices
Fix: Add JSON-LD for your page type (Product, Article, FAQPage, LocalBusiness, …)
1 broken link(s) on the page
+2% bounceClicks land on 404s — trust drops and the session often ends
Fix: Fix or remove the broken destinations surfaced on the Content tab
Preliminary CRO audit — each barrier links to the tab with detailed analysis.
£413 investment → £0.73/month returns + GBP 18,050,000 risk avoided
£413
6h · 5 findings
£0.73 /mo
~£8.74 / year
GBP 18,050,000
if kept compliant
£75 — in quick wins — start here for the fastest payback
Figures combine localized regulatory fine ceilings, search/conversion value priced against local CPC, and bandwidth waste estimates. Results depend on implementation quality and audience composition. Not legal or financial advice.
5.5 developer hours at £75/hr
Based on United Kingdom rates (£75/hr)
Start here for the best return on investment
£1,504,167 / month at risk
~£18,050,009 / year if left unfixed
£18,050,000
+5 more
£0.73 /mo
11567.7 MB/mo × 0.063 GBP/GB
Compliance figures represent the statutory maximum fine for the most severe triggered category, capped per regulation — not the sum of per-finding penalties. Based on published regulatory fine ranges. This is not legal advice.
Unique monthly visitors from your analytics
Purchases, signups, or key actions
Optional — for revenue estimation
more engaged visitors from reduced bounce
Fix 5 critical issues to capture this value
Based on Google/Deloitte research ("Milliseconds Make Millions") showing a ~7% bounce rate increase per additional second of LCP above the 2.5s "Good" threshold.
Your site's LCP: → estimated after fixes.
These are estimates based on industry research — actual results vary
Your data stays in your browser — nothing is sent to our servers
Thanks for your feedback!
We'll use a cached audit if available, or offer to scan.
Industry-standard audits powered by Google Lighthouse.
Key metrics that affect user experience.
First Contentful Paint First Contentful Paint — how long until the browser renders the first piece of content. Under 1.8s is good.
6.95 s
Largest Contentful Paint Largest Contentful Paint — how long until the largest visible element loads. Under 2.5s is good.
20.12 s
Total Blocking Time Total Blocking Time — total time the main thread was blocked, preventing user input. Under 200ms is good.
455 ms
Cumulative Layout Shift Cumulative Layout Shift — measures visual stability. How much the page layout shifts during loading. Under 0.1 is good.
0.000
Speed Index Speed Index — how quickly content is visually displayed during load. Under 3.4s is good.
8.35 s
Time to Interactive Time to Interactive — how long until the page is fully interactive and responds to user input. Under 3.8s is good.
20.64 s
Audit breakdown by category with detailed findings.
Remove large, duplicate JavaScript modules from bundles to reduce unnecessary bytes consumed by network activity.
Performance issues directly impact user engagement and conversion rates.
Polyfills and transforms enable older browsers to use new JavaScript features. However, many aren't necessary for modern browsers. Consider modifying your JavaScript build process to not transpile Baseline features, unless you know you must support older browsers. Learn why most sites can deploy ES6+ code without transpiling
Shipping ES5 transpiled code to modern browsers wastes bytes — every user with an evergreen browser pays for compatibility you don't need.
Most users today run browsers that natively support ES6+, async/await, optional chaining, and the rest of modern JavaScript. Transpiling to ES5 'just in case' adds 20-40% to your bundle for no benefit. Configure your build to target a modern browserslist, or ship a differential bundle pair (modern + legacy) with the module/nomodule pattern.
Source: Google web.dev / Lighthouse
3rd party code can significantly impact load performance. Reduce and defer loading of 3rd party code to prioritize your page's content.
Performance issues directly impact user engagement and conversion rates.
A long cache lifetime can speed up repeat visits to your page. Learn more about caching.
Performance issues directly impact user engagement and conversion rates.
Your first network request is the most important. Reduce its latency by avoiding redirects, ensuring a fast server response, and enabling text compression.
Performance issues directly impact user engagement and conversion rates.
Consider setting font-display to swap or optional to ensure text is consistently visible. swap can be further optimized to mitigate layout shifts with font metric overrides.
Performance issues directly impact user engagement and conversion rates.
A forced reflow occurs when JavaScript queries geometric properties (such as offsetWidth) after styles have been invalidated by a change to the DOM state. This can result in poor performance. Learn more about forced reflows and possible mitigations.
Performance issues directly impact user engagement and conversion rates.
Reducing the download time of images can improve the perceived load time of the page and LCP. Learn more about optimizing image size
Performance issues directly impact user engagement and conversion rates.
| URL | Resource Size | Est Savings | |
|---|---|---|---|
ul.cd-hero-slider > li.selected > div.cd-img-container > img.mobile ul.cd-hero-slider > li.selected > div.cd-img-container > img.mobile | www.reading.ac.uk/homepage/web/multimediafiles/centenary-homepage-banner.jpg | 125.7 KiB | 115.4 KiB |
div.row > div.pane > div.image-placeholder > img div.row > div.pane > div.image-placeholder > img | www.reading.ac.uk/homepage/web/multimediafiles/connectedworld296x150.jpg | 91.7 KiB | 84.5 KiB |
div.row > div.pane > div.image-placeholder > img div.row > div.pane > div.image-placeholder > img | /homepage/web/multimediafiles/assets-home-Great-course-se... | 75.2 KiB | 68.0 KiB |
div.row > div.pane > div.image-placeholder > img div.row > div.pane > div.image-placeholder > img | /homepage/web/multimediafiles/assets-home-Explore-student... | 53.3 KiB | 46.1 KiB |
div.row > div.pane > div.image-placeholder > img div.row > div.pane > div.image-placeholder > img | /homepage/web/multimediafiles/assets-home-Get-a-Room1-296... | 47.9 KiB | 40.6 KiB |
div.row > div.pane > div.image-placeholder > img div.row > div.pane > div.image-placeholder > img | www.reading.ac.uk/homepage/web/multimediafiles/teaching-and-learning-296x150.jpg | 42.4 KiB | 35.2 KiB |
div.row > div.pane > div.image-placeholder > img div.row > div.pane > div.image-placeholder > img | /homepage/web/multimediafiles/assets-home-latest-news-296... | 40.0 KiB | 32.8 KiB |
div.row > div.pane > div.image-placeholder > img div.row > div.pane > div.image-placeholder > img | www.reading.ac.uk/homepage/web/multimediafiles/business-296x150px.jpg | 39.8 KiB | 32.5 KiB |
div.cta-content > a.icon-map > i.cta-icon > ::before div.cta-content > a.icon-map > i.cta-icon > ::before | www.reading.ac.uk/homepage/web/multimediafiles/assets-img-icons-s35e128c89f.png | 99.3 KiB | 20.2 KiB |
div.row > div.pane > div.image-placeholder > img div.row > div.pane > div.image-placeholder > img | www.reading.ac.uk/homepage/web/multimediafiles/unibuddy256x150.jpg | 25.8 KiB | 18.6 KiB |
div.row > div.pane > div.image-placeholder > img div.row > div.pane > div.image-placeholder > img | www.reading.ac.uk/homepage/web/multimediafiles/assets-home-uorm-1-296x150.jpg | 15.7 KiB | 8.4 KiB |
University of Reading div.mega-btn > div.mobile-home > a > img | www.reading.ac.uk/homepage/web/multimediafiles/legacy-uor-home-mobile.png | 5.7 KiB | 5.3 KiB |
Optimize LCP by making the LCP image discoverable from the HTML immediately, and avoiding lazy-loading
Performance issues directly impact user engagement and conversion rates.
HTTP/2 and HTTP/3 offer many benefits over HTTP/1.1, such as multiplexing. Learn more about using modern HTTP.
Performance issues directly impact user engagement and conversion rates.
Avoid chaining critical requests by reducing the length of chains, reducing the download size of resources, or deferring the download of unnecessary resources to improve page load.
Performance issues directly impact user engagement and conversion rates.
Requests are blocking the page's initial render, which may delay LCP. Deferring or inlining can move these network requests out of the critical path.
Performance issues directly impact user engagement and conversion rates.
These insights are also available in the Chrome DevTools Performance Panel - record a trace to view more detailed information.
Redirects introduce additional delays before the page can be loaded. Learn how to avoid page redirects.
Performance issues directly impact user engagement and conversion rates.
| URL | Time Spent |
|---|---|
| reading.ac.uk/ | 768 ms |
| www.reading.ac.uk/ | 630 ms |
| www.reading.ac.uk/ | 0.0 ms |
Time to Interactive is the amount of time it takes for the page to become fully interactive. Learn more about the Time to Interactive metric.
Performance issues directly impact user engagement and conversion rates.
The maximum potential First Input Delay that your users could experience is the duration of the longest task. Learn more about the Maximum Potential First Input Delay metric.
Performance issues directly impact user engagement and conversion rates.
Minifying CSS files can reduce network payload sizes. Learn how to minify CSS.
Performance issues directly impact user engagement and conversion rates.
| URL | Transfer Size | Est Savings |
|---|---|---|
| www.reading.ac.uk/homepage/web/files/dr-homepage/assets-css-main.css | 198.7 KiB | 14.6 KiB |
| www.reading.ac.uk/homepage/web/files/dr-homepage/css-main.css | 53.1 KiB | 12.6 KiB |
| www.reading.ac.uk/homepage/web/files/dr-homepage/css-hero-slider-style-2.css | 18.0 KiB | 6.3 KiB |
| www.reading.ac.uk/homepage/web/files/dr-homepage/february-assets-css-main.css | 12.7 KiB | 2.8 KiB |
Reduce unused rules from stylesheets and defer CSS not used for above-the-fold content to decrease bytes consumed by network activity. Learn how to reduce unused CSS.
Performance issues directly impact user engagement and conversion rates.
| URL | Transfer Size | Est Savings |
|---|---|---|
| www.reading.ac.uk/homepage/web/files/dr-homepage/assets-css-main.css | 198.3 KiB | 167.7 KiB |
| www.reading.ac.uk/homepage/web/files/dr-homepage/css-main.css | 52.7 KiB | 36.6 KiB |
| www.reading.ac.uk/homepage/web/files/dr-homepage/css-hero-slider-style-2.css | 17.6 KiB | 12.5 KiB |
| www.reading.ac.uk/homepage/web/files/dr-homepage/february-assets-css-main.css | 12.3 KiB | 11.1 KiB |
Reduce unused JavaScript and defer loading scripts until they are required to decrease bytes consumed by network activity. Learn how to reduce unused JavaScript.
Multi-megabyte JavaScript bundles delay every interactive feature on the page.
This is the Lighthouse audit fired when too much JS is shipped relative to what executes. The fix isn't a config flag — it requires bundle analysis (webpack-bundle-analyzer, rollup-plugin-visualizer), splitting routes into chunks, lazy-loading off-screen components, and removing unused dependencies. Fundamentally different from minification: minifying reduces byte count, this reduces what's downloaded at all.
Source: Google web.dev / Lighthouse
| URL | Transfer Size | Est Savings |
|---|---|---|
| www.reading.ac.uk/homepage/web/files/dr-homepage/web-library.min.js | 176.3 KiB | 102.3 KiB |
| www.googletagmanager.com/gtag/js?id=AW-11016496176&cx=c>m=4e64k0 | 143.5 KiB | 87.4 KiB |
| www.googletagmanager.com/gtag/js?id=DC-13730620&cx=c>m=4e64k0 | 131.7 KiB | 80.8 KiB |
| www.googletagmanager.com/gtag/js?id=DC-13024755&cx=c>m=4e64k0 | 129.2 KiB | 80.5 KiB |
| www.googletagmanager.com/gtag/js?id=DC-8556031&cx=c>m=4e64k0 | 129.2 KiB | 80.5 KiB |
| www.googletagmanager.com/gtm.js?id=GTM-TC325M | 192.1 KiB | 79.5 KiB |
| www.reading.ac.uk/homepage/web/files/dr-homepage/js-jquery-2.1.1.js | 82.3 KiB | 55.7 KiB |
| app.termly.io/resource-blocker/b846a047-fc56-4159-aaf3-7bdc36e97907 | 143.2 KiB | 54.4 KiB |
Consider reducing the time spent parsing, compiling and executing JS. You may find delivering smaller JS payloads helps with this. Learn how to minimize main-thread work
Performance issues directly impact user engagement and conversion rates.
| Category | Time Spent |
|---|---|
| Script Evaluation | 1.1 s |
| Other | 386 ms |
| Style & Layout | 303 ms |
| Script Parsing & Compilation | 271 ms |
| Parse HTML & CSS | 48 ms |
| Rendering | 31 ms |
| Garbage Collection | 26 ms |
Minifying JavaScript files can reduce payload sizes and script parse time. Learn how to minify JavaScript.
Performance issues directly impact user engagement and conversion rates.
| URL | Transfer Size | Est Savings |
|---|---|---|
| www.reading.ac.uk/sc93/js/uor.module.cookie-blocker.js | 4.6 KiB | 2.3 KiB |
Large network payloads cost users real money and are highly correlated with long load times. Learn how to reduce payload sizes.
Performance issues directly impact user engagement and conversion rates.
Set an explicit width and height on image elements to reduce layout shifts and improve CLS. Learn how to set image dimensions
Performance issues directly impact user engagement and conversion rates.
| URL | |
|---|---|
div.row > div.pane > div.image-placeholder > img div.row > div.pane > div.image-placeholder > img | /homepage/web/multimediafiles/assets-home-Great-course-se... |
div.row > div.pane > div.image-placeholder > img div.row > div.pane > div.image-placeholder > img | /homepage/web/multimediafiles/assets-home-Explore-student... |
div.row > div.pane > div.image-placeholder > img div.row > div.pane > div.image-placeholder > img | www.reading.ac.uk/homepage/web/multimediafiles/unibuddy256x150.jpg |
div.row > div.pane > div.image-placeholder > img div.row > div.pane > div.image-placeholder > img | /homepage/web/multimediafiles/assets-home-latest-news-296... |
div.row > div.pane > div.image-placeholder > img div.row > div.pane > div.image-placeholder > img | www.reading.ac.uk/homepage/web/multimediafiles/teaching-and-learning-296x150.jpg |
div.row > div.pane > div.image-placeholder > img div.row > div.pane > div.image-placeholder > img | /homepage/web/multimediafiles/assets-home-Get-a-Room1-296... |
div.row > div.pane > div.image-placeholder > img div.row > div.pane > div.image-placeholder > img | www.reading.ac.uk/homepage/web/multimediafiles/connectedworld296x150.jpg |
div.row > div.pane > div.image-placeholder > img div.row > div.pane > div.image-placeholder > img | www.reading.ac.uk/homepage/web/multimediafiles/business-296x150px.jpg |
div.row > div.pane > div.image-placeholder > img div.row > div.pane > div.image-placeholder > img | www.reading.ac.uk/homepage/web/multimediafiles/assets-home-uorm-1-296x150.jpg |
weibo icon div.pane > div.component > a.icon > img | www.reading.ac.uk/homepage/web/multimediafiles/weibo.png |
More information about the performance of your application. These numbers don't directly affect the Performance score.
These checks highlight opportunities to improve the accessibility of your web app. Automatic detection can only detect a subset of issues and does not guarantee the accessibility of your web app, so manual testing is also encouraged.
ARIA dialog elements without accessible names may prevent screen readers users from discerning the purpose of these elements. Learn how to make ARIA dialog elements more accessible.
Performance issues directly impact user engagement and conversion rates.
| Failing Elements |
|---|
We use essential cookies to make our site work. With your consent, we may also … div#termly-code-snippet-support > div > div.termly-styles-root-f9c495 > div.termly-styles-consent-banner-fa199d |
These are opportunities to improve the usage of ARIA in your application which may enhance the experience for users of assistive technology, like a screen reader.
Low-contrast text is difficult or impossible for many users to read. Learn how to provide sufficient color contrast.
Performance issues directly impact user engagement and conversion rates.
| Failing Elements |
|---|
#1 nav > ul > li > a |
#2 nav > ul > li > a |
#3 nav > ul > li > a |
#4 nav > ul > li > a |
BACK TO TOP div.wrapper > div.wrapper-footer > div.mobile-back-to-top > a |
These are opportunities to improve the legibility of your content.
All sites should be protected with HTTPS, even ones that don't handle sensitive data. This includes avoiding mixed content, where some resources are loaded over HTTP despite the initial request being served over HTTPS. HTTPS prevents intruders from tampering with or passively listening in on the communications between your app and your users, and is a prerequisite for HTTP/2 and many new web platform APIs. Learn more about HTTPS.
Performance issues directly impact user engagement and conversion rates.
| Insecure URL | Request Resolution |
|---|---|
| www.reading.ac.uk/ | Allowed |
Image natural dimensions should be proportional to the display size and the pixel ratio to maximize image clarity. Learn how to provide responsive images.
Performance issues directly impact user engagement and conversion rates.
| URL | Displayed size | Actual size | Expected size | |
|---|---|---|---|---|
div.row > div.pane > div.image-placeholder > img div.row > div.pane > div.image-placeholder > img | /homepage/web/multimediafiles/assets-home-Great-course-se... | 399 x 202 | 296 x 150 | 599 x 303 |
A character encoding declaration is required. It can be done with a `<meta>` tag in the first 1024 bytes of the HTML or in the Content-Type HTTP response header. Learn more about declaring the character encoding.
Performance issues directly impact user engagement and conversion rates.
Errors logged to the console indicate unresolved problems. They can come from network request failures and other browser concerns. Learn more about this errors in console diagnostic audit
Performance issues directly impact user engagement and conversion rates.
| Source | Description |
|---|---|
Failed to load resource: the server responded with a status of 404 (Page not found) |
These checks ensure that your page is following basic search engine optimization advice. There are many additional factors Lighthouse does not score here that may affect your search ranking, including performance on Core Web Vitals. Learn more about Google Search Essentials.
If your robots.txt file is malformed, crawlers may not be able to understand how you want your website to be crawled or indexed. Learn more about robots.txt.
Performance issues directly impact user engagement and conversion rates.
| Line # | Content | Error |
|---|---|---|
| 18 | Disallow: http://www.rdg.ac.uk/WebStats | Pattern should either be empty, start with "/" or "*" |
| 19 | Disallow: http://www.reading.ac.uk/WebStats | Pattern should either be empty, start with "/" or "*" |
To appear in search results, crawlers need access to your app.
Industry-standard audits powered by Google Lighthouse. — Desktop
Key metrics that affect user experience. — Desktop
First Contentful Paint First Contentful Paint — how long until the browser renders the first piece of content. Under 1.8s is good.
1.50 s
Largest Contentful Paint Largest Contentful Paint — how long until the largest visible element loads. Under 2.5s is good.
2.18 s
Total Blocking Time Total Blocking Time — total time the main thread was blocked, preventing user input. Under 200ms is good.
0 ms
Cumulative Layout Shift Cumulative Layout Shift — measures visual stability. How much the page layout shifts during loading. Under 0.1 is good.
0.026
Speed Index Speed Index — how quickly content is visually displayed during load. Under 3.4s is good.
1.50 s
Time to Interactive Time to Interactive — how long until the page is fully interactive and responds to user input. Under 3.8s is good.
2.23 s
Audit breakdown by category with detailed findings.
Remove large, duplicate JavaScript modules from bundles to reduce unnecessary bytes consumed by network activity.
Performance issues directly impact user engagement and conversion rates.
Polyfills and transforms enable older browsers to use new JavaScript features. However, many aren't necessary for modern browsers. Consider modifying your JavaScript build process to not transpile Baseline features, unless you know you must support older browsers. Learn why most sites can deploy ES6+ code without transpiling
Shipping ES5 transpiled code to modern browsers wastes bytes — every user with an evergreen browser pays for compatibility you don't need.
Most users today run browsers that natively support ES6+, async/await, optional chaining, and the rest of modern JavaScript. Transpiling to ES5 'just in case' adds 20-40% to your bundle for no benefit. Configure your build to target a modern browserslist, or ship a differential bundle pair (modern + legacy) with the module/nomodule pattern.
Source: Google web.dev / Lighthouse
3rd party code can significantly impact load performance. Reduce and defer loading of 3rd party code to prioritize your page's content.
Performance issues directly impact user engagement and conversion rates.
A long cache lifetime can speed up repeat visits to your page. Learn more about caching.
Performance issues directly impact user engagement and conversion rates.
Your first network request is the most important. Reduce its latency by avoiding redirects, ensuring a fast server response, and enabling text compression.
Performance issues directly impact user engagement and conversion rates.
Consider setting font-display to swap or optional to ensure text is consistently visible. swap can be further optimized to mitigate layout shifts with font metric overrides.
Performance issues directly impact user engagement and conversion rates.
Optimize LCP by making the LCP image discoverable from the HTML immediately, and avoiding lazy-loading
Performance issues directly impact user engagement and conversion rates.
HTTP/2 and HTTP/3 offer many benefits over HTTP/1.1, such as multiplexing. Learn more about using modern HTTP.
Performance issues directly impact user engagement and conversion rates.
Avoid chaining critical requests by reducing the length of chains, reducing the download size of resources, or deferring the download of unnecessary resources to improve page load.
Performance issues directly impact user engagement and conversion rates.
Requests are blocking the page's initial render, which may delay LCP. Deferring or inlining can move these network requests out of the critical path.
Performance issues directly impact user engagement and conversion rates.
| URL | Transfer Size | Duration |
|---|---|---|
| www.reading.ac.uk/homepage/web/files/dr-homepage/assets-css-main.css | 198.7 KiB | 592 ms |
| www.reading.ac.uk/homepage/web/files/dr-homepage/css-main.css | 53.1 KiB | 366 ms |
| www.reading.ac.uk/sc93/js/uor.module.cookie-blocker.js | 5.4 KiB | 140 ms |
| www.reading.ac.uk/homepage/web/files/dr-homepage/js-modernizr.custom.04512.js | 15.6 KiB | 231 ms |
| www.reading.ac.uk/homepage/web/files/dr-homepage/february-assets-css-main.css | 12.7 KiB | 186 ms |
| www.reading.ac.uk/homepage/web/files/dr-homepage/css-hero-slider-style-2.css | 18.0 KiB | 231 ms |
| www.reading.ac.uk/homepage/web/files/dr-homepage/clearing-2025.css | 2.0 KiB | 140 ms |
Reducing the download time of images can improve the perceived load time of the page and LCP. Learn more about optimizing image size
Performance issues directly impact user engagement and conversion rates.
| URL | Resource Size | Est Savings | |
|---|---|---|---|
div.row > div.pane > div.image-placeholder > img div.row > div.pane > div.image-placeholder > img | www.reading.ac.uk/homepage/web/multimediafiles/connectedworld296x150.jpg | 91.7 KiB | 84.5 KiB |
div.row > div.pane > div.image-placeholder > img div.row > div.pane > div.image-placeholder > img | /homepage/web/multimediafiles/assets-home-Great-course-se... | 75.2 KiB | 68.0 KiB |
div.row > div.pane > div.image-placeholder > img div.row > div.pane > div.image-placeholder > img | /homepage/web/multimediafiles/assets-home-Explore-student... | 53.3 KiB | 46.1 KiB |
div.row > div.pane > div.image-placeholder > img div.row > div.pane > div.image-placeholder > img | /homepage/web/multimediafiles/assets-home-Get-a-Room1-296... | 47.9 KiB | 40.6 KiB |
div.row > div.pane > div.image-placeholder > img div.row > div.pane > div.image-placeholder > img | www.reading.ac.uk/homepage/web/multimediafiles/teaching-and-learning-296x150.jpg | 42.4 KiB | 35.2 KiB |
div.row > div.pane > div.image-placeholder > img div.row > div.pane > div.image-placeholder > img | /homepage/web/multimediafiles/assets-home-latest-news-296... | 40.0 KiB | 32.8 KiB |
div.row > div.pane > div.image-placeholder > img div.row > div.pane > div.image-placeholder > img | www.reading.ac.uk/homepage/web/multimediafiles/business-296x150px.jpg | 39.8 KiB | 32.5 KiB |
div.cta-content > a.icon-map > i.cta-icon > ::before div.cta-content > a.icon-map > i.cta-icon > ::before | www.reading.ac.uk/homepage/web/multimediafiles/assets-img-icons-s35e128c89f.png | 99.3 KiB | 20.2 KiB |
div.row > div.pane > div.image-placeholder > img div.row > div.pane > div.image-placeholder > img | www.reading.ac.uk/homepage/web/multimediafiles/unibuddy256x150.jpg | 25.8 KiB | 18.6 KiB |
ul.cd-hero-slider > li.selected > div.cd-img-container > img.desktop ul.cd-hero-slider > li.selected > div.cd-img-container > img.desktop | www.reading.ac.uk/homepage/web/multimediafiles/centenary-homepage-banner.jpg | 125.7 KiB | 15.2 KiB |
div.row > div.pane > div.image-placeholder > img div.row > div.pane > div.image-placeholder > img | www.reading.ac.uk/homepage/web/multimediafiles/assets-home-uorm-1-296x150.jpg | 15.7 KiB | 8.4 KiB |
div.main > div.wrapper-wide > div.placeholder-image > img div.main > div.wrapper-wide > div.placeholder-image > img | /homepage/web/multimediafiles/assets-new-images-landing_f... | 92.5 KiB | 7.9 KiB |
University of Reading ul.megamenu > li.home > a.mega-link > img | www.reading.ac.uk/homepage/web/multimediafiles/legacy-uor-home.png | 5.0 KiB | 4.2 KiB |
These insights are also available in the Chrome DevTools Performance Panel - record a trace to view more detailed information.
Minifying CSS files can reduce network payload sizes. Learn how to minify CSS.
Performance issues directly impact user engagement and conversion rates.
| URL | Transfer Size | Est Savings |
|---|---|---|
| www.reading.ac.uk/homepage/web/files/dr-homepage/assets-css-main.css | 198.7 KiB | 14.6 KiB |
| www.reading.ac.uk/homepage/web/files/dr-homepage/css-main.css | 53.1 KiB | 12.6 KiB |
| www.reading.ac.uk/homepage/web/files/dr-homepage/css-hero-slider-style-2.css | 18.0 KiB | 6.3 KiB |
| www.reading.ac.uk/homepage/web/files/dr-homepage/february-assets-css-main.css | 12.7 KiB | 2.8 KiB |
Reduce unused rules from stylesheets and defer CSS not used for above-the-fold content to decrease bytes consumed by network activity. Learn how to reduce unused CSS.
Performance issues directly impact user engagement and conversion rates.
| URL | Transfer Size | Est Savings |
|---|---|---|
| www.reading.ac.uk/homepage/web/files/dr-homepage/assets-css-main.css | 198.3 KiB | 177.8 KiB |
| www.reading.ac.uk/homepage/web/files/dr-homepage/css-main.css | 52.7 KiB | 42.7 KiB |
| www.reading.ac.uk/homepage/web/files/dr-homepage/css-hero-slider-style-2.css | 17.6 KiB | 12.1 KiB |
| www.reading.ac.uk/homepage/web/files/dr-homepage/february-assets-css-main.css | 12.3 KiB | 10.3 KiB |
Reduce unused JavaScript and defer loading scripts until they are required to decrease bytes consumed by network activity. Learn how to reduce unused JavaScript.
Multi-megabyte JavaScript bundles delay every interactive feature on the page.
This is the Lighthouse audit fired when too much JS is shipped relative to what executes. The fix isn't a config flag — it requires bundle analysis (webpack-bundle-analyzer, rollup-plugin-visualizer), splitting routes into chunks, lazy-loading off-screen components, and removing unused dependencies. Fundamentally different from minification: minifying reduces byte count, this reduces what's downloaded at all.
Source: Google web.dev / Lighthouse
| URL | Transfer Size | Est Savings |
|---|---|---|
| www.reading.ac.uk/homepage/web/files/dr-homepage/web-library.min.js | 176.3 KiB | 102.3 KiB |
| www.googletagmanager.com/gtag/js?id=AW-11016496176&cx=c>m=4e64k0 | 143.5 KiB | 87.4 KiB |
| www.googletagmanager.com/gtag/js?id=DC-13730620&cx=c>m=4e64k0 | 131.7 KiB | 80.7 KiB |
| www.googletagmanager.com/gtag/js?id=DC-13024755&cx=c>m=4e64k0 | 129.2 KiB | 80.5 KiB |
| www.googletagmanager.com/gtag/js?id=DC-8556031&cx=c>m=4e64k0 | 129.2 KiB | 80.5 KiB |
| www.googletagmanager.com/gtm.js?id=GTM-TC325M | 192.1 KiB | 79.5 KiB |
| www.reading.ac.uk/homepage/web/files/dr-homepage/js-jquery-2.1.1.js | 82.3 KiB | 55.7 KiB |
| app.termly.io/resource-blocker/b846a047-fc56-4159-aaf3-7bdc36e97907 | 143.1 KiB | 54.4 KiB |
Minifying JavaScript files can reduce payload sizes and script parse time. Learn how to minify JavaScript.
Performance issues directly impact user engagement and conversion rates.
| URL | Transfer Size | Est Savings |
|---|---|---|
| www.reading.ac.uk/sc93/js/uor.module.cookie-blocker.js | 4.6 KiB | 2.3 KiB |
Large network payloads cost users real money and are highly correlated with long load times. Learn how to reduce payload sizes.
Performance issues directly impact user engagement and conversion rates.
Set an explicit width and height on image elements to reduce layout shifts and improve CLS. Learn how to set image dimensions
Performance issues directly impact user engagement and conversion rates.
| URL | |
|---|---|
div.main > div.wrapper-wide > div.placeholder-image > img div.main > div.wrapper-wide > div.placeholder-image > img | /homepage/web/multimediafiles/assets-new-images-landing_f... |
div.row > div.pane > div.image-placeholder > img div.row > div.pane > div.image-placeholder > img | /homepage/web/multimediafiles/assets-home-Great-course-se... |
div.row > div.pane > div.image-placeholder > img div.row > div.pane > div.image-placeholder > img | /homepage/web/multimediafiles/assets-home-Explore-student... |
div.row > div.pane > div.image-placeholder > img div.row > div.pane > div.image-placeholder > img | www.reading.ac.uk/homepage/web/multimediafiles/unibuddy256x150.jpg |
div.row > div.pane > div.image-placeholder > img div.row > div.pane > div.image-placeholder > img | /homepage/web/multimediafiles/assets-home-latest-news-296... |
div.row > div.pane > div.image-placeholder > img div.row > div.pane > div.image-placeholder > img | www.reading.ac.uk/homepage/web/multimediafiles/teaching-and-learning-296x150.jpg |
div.row > div.pane > div.image-placeholder > img div.row > div.pane > div.image-placeholder > img | /homepage/web/multimediafiles/assets-home-Get-a-Room1-296... |
div.row > div.pane > div.image-placeholder > img div.row > div.pane > div.image-placeholder > img | www.reading.ac.uk/homepage/web/multimediafiles/connectedworld296x150.jpg |
div.row > div.pane > div.image-placeholder > img div.row > div.pane > div.image-placeholder > img | www.reading.ac.uk/homepage/web/multimediafiles/business-296x150px.jpg |
div.row > div.pane > div.image-placeholder > img div.row > div.pane > div.image-placeholder > img | www.reading.ac.uk/homepage/web/multimediafiles/assets-home-uorm-1-296x150.jpg |
University of Reading ul.megamenu > li.home > a.mega-link > img | www.reading.ac.uk/homepage/web/multimediafiles/legacy-uor-home.png |
weibo icon div.pane > div.component > a.icon > img | www.reading.ac.uk/homepage/web/multimediafiles/weibo.png |
More information about the performance of your application. These numbers don't directly affect the Performance score.
Redirects introduce additional delays before the page can be loaded. Learn how to avoid page redirects.
Performance issues directly impact user engagement and conversion rates.
| URL | Time Spent |
|---|---|
| reading.ac.uk/ | 213 ms |
| www.reading.ac.uk/ | 190 ms |
| www.reading.ac.uk/ | 0.0 ms |
These checks highlight opportunities to improve the accessibility of your web app. Automatic detection can only detect a subset of issues and does not guarantee the accessibility of your web app, so manual testing is also encouraged.
Some ARIA parent roles must contain specific child roles to perform their intended accessibility functions. Learn more about roles and required children elements.
Performance issues directly impact user engagement and conversion rates.
| Failing Elements |
|---|
Schools and departments Henley Business School University of Reading Malaysia div.s-wrapper > div.s-row-normal > div.base7 > ul.pad-none |
Applicants Students Staff Alumni Local community div.s-wrapper > div.s-row-normal > div.base7 > ul.pad-none |
ARIA dialog elements without accessible names may prevent screen readers users from discerning the purpose of these elements. Learn how to make ARIA dialog elements more accessible.
Performance issues directly impact user engagement and conversion rates.
| Failing Elements |
|---|
We use essential cookies to make our site work. With your consent, we may also … div#termly-code-snippet-support > div > div.termly-styles-root-f9c495 > div.termly-styles-consent-banner-fa199d |
These are opportunities to improve the usage of ARIA in your application which may enhance the experience for users of assistive technology, like a screen reader.
Screen readers require list items (`<li>`) to be contained within a parent `<ul>`, `<ol>` or `<menu>` to be announced properly. Learn more about proper list structure.
Performance issues directly impact user engagement and conversion rates.
| Failing Elements |
|---|
Schools and departments div.s-row-normal > div.base7 > ul.pad-none > li.display-tablecell |
Henley Business School div.s-row-normal > div.base7 > ul.pad-none > li.display-tablecell |
University of Reading Malaysia div.s-row-normal > div.base7 > ul.pad-none > li.display-tablecell |
Applicants div.s-row-normal > div.base7 > ul.pad-none > li.display-tablecell |
Students div.s-row-normal > div.base7 > ul.pad-none > li.display-tablecell |
Staff div.s-row-normal > div.base7 > ul.pad-none > li.display-tablecell |
Alumni div.s-row-normal > div.base7 > ul.pad-none > li.display-tablecell |
Local community div.s-row-normal > div.base7 > ul.pad-none > li.display-tablecell |
These are opportunities to improve the experience of reading tabular or list data using assistive technology, like a screen reader.
All sites should be protected with HTTPS, even ones that don't handle sensitive data. This includes avoiding mixed content, where some resources are loaded over HTTP despite the initial request being served over HTTPS. HTTPS prevents intruders from tampering with or passively listening in on the communications between your app and your users, and is a prerequisite for HTTP/2 and many new web platform APIs. Learn more about HTTPS.
Performance issues directly impact user engagement and conversion rates.
| Insecure URL | Request Resolution |
|---|---|
| www.reading.ac.uk/ | Allowed |
A character encoding declaration is required. It can be done with a `<meta>` tag in the first 1024 bytes of the HTML or in the Content-Type HTTP response header. Learn more about declaring the character encoding.
Performance issues directly impact user engagement and conversion rates.
These checks ensure that your page is following basic search engine optimization advice. There are many additional factors Lighthouse does not score here that may affect your search ranking, including performance on Core Web Vitals. Learn more about Google Search Essentials.
If your robots.txt file is malformed, crawlers may not be able to understand how you want your website to be crawled or indexed. Learn more about robots.txt.
Performance issues directly impact user engagement and conversion rates.
| Line # | Content | Error |
|---|---|---|
| 18 | Disallow: http://www.rdg.ac.uk/WebStats | Pattern should either be empty, start with "/" or "*" |
| 19 | Disallow: http://www.reading.ac.uk/WebStats | Pattern should either be empty, start with "/" or "*" |
To appear in search results, crawlers need access to your app.
Send Feedback