Spain · Madrid Completed: Apr 7, 2026 20:06 UTC
Mobile 375 × 812

Desktop 1440 × 900

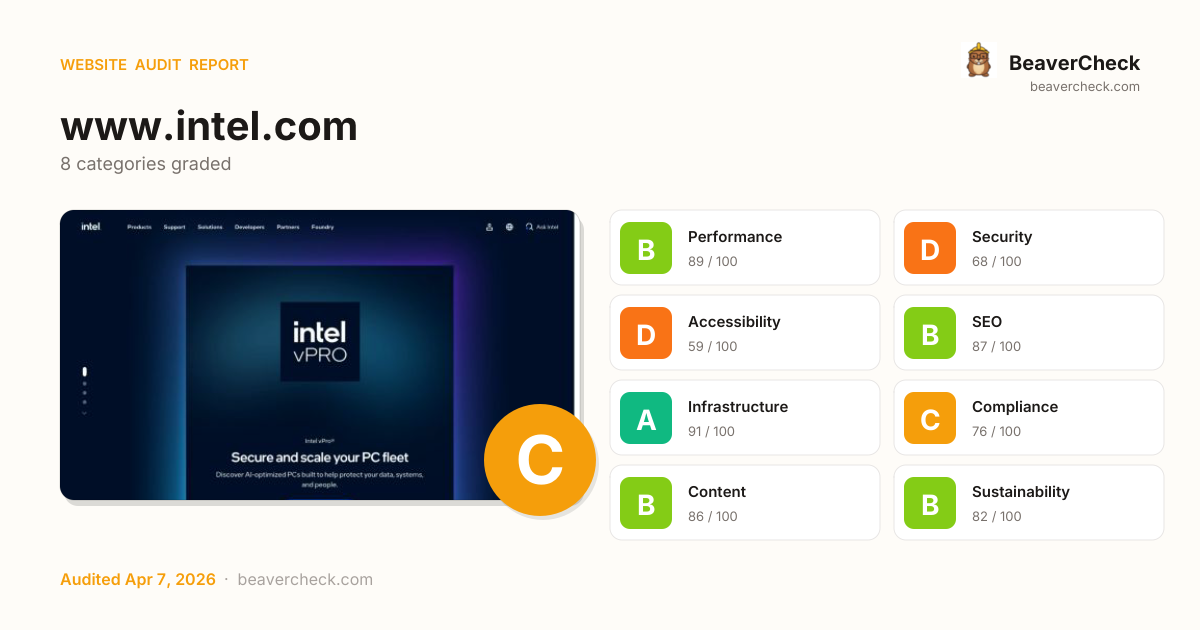
Score: 78 / 100
Based on 8 categories, 0 sections
The overall score is a weighted average of individual category scores. Categories with more impact on user experience and security carry more weight.
Weights reflect general web best practices. Individual needs may differ.
1 button(s) with no accessible text
No H1 heading found
Cookie 'detected_bandwidth' has no SameSite attribute
Cookie 'src_countrycode' has no SameSite attribute
Cross-Origin-Embedder-Policy header is missing
[](https://beavercheck.com/results/773cbf50-25f6-8f27-5dce-985e9f3279d2)<a href="https://beavercheck.com/results/773cbf50-25f6-8f27-5dce-985e9f3279d2"><img src="https://beavercheck.com/badge?url=https%3A%2F%2Fwww.intel.com" alt="BeaverCheck Score"></a>https://beavercheck.com/badge?url=https%3A%2F%2Fwww.intel.comThis badge auto-updates with your latest scan result.
Thanks for your feedback!
Industry-standard audits powered by Google Lighthouse.
Key metrics that affect user experience.
First Contentful Paint First Contentful Paint — how long until the browser renders the first piece of content. Under 1.8s is good.
4.50 s
Largest Contentful Paint Largest Contentful Paint — how long until the largest visible element loads. Under 2.5s is good.
12.17 s
Total Blocking Time Total Blocking Time — total time the main thread was blocked, preventing user input. Under 200ms is good.
3.32 s
Cumulative Layout Shift Cumulative Layout Shift — measures visual stability. How much the page layout shifts during loading. Under 0.1 is good.
0.003
Speed Index Speed Index — how quickly content is visually displayed during load. Under 3.4s is good.
7.43 s
Time to Interactive Time to Interactive — how long until the page is fully interactive and responds to user input. Under 3.8s is good.
12.18 s
Audit breakdown by category with detailed findings.
Remove large, duplicate JavaScript modules from bundles to reduce unnecessary bytes consumed by network activity.
Polyfills and transforms enable older browsers to use new JavaScript features. However, many aren't necessary for modern browsers. Consider modifying your JavaScript build process to not transpile Baseline features, unless you know you must support older browsers. Learn why most sites can deploy ES6+ code without transpiling
3rd party code can significantly impact load performance. Reduce and defer loading of 3rd party code to prioritize your page's content.
A long cache lifetime can speed up repeat visits to your page. Learn more about caching.
A forced reflow occurs when JavaScript queries geometric properties (such as offsetWidth) after styles have been invalidated by a change to the DOM state. This can result in poor performance. Learn more about forced reflows and possible mitigations.
Reducing the download time of images can improve the perceived load time of the page and LCP. Learn more about optimizing image size
| URL | Resource Size | Est Savings | |
|---|---|---|---|
Cube Shadow Image div#animatedhero-adeec2c52d > div.cmp-animated-hero__scene > div.cmp-animated-hero__cube-wrapper > img.cmp-animated-hero__cube-shadow | www.intel.com/content/dam/logos/cube-shadow.png | 788.9 KiB | 753.4 KiB |
product badge for Intel Xeon processor family div.cmp-animated-hero__image-wrapper > div.cmp-teaser__image > div#teaser-dc960c7584-image > img.cmp-image__image | /is/image/intelcorp/homepage-badge-xeon-updated-glow-1080... | 8.5 KiB | 6.7 KiB |
product badge for Intel Core Ultra Series 3 processors div.cmp-animated-hero__image-wrapper > div.cmp-teaser__image > div#teaser-e3dcf777c7-image > img.cmp-image__image | /is/image/intelcorp/homepage-badge-core-ultra-series-3-up... | 8.1 KiB | 6.4 KiB |
product badge for Intel Arc Graphics div.cmp-animated-hero__image-wrapper > div.cmp-teaser__image > div#teaser-8f8fb2ae6c-image > img.cmp-image__image | /is/image/intelcorp/homepage-badge-arc-graphics-updaetd-g... | 8.0 KiB | 6.3 KiB |
Optimize LCP by making the LCP image discoverable from the HTML immediately, and avoiding lazy-loading
Avoid chaining critical requests by reducing the length of chains, reducing the download size of resources, or deferring the download of unnecessary resources to improve page load.
Requests are blocking the page's initial render, which may delay LCP. Deferring or inlining can move these network requests out of the critical path.
These insights are also available in the Chrome DevTools Performance Panel - record a trace to view more detailed information.
The maximum potential First Input Delay that your users could experience is the duration of the longest task. Learn more about the Maximum Potential First Input Delay metric.
Redirects introduce additional delays before the page can be loaded. Learn how to avoid page redirects.
| URL | Time Spent |
|---|---|
| www.intel.com/ | 1.1 s |
| www.intel.com/content/www/us/en/homepage.html | 0.0 ms |
Time to Interactive is the amount of time it takes for the page to become fully interactive. Learn more about the Time to Interactive metric.
Reduce unused rules from stylesheets and defer CSS not used for above-the-fold content to decrease bytes consumed by network activity. Learn how to reduce unused CSS.
| URL | Transfer Size | Est Savings |
|---|---|---|
| www.intel.com/etc.clientlibs/intelsites/clientlibs/clientlib-base-v1.min.css | 17.5 KiB | 15.4 KiB |
Reduce unused JavaScript and defer loading scripts until they are required to decrease bytes consumed by network activity. Learn how to reduce unused JavaScript.
| URL | Transfer Size | Est Savings |
|---|---|---|
| www.intel.com/sites/sitewide/js/jquery-1.4.4.min.js | 26.5 KiB | 20.0 KiB |
Consider reducing the time spent parsing, compiling, and executing JS. You may find delivering smaller JS payloads helps with this. Learn how to reduce Javascript execution time.
| URL | Total CPU Time | Script Evaluation | Script Parse |
|---|---|---|---|
| /etc.clientlibs/core/wcm/components/image/v3/image/client... | 5.9 s | 5.9 s | 0.6 ms |
| Unattributable | 484 ms | 18 ms | 0.0 ms |
| /content/dam/www/global/wap/tms/profile-aem-global/prod/f... | 371 ms | 225 ms | 119 ms |
| www.intel.com/akam/13/1ff2432 | 315 ms | 119 ms | 4.7 ms |
| www.intel.com/content/dam/www/global/wap/performance-config.js | 175 ms | 168 ms | 2.8 ms |
| www.intel.com/etc.clientlibs/intelsites/clientlibs/clientlib-base-v1.min.js | 118 ms | 82 ms | 16 ms |
| /etc.clientlibs/intelsites/clientlibs/external/gsap/v1/cl... | 92 ms | 40 ms | 6.9 ms |
| www.intel.com/content/www/us/en/homepage.html | 88 ms | 9.3 ms | 5.1 ms |
Consider reducing the time spent parsing, compiling and executing JS. You may find delivering smaller JS payloads helps with this. Learn how to minimize main-thread work
| Category | Time Spent |
|---|---|
| Script Evaluation | 6.7 s |
| Other | 548 ms |
| Style & Layout | 233 ms |
| Script Parsing & Compilation | 194 ms |
| Parse HTML & CSS | 70 ms |
| Rendering | 39 ms |
More information about the performance of your application. These numbers don't directly affect the Performance score.
These checks highlight opportunities to improve the accessibility of your web app. Automatic detection can only detect a subset of issues and does not guarantee the accessibility of your web app, so manual testing is also encouraged.
Low-contrast text is difficult or impossible for many users to read. Learn how to provide sufficient color contrast.
| Failing Elements |
|---|
Modernize div#animatedhero-adeec2c52d > section#slide-0 > div.cmp-animated-hero__bg-slide-info > div.cmp-animated-hero__bg-title |
These are opportunities to improve the legibility of your content.
Deprecated APIs will eventually be removed from the browser. Learn more about deprecated APIs.
| Deprecation / Warning | Source |
|---|---|
| Synchronous XMLHttpRequest on the main thread is deprecated because of its detrimental effects to the end user's experience. For more help, check https://xhr.spec.whatwg.org/. | www.intel.com/content/dam/www/global/wap/performance-config.js line 30, col 16619 |
Errors logged to the console indicate unresolved problems. They can come from network request failures and other browser concerns. Learn more about this errors in console diagnostic audit
| Source | Description |
|---|---|
www.intel.com/homepage/js/globalgateway.js line 757, col 33 | TypeError: Cannot read properties of undefined (reading 'selectedIndex')
at https://www.intel.com/homepage/js/globalgateway.js:758:34 |
These checks ensure that your page is following basic search engine optimization advice. There are many additional factors Lighthouse does not score here that may affect your search ranking, including performance on Core Web Vitals. Learn more about Google Search Essentials.
Industry-standard audits powered by Google Lighthouse. — Desktop
Key metrics that affect user experience. — Desktop
First Contentful Paint First Contentful Paint — how long until the browser renders the first piece of content. Under 1.8s is good.
471 ms
Largest Contentful Paint Largest Contentful Paint — how long until the largest visible element loads. Under 2.5s is good.
1.28 s
Total Blocking Time Total Blocking Time — total time the main thread was blocked, preventing user input. Under 200ms is good.
36 ms
Cumulative Layout Shift Cumulative Layout Shift — measures visual stability. How much the page layout shifts during loading. Under 0.1 is good.
0.003
Speed Index Speed Index — how quickly content is visually displayed during load. Under 3.4s is good.
769 ms
Time to Interactive Time to Interactive — how long until the page is fully interactive and responds to user input. Under 3.8s is good.
1.72 s
Audit breakdown by category with detailed findings.
Remove large, duplicate JavaScript modules from bundles to reduce unnecessary bytes consumed by network activity.
Polyfills and transforms enable older browsers to use new JavaScript features. However, many aren't necessary for modern browsers. Consider modifying your JavaScript build process to not transpile Baseline features, unless you know you must support older browsers. Learn why most sites can deploy ES6+ code without transpiling
3rd party code can significantly impact load performance. Reduce and defer loading of 3rd party code to prioritize your page's content.
A long cache lifetime can speed up repeat visits to your page. Learn more about caching.
Reducing the download time of images can improve the perceived load time of the page and LCP. Learn more about optimizing image size
| URL | Resource Size | Est Savings | |
|---|---|---|---|
Cube Shadow Image div#animatedhero-adeec2c52d > div.cmp-animated-hero__scene > div.cmp-animated-hero__cube-wrapper > img.cmp-animated-hero__cube-shadow | www.intel.com/content/dam/logos/cube-shadow.png | 788.9 KiB | 656.4 KiB |
product badge for Intel Xeon processor family div.cmp-animated-hero__image-wrapper > div.cmp-teaser__image > div#teaser-dc960c7584-image > img.cmp-image__image | /is/image/intelcorp/homepage-badge-xeon-updated-glow-1080... | 9.9 KiB | 6.4 KiB |
product badge for Intel Arc Graphics div.cmp-animated-hero__image-wrapper > div.cmp-teaser__image > div#teaser-8f8fb2ae6c-image > img.cmp-image__image | /is/image/intelcorp/homepage-badge-arc-graphics-updaetd-g... | 8.4 KiB | 5.5 KiB |
product badge for Intel Core Ultra Series 3 processors div.cmp-animated-hero__image-wrapper > div.cmp-teaser__image > div#teaser-e3dcf777c7-image > img.cmp-image__image | /is/image/intelcorp/homepage-badge-core-ultra-series-3-up... | 8.3 KiB | 5.4 KiB |
Product badge for Intel vPro div.cmp-animated-hero__image-wrapper > div.cmp-teaser__image > div#teaser-17c23fb225-image > img.cmp-image__image | /is/image/intelcorp/homepage-vpro-badge-glow-1080x1080:10... | 6.8 KiB | 4.4 KiB |
Optimize LCP by making the LCP image discoverable from the HTML immediately, and avoiding lazy-loading
Avoid chaining critical requests by reducing the length of chains, reducing the download size of resources, or deferring the download of unnecessary resources to improve page load.
Requests are blocking the page's initial render, which may delay LCP. Deferring or inlining can move these network requests out of the critical path.
These insights are also available in the Chrome DevTools Performance Panel - record a trace to view more detailed information.
Reduce unused rules from stylesheets and defer CSS not used for above-the-fold content to decrease bytes consumed by network activity. Learn how to reduce unused CSS.
| URL | Transfer Size | Est Savings |
|---|---|---|
| www.intel.com/etc.clientlibs/intelsites/clientlibs/clientlib-base-v1.min.css | 17.5 KiB | 15.1 KiB |
Reduce unused JavaScript and defer loading scripts until they are required to decrease bytes consumed by network activity. Learn how to reduce unused JavaScript.
| URL | Transfer Size | Est Savings |
|---|---|---|
| www.intel.com/sites/sitewide/js/jquery-1.4.4.min.js | 26.5 KiB | 20.0 KiB |
More information about the performance of your application. These numbers don't directly affect the Performance score.
Redirects introduce additional delays before the page can be loaded. Learn how to avoid page redirects.
| URL | Time Spent |
|---|---|
| www.intel.com/ | 309 ms |
| www.intel.com/content/www/us/en/homepage.html | 0.0 ms |
These checks highlight opportunities to improve the accessibility of your web app. Automatic detection can only detect a subset of issues and does not guarantee the accessibility of your web app, so manual testing is also encouraged.
Some ARIA child roles must be contained by specific parent roles to properly perform their intended accessibility functions. Learn more about ARIA roles and required parent element.
| Failing Elements |
|---|
Current slide div.animatedhero > div#animatedhero-adeec2c52d > div.cmp-animated-hero__pagination > button#animatedhero-adeec2c52d-item-17c23fb225-tab |
Navigate to slide 2 of 4 div.animatedhero > div#animatedhero-adeec2c52d > div.cmp-animated-hero__pagination > button#animatedhero-adeec2c52d-item-8f8fb2ae6c-tab |
Navigate to slide 3 of 4 div.animatedhero > div#animatedhero-adeec2c52d > div.cmp-animated-hero__pagination > button#animatedhero-adeec2c52d-item-e3dcf777c7-tab |
Navigate to slide 4 of 4 div.animatedhero > div#animatedhero-adeec2c52d > div.cmp-animated-hero__pagination > button#animatedhero-adeec2c52d-item-dc960c7584-tab |
These are opportunities to improve the usage of ARIA in your application which may enhance the experience for users of assistive technology, like a screen reader.
Low-contrast text is difficult or impossible for many users to read. Learn how to provide sufficient color contrast.
| Failing Elements |
|---|
Modernize div#animatedhero-adeec2c52d > section#slide-0 > div.cmp-animated-hero__bg-slide-info > div.cmp-animated-hero__bg-title |
These are opportunities to improve the legibility of your content.
Deprecated APIs will eventually be removed from the browser. Learn more about deprecated APIs.
| Deprecation / Warning | Source |
|---|---|
| Synchronous XMLHttpRequest on the main thread is deprecated because of its detrimental effects to the end user's experience. For more help, check https://xhr.spec.whatwg.org/. | www.intel.com/content/dam/www/global/wap/performance-config.js line 30, col 16619 |
Errors logged to the console indicate unresolved problems. They can come from network request failures and other browser concerns. Learn more about this errors in console diagnostic audit
| Source | Description |
|---|---|
www.intel.com/homepage/js/globalgateway.js line 757, col 33 | TypeError: Cannot read properties of undefined (reading 'selectedIndex')
at https://www.intel.com/homepage/js/globalgateway.js:758:34 |
These checks ensure that your page is following basic search engine optimization advice. There are many additional factors Lighthouse does not score here that may affect your search ranking, including performance on Core Web Vitals. Learn more about Google Search Essentials.
Send Feedback