Audit overview
Performance and Accessibility need attention; the other categories are in good shape.
Fix Priority Matrix
5 findingsQuick Wins
3High impact, low effort — start here.
Strategic
2High impact, requires investment.
Easy Improvements
0Small gains, minimal effort.
Nothing in this quadrant — good news.
Deprioritize
0Low impact, high effort — do last.
Nothing in this quadrant — good news.
Screenshots


Top Priorities (5)
Page weighs 15.6 MB (5.3 MB transferred)
Informational: total page weight (uncompressed) and bytes actually transferred over the wire.
1 image(s) missing alt attribute
Each image without alt text is a WCAG 1.1.1 failure — invisible to screen-reader users, lost from Google Image Search.
2 button(s) with no accessible text
Buttons with no accessible text (icon-only, no aria-label) can't be activated by voice control or understood by screen readers.
2 control(s) without accessible label
Form controls without labels — assistive tech announces 'edit text' with no context; users can't complete forms.
267 third-party resources (74% of weight)
Informational: third-party resource count and their share of page weight. High share caps perf gains from frontend optimization.
Business case
What fixing the audit's findings is worth -- and what ignoring them keeps costing.
Return on investment
€255 investment → €8,856/month returns + EUR 120,500,000 risk avoided
Figures combine localized regulatory fine ceilings, search/conversion value priced against local CPC, and bandwidth waste estimates. Results depend on implementation quality and audience composition. Not legal or financial advice.
Conversion barriers
8 barrier(s) likely increasing bounce by ~30%.
- Page takes 7.9s to loadUsers abandon at ~3s — you're 5.4s over the 2.5s threshold→ Optimize render-blocking resources, preload the hero image, and compress images
- Page feels frozen for 5.7sClicks on the primary CTA are ignored while JavaScript runs→ Break up long tasks; defer non-critical JavaScript to post-hydration
- No HSTS headerReturning visitors are briefly exposed to downgrade attacks on first request→ Set Strict-Transport-Security: max-age=31536000; includeSubDomains
- No Content-Security-Policy headerHigher XSS blast radius — one compromised script can exfiltrate the checkout form→ Ship a reporting-only CSP first, then enforce once violations are clean
- 2 form field(s) without a labelScreen readers skip unlabeled fields; autofill can't identify them; checkout abandonment spikes→ Associate every input with a visible <label for="…">; add autocomplete attributes
Preliminary CRO audit — each barrier links to the tab with detailed analysis.
Remediation cost
Start here for the best return on investment
Cost by category
Cost by effort level
Adjust assumptions
Team composition
Multiplier applied to dev hours to reflect QA, design, and PM overhead. Use Dev only for solo work; Full team for projects with formal review processes.
Rates reflect fully-loaded developer cost including overhead
Warning:Cost of inaction
Compliance Risk
€120.500.000
- No privacy policy link detectedGDPR: EUR 10.000 – EUR 20.000.000
- 5 advertising/retargeting trackers detectedGDPR: EUR 10.000 – EUR 20.000.000
- Trackers detected but no cookie policy foundGDPR: EUR 5.000 – EUR 10.000.000
Bounce-Rate Cost
€3.988 /mo
+30.1pp bounce · ~3,012 lost visitors/mo
CPC: EUR 1.32
Bandwidth Waste
€1,25 /mo
16828.8 MB/mo × 0.074 EUR/GB
- Optimize transfer: save ~1.7 MB per page loadSaves €1,25/mo
Compliance figures represent the statutory maximum fine for the most severe triggered category, capped per regulation — not the sum of per-finding penalties. Based on published regulatory fine ranges. This is not legal advice.
Unique monthly visitors from your analytics
Purchases, signups, or key actions
Optional — for revenue estimation
more engaged visitors from reduced bounce
Fix 4 critical issues to capture this value
How this is calculated
Based on Google/Deloitte research ("Milliseconds Make Millions") showing a ~7% bounce rate increase per additional second of LCP above the 2.5s "Good" threshold.
Your site's LCP: → estimated after fixes.
These are estimates based on industry research — actual results vary
Your data stays in your browser — nothing is sent to our servers
Lighthouse
Mobile
First Contentful Paint First Contentful Paint — how long until the browser renders the first piece of content. Under 1.8s is good.
1.27 s
Largest Contentful Paint Largest Contentful Paint — how long until the largest visible element loads. Under 2.5s is good.
7.90 s
Total Blocking Time Total Blocking Time — total time the main thread was blocked, preventing user input. Under 200ms is good.
5.69 s
Cumulative Layout Shift Cumulative Layout Shift — measures visual stability. How much the page layout shifts during loading. Under 0.1 is good.
0.020
Speed Index Speed Index — how quickly content is visually displayed during load. Under 3.4s is good.
9.14 s
Time to Interactive Time to Interactive — how long until the page is fully interactive and responds to user input. Under 3.8s is good.
41.27 s
Desktop
First Contentful Paint First Contentful Paint — how long until the browser renders the first piece of content. Under 1.8s is good.
641 ms
Largest Contentful Paint Largest Contentful Paint — how long until the largest visible element loads. Under 2.5s is good.
1.00 s
Total Blocking Time Total Blocking Time — total time the main thread was blocked, preventing user input. Under 200ms is good.
525 ms
Cumulative Layout Shift Cumulative Layout Shift — measures visual stability. How much the page layout shifts during loading. Under 0.1 is good.
0.011
Speed Index Speed Index — how quickly content is visually displayed during load. Under 3.4s is good.
3.70 s
Time to Interactive Time to Interactive — how long until the page is fully interactive and responds to user input. Under 3.8s is good.
9.09 s
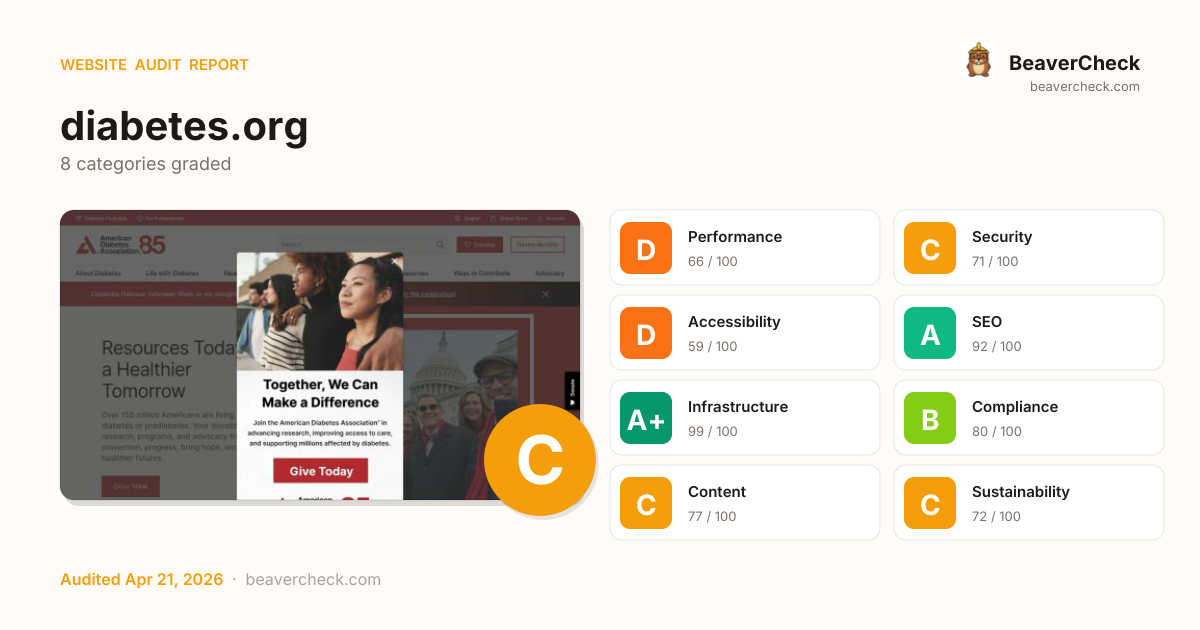
Categories
8Performance
Page weighs 15.6 MB (5.3 MB transferred)
Security
All checks pass
Accessibility
1 image(s) missing alt attribute
SEO
All checks pass
Infrastructure
All checks pass
Compliance
All checks pass
Content
All checks pass
Sustainability
All checks pass
How you compare
Where this site stands against peers running the same stack.
Top 10% of Drupal sites score 84+ on Performance; you're at 66 — closing this gap is the highest-leverage improvement.
Technology stack
Drupal 10, on PHP, hosted on Acquia Cloud Platform, with Cloudflare CDN
Stack Architecture
 Braze
Braze  DoubleClick Floodlight
  Facebook Pixel 2.9.303
 Google Analytics
  Google Tag Manager
  Innovid Advertising Measurement
  Microsoft Advertising
  Microsoft Clarity
  Nextdoor Ads
  Pinterest Conversion Tag
  TVSquared
  TikTok Pixel
  Drupal 10
 Webpack
  Alpine.js 3.10.3Facebook SDK
  Fundraise Up Google Search Console HSTS Mimecast
  Qualtrics
  Tailwind CSS
  Varnish
  core-js 3.32.2
 jQuery 3.7.1
 jQuery UI 1.14.1
 PHP
PHP  Cloudflare
  Uploadcare cdnjs
  Acquia Cloud Platform
  Amazon Web Services
 All Detected Technologies (32)
Cloudflare is a web-infrastructure and website-security company, providing content-delivery-network services, DDoS mitigation, Internet security, and distributed domain-name-server services.
Uploadcare is a complete file handling platform for online business. Receive files from you users via File Uploader or File Upload API, implement image optimization and transformations with Image CDN API, and get HIPAA-compliant storage.
Acquia Cloud Platform is a Drupal-tuned application lifecycle management suite with an infrastructure to support Drupal deployment workflow processes.
Amazon Web Services (AWS) is a comprehensive cloud services platform offering compute power, database storage, content delivery and other functionality.
PHP is a general-purpose scripting language used for web development.
Drupal is a free and open-source web content management framework.
Alpine.js is a minimal framework for composing behavior directly in your markup.
Fundraise Up is a platform for online donations.
HTTP Strict Transport Security (HSTS) informs browsers that the site should only be accessed using HTTPS.
Qualtrics is an cloud-based platform for creating and distributing web-based surveys.
Varnish is a reverse caching proxy.
core-js is a modular standard library for JavaScript, with polyfills for cutting-edge ECMAScript features.
jQuery is a JavaScript library which is a free, open-source software designed to simplify HTML DOM tree traversal and manipulation, as well as event handling, CSS animation, and Ajax.
jQuery UI is a collection of GUI widgets, animated visual effects, and themes implemented with jQuery, Cascading Style Sheets, and HTML.
Braze is a customer engagement platform that delivers messaging experiences across push, email, in-product, and more.
Facebook pixel is an analytics tool that allows you to measure the effectiveness of your advertising.
Google Analytics is a free web analytics service that tracks and reports website traffic.
Google Tag Manager is a tag management system (TMS) that allows you to quickly and easily update measurement codes and related code fragments collectively known as tags on your website or mobile app.
Innovid Advertising Measurement is a solution for assessing and analyzing the performance of advertising campaigns across different platforms and devices.
Microsoft Advertising is an online advertising platform developed by Microsoft.
Microsoft's Clarity is a analytics tool which provides website usage statistics, session recording, and heatmaps.
Nextdoor Ads is an easy-to-use expansion of Nextdoor’s proprietary self-serve campaign management platform, designed to help small and medium-sized businesses (SMBs) advertise on Nextdoor.
Pinterest Conversion Tag allows you to track actions people take on your website after viewing your Promoted Pin.
TVSquared is a cross-platform TV ad measurement, analytics and optimisation platform.
Observations (1)
Complex technology stack detected
32 technologies identified. A complex stack increases maintenance burden and attack surface. Consider whether all components are actively needed.
Show your score
Drop this badge on your README, marketing site, or status page. It auto-updates every time the audit re-runs and links back to this report.
This badge auto-updates with your latest scan result.
[](https://beavercheck.com/results/7b13e804-d8ac-46ef-962f-b70368b7466c)<a href="https://beavercheck.com/results/7b13e804-d8ac-46ef-962f-b70368b7466c"><img src="https://beavercheck.com/badge?url=https%3A%2F%2Fdiabetes.org" alt="BeaverCheck Score"></a>https://beavercheck.com/badge?url=https%3A%2F%2Fdiabetes.orgExport & share
Download the audit, share with your team, or grab a fix plan ready to copy into your tracker.
Copies markdown to clipboard
Fix Plan
Three-week roadmap to ship the audit's findings, with one-click copy targets for your tracker.
Three-week fix plan
2 sprints · 3h total → projected B (81)
Sprint 1: Quick Wins
+5Highest ROI — low effort, high impact
- · Page weighs 15.6 MB (5.3 MB transferred)
- · 2 button(s) with no accessible text
- · 267 third-party resources (74% of weight)
Sprint 2: Core Fixes
+2Medium effort, high structural impact
- · 2 control(s) without accessible label
- · 1 image(s) missing alt attribute