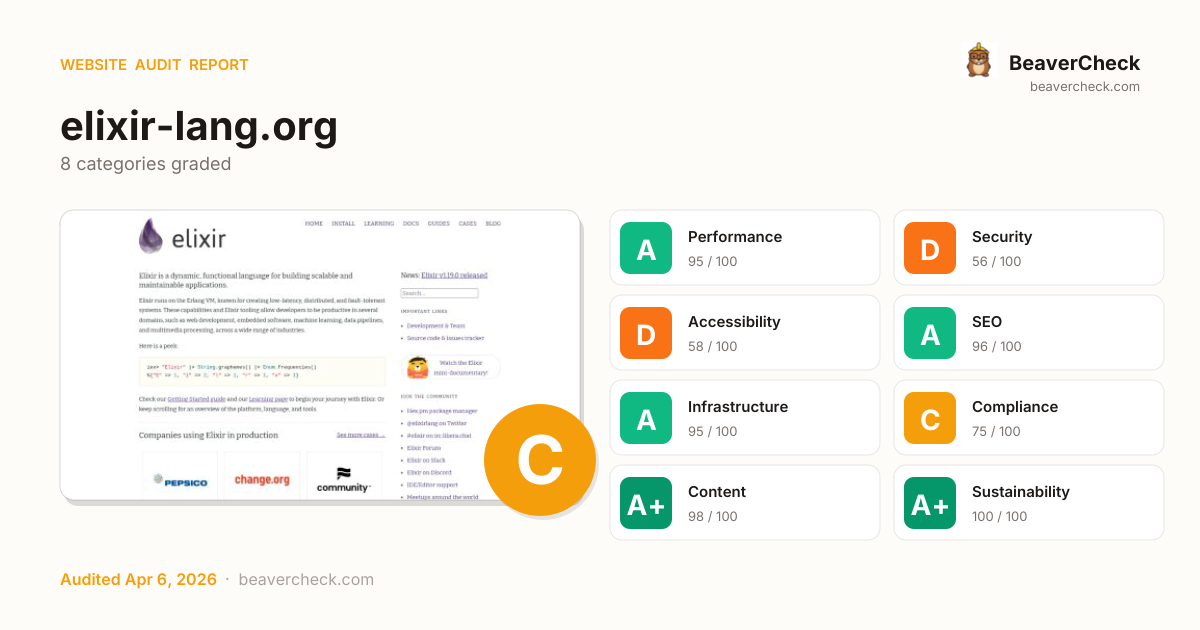
Audit overview
Security and Accessibility need attention; the other categories are in good shape.
Fix Priority Matrix
5 findingsQuick Wins
3High impact, low effort — start here.
Strategic
2High impact, requires investment.
Easy Improvements
0Small gains, minimal effort.
Nothing in this quadrant — good news.
Deprioritize
0Low impact, high effort — do last.
Nothing in this quadrant — good news.
Screenshots

Top Priorities (5)
Content-Security-Policy header is missing
Without a CSP, a single XSS bug can exfiltrate everything your users type — including credentials.
HSTS header is missing
Without HSTS, a network attacker can downgrade the very first connection to HTTP and steal the user's session.
No Content-Security-Policy header found
Without a CSP, a single XSS bug can exfiltrate everything users type — credentials, payment data, session tokens.
No <main> landmark found
Without a <main> landmark, screen-reader users can't skip past the navigation to the page content — every page starts with re-reading the menu.
No H1 heading found
No H1 means screen-reader users can't identify the page's primary topic, and Google's content-extraction degrades.
Business case
What fixing the audit's findings is worth -- and what ignoring them keeps costing.
Return on investment
$658 investment → $1,538/month returns + USD 157,500 risk avoided
Figures combine localized regulatory fine ceilings, search/conversion value priced against local CPC, and bandwidth waste estimates. Results depend on implementation quality and audience composition. Not legal or financial advice.
Conversion barriers
5 barrier(s) likely increasing bounce by ~16%.
- Page loads in 2.8sEvery additional 100ms above 2.5s costs conversions — you're 273ms over→ Target <2.5s LCP: defer non-critical scripts and optimize the hero image
- No HSTS headerReturning visitors are briefly exposed to downgrade attacks on first request→ Set Strict-Transport-Security: max-age=31536000; includeSubDomains
- No Content-Security-Policy headerHigher XSS blast radius — one compromised script can exfiltrate the checkout form→ Ship a reporting-only CSP first, then enforce once violations are clean
- No skip-to-content linkKeyboard and screen-reader users must tab through the entire header on every page→ Add a visible-on-focus <a href="#main">Skip to content</a> as the first focusable element
- 2 broken link(s) on the pageClicks land on 404s — trust drops and the session often ends→ Fix or remove the broken destinations surfaced on the Content tab
Preliminary CRO audit — each barrier links to the tab with detailed analysis.
Remediation cost
Start here for the best return on investment
Cost by category
Cost by effort level
Adjust assumptions
Team composition
Multiplier applied to dev hours to reflect QA, design, and PM overhead. Use Dev only for solo work; Full team for projects with formal review processes.
Rates reflect fully-loaded developer cost including overhead
Warning:Cost of inaction
Compliance Risk
$157,500
- No privacy policy link detectedCCPA/CPRA: USD 2,500 – USD 7,500
- Trackers detected but no cookie policy foundCCPA/CPRA: USD 2,500 – USD 7,500
- Trackers detected but no privacy policy foundCCPA/CPRA: USD 2,500 – USD 7,500
Bounce-Rate Cost
$1,023 /mo
+15.7pp bounce · ~1,573 lost visitors/mo
CPC: USD 0.65
Bandwidth Waste
$0.06 /mo
764.1 MB/mo × 0.080 USD/GB
- Optimize transfer: save ~76 KB per page loadSaves $0.06/mo
Compliance figures represent the statutory maximum fine for the most severe triggered category, capped per regulation — not the sum of per-finding penalties. Based on published regulatory fine ranges. This is not legal advice.
Unique monthly visitors from your analytics
Purchases, signups, or key actions
Optional — for revenue estimation
more engaged visitors from reduced bounce
Fix 5 critical issues to capture this value
How this is calculated
Based on Google/Deloitte research ("Milliseconds Make Millions") showing a ~7% bounce rate increase per additional second of LCP above the 2.5s "Good" threshold.
Your site's LCP: → estimated after fixes.
These are estimates based on industry research — actual results vary
Your data stays in your browser — nothing is sent to our servers
Lighthouse
Mobile
First Contentful Paint First Contentful Paint — how long until the browser renders the first piece of content. Under 1.8s is good.
1.70 s
Largest Contentful Paint Largest Contentful Paint — how long until the largest visible element loads. Under 2.5s is good.
2.77 s
Total Blocking Time Total Blocking Time — total time the main thread was blocked, preventing user input. Under 200ms is good.
0 ms
Cumulative Layout Shift Cumulative Layout Shift — measures visual stability. How much the page layout shifts during loading. Under 0.1 is good.
0.052
Speed Index Speed Index — how quickly content is visually displayed during load. Under 3.4s is good.
1.70 s
Time to Interactive Time to Interactive — how long until the page is fully interactive and responds to user input. Under 3.8s is good.
2.77 s
Desktop
First Contentful Paint First Contentful Paint — how long until the browser renders the first piece of content. Under 1.8s is good.
510 ms
Largest Contentful Paint Largest Contentful Paint — how long until the largest visible element loads. Under 2.5s is good.
734 ms
Total Blocking Time Total Blocking Time — total time the main thread was blocked, preventing user input. Under 200ms is good.
0 ms
Cumulative Layout Shift Cumulative Layout Shift — measures visual stability. How much the page layout shifts during loading. Under 0.1 is good.
0.002
Speed Index Speed Index — how quickly content is visually displayed during load. Under 3.4s is good.
510 ms
Time to Interactive Time to Interactive — how long until the page is fully interactive and responds to user input. Under 3.8s is good.
734 ms
Categories
8Performance
All checks pass
Security
Content-Security-Policy header is missing
Accessibility
No <main> landmark found
SEO
All checks pass
Infrastructure
All checks pass
Compliance
All checks pass
Content
All checks pass
Sustainability
All checks pass
How you compare
Where this site stands against peers running the same stack.
Top 10% of Google Font API sites score 76+ on Security; you're at 56 — closing this gap is the highest-leverage improvement.
Technology stack
Google Font API, on Ruby, hosted on GitHub Pages, with Fastly CDN
Stack Architecture
 Plausible
  Google Font API
  Jekyll 3.10.0
 Open Graph Plausible Analytics
  RSS
RSS  Varnish
  jQuery 1.11.2
 Ruby
Ruby  Fastly
  GitHub Pages
 All Detected Technologies (11)
Fastly is a cloud computing services provider. Fastly's cloud platform provides a content delivery network, Internet security services, load balancing, and video & streaming services.
GitHub Pages is a static site hosting service.
Ruby is an open-source object-oriented programming language.
Google Font API is a web service that supports open-source font files that can be used on your web designs.
Jekyll is a blog-aware, static site generator for personal, project, or organisation sites.
Open Graph is a protocol that is used to integrate any web page into the social graph.
RSS is a family of web feed formats used to publish frequently updated works—such as blog entries, news headlines, audio, and video—in a standardized format.
Varnish is a reverse caching proxy.
jQuery is a JavaScript library which is a free, open-source software designed to simplify HTML DOM tree traversal and manipulation, as well as event handling, CSS animation, and Ajax.
Plausible is an open-source alternative to Google Analytics.
Observations (4)
Hosted on GitHub Pages
GitHub Pages provides free static hosting with automatic HTTPS. Limitations: no server-side code, 1GB site size limit, 100GB/month bandwidth.
No build tool detected
A framework (Google Font API) was detected but no bundler was identified. The build tool may not be detectable from output patterns, or the site may use the framework's built-in bundler.
jQuery version may be outdated
Detected jQuery 1.11.2. The current major version is 3. Consider updating for security patches and new features.
Complex technology stack detected
11 technologies identified. A complex stack increases maintenance burden and attack surface. Consider whether all components are actively needed.
Show your score
Drop this badge on your README, marketing site, or status page. It auto-updates every time the audit re-runs and links back to this report.
This badge auto-updates with your latest scan result.
[](https://beavercheck.com/results/7cb0dc81-c383-43eb-88cb-3401af41a6aa)<a href="https://beavercheck.com/results/7cb0dc81-c383-43eb-88cb-3401af41a6aa"><img src="https://beavercheck.com/badge?url=https%3A%2F%2Felixir-lang.org" alt="BeaverCheck Score"></a>https://beavercheck.com/badge?url=https%3A%2F%2Felixir-lang.orgExport & share
Download the audit, share with your team, or grab a fix plan ready to copy into your tracker.
Copies markdown to clipboard
Fix Plan
Three-week roadmap to ship the audit's findings, with one-click copy targets for your tracker.
Three-week fix plan
2 sprints · 7h total → projected B (87)
Sprint 1: Quick Wins
+6Highest ROI — low effort, high impact
- · No <main> landmark found
- · No H1 heading found
- · HSTS header is missing
Sprint 2: Core Fixes
+3Medium effort, high structural impact
- · Content-Security-Policy header is missing
- · No Content-Security-Policy header found