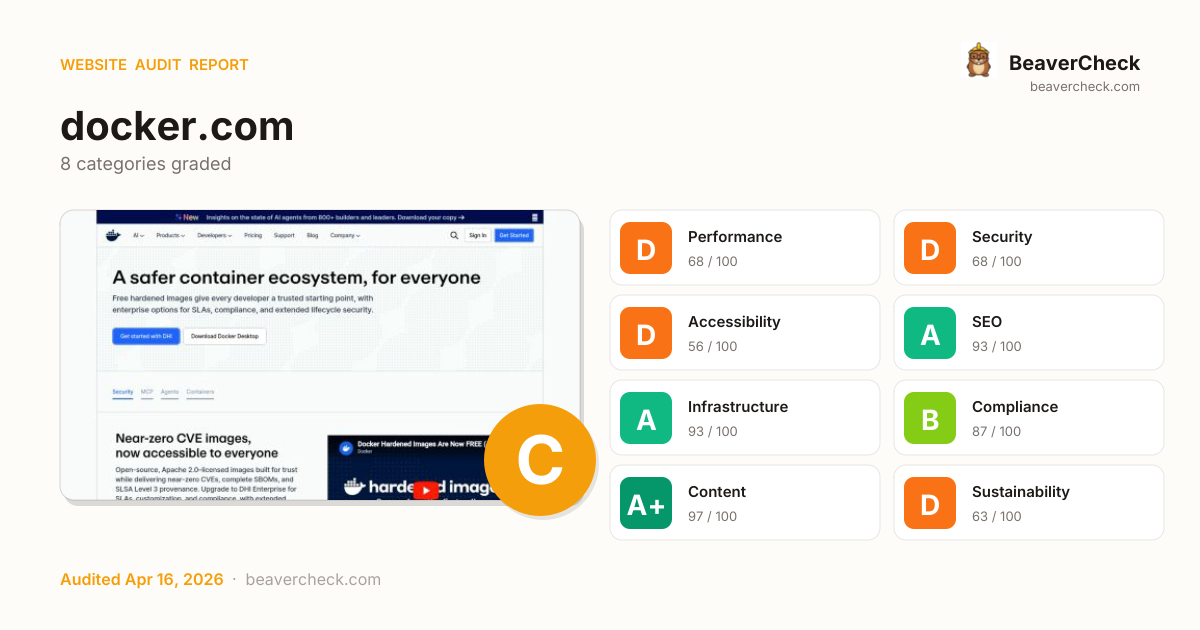
Mobile 375 × 812

Desktop 1440 × 900

Score: 74 / 100
Based on 8 categories, 0 sections
Room to improve — your 151.9s load time is above Google's 2.5s 'Good' threshold.
Several missing protections leave your users and data exposed.
Several issues make your site difficult for assistive technology users.
Well-optimized for search — your content is discoverable.
Solid infrastructure — fast server responses across the board.
Strong compliance posture across regulations.
Rich content metadata — your pages look great everywhere.
Heavier than average — reducing page weight saves energy and bandwidth.
The overall score is a weighted average of individual category scores. Categories with more impact on user experience and security carry more weight.
Weights reflect general web best practices. Individual needs may differ.
Content-Security-Policy header is missing
Security gaps expose your site and users to attacks, eroding trust.
HSTS header is missing
Security gaps expose your site and users to attacks, eroding trust.
No Content-Security-Policy header found
Security gaps expose your site and users to attacks, eroding trust.
Page weighs 55.9 MB (45.0 MB transferred)
Performance issues directly impact user engagement and conversion rates.
1 control(s) without accessible label
Accessibility issues exclude users with disabilities — up to 15% of your potential audience.
High impact, low effort — start here.
High impact, requires investment.
Small gains, minimal effort.
Nothing in this quadrant — good news.
Low impact, high effort — do last.
Nothing in this quadrant — good news.
[](https://beavercheck.com/results/8085ec53-4806-4858-a943-109c4723ea9f)<a href="https://beavercheck.com/results/8085ec53-4806-4858-a943-109c4723ea9f"><img src="https://beavercheck.com/badge?url=https%3A%2F%2Fdocker.com" alt="BeaverCheck Score"></a>https://beavercheck.com/badge?url=https%3A%2F%2Fdocker.comThis badge auto-updates with your latest scan result.
Your site performs reasonably well, but a few targeted fixes could meaningfully improve results. Your LCP of 151.9s exceeds Google's 2.5s 'Good' threshold and the 1 performance issue below directly contributes to it. Accessibility issues exclude users who rely on assistive technology — an estimated 15% of your potential audience. Addressing the critical issues below would have the most immediate impact on your user trust.
6 barrier(s) likely increasing bounce by ~25%.
Page takes 151.9s to load
+12% bounceUsers abandon at ~3s — you're 149.4s over the 2.5s threshold
Fix: Optimize render-blocking resources, preload the hero image, and compress images
High main-thread blocking time
+2% bouncePage is non-interactive for 384ms after first paint
Fix: Defer third-party scripts and split large bundles
No HSTS header
+1% bounceReturning visitors are briefly exposed to downgrade attacks on first request
Fix: Set Strict-Transport-Security: max-age=31536000; includeSubDomains
No Content-Security-Policy header
+1% bounceHigher XSS blast radius — one compromised script can exfiltrate the checkout form
Fix: Ship a reporting-only CSP first, then enforce once violations are clean
1 form field(s) without a label
+2% bounceScreen readers skip unlabeled fields; autofill can't identify them; checkout abandonment spikes
Fix: Associate every input with a visible <label for="…">; add autocomplete attributes
2 broken link(s) on the page
+3% bounceClicks land on 404s — trust drops and the session often ends
Fix: Fix or remove the broken destinations surfaced on the Content tab
Preliminary CRO audit — each barrier links to the tab with detailed analysis.
$500 investment → $11/month returns + USD 157,500 risk avoided
$500
5h · 5 findings
$11 /mo
~$136 / year
USD 157,500
if kept compliant
$150 — in quick wins — start here for the fastest payback
Figures combine localized regulatory fine ceilings, search/conversion value priced against local CPC, and bandwidth waste estimates. Results depend on implementation quality and audience composition. Not legal or financial advice.
5.0 developer hours at $100/hr
Based on United States rates ($100/hr)
Start here for the best return on investment
$13,136 / month at risk
~$157,636 / year if left unfixed
$157,500
+8 more
$11 /mo
141608.7 MB/mo × 0.080 USD/GB
Compliance figures represent the statutory maximum fine for the most severe triggered category, capped per regulation — not the sum of per-finding penalties. Based on published regulatory fine ranges. This is not legal advice.
Unique monthly visitors from your analytics
Purchases, signups, or key actions
Optional — for revenue estimation
more engaged visitors from reduced bounce
Fix 5 critical issues to capture this value
Based on Google/Deloitte research ("Milliseconds Make Millions") showing a ~7% bounce rate increase per additional second of LCP above the 2.5s "Good" threshold.
Your site's LCP: → estimated after fixes.
These are estimates based on industry research — actual results vary
Your data stays in your browser — nothing is sent to our servers
Thanks for your feedback!
We'll use a cached audit if available, or offer to scan.
Industry-standard audits powered by Google Lighthouse.
Key metrics that affect user experience.
First Contentful Paint First Contentful Paint — how long until the browser renders the first piece of content. Under 1.8s is good.
20.17 s
Largest Contentful Paint Largest Contentful Paint — how long until the largest visible element loads. Under 2.5s is good.
151.92 s
Total Blocking Time Total Blocking Time — total time the main thread was blocked, preventing user input. Under 200ms is good.
384 ms
Cumulative Layout Shift Cumulative Layout Shift — measures visual stability. How much the page layout shifts during loading. Under 0.1 is good.
0.000
Speed Index Speed Index — how quickly content is visually displayed during load. Under 3.4s is good.
31.03 s
Time to Interactive Time to Interactive — how long until the page is fully interactive and responds to user input. Under 3.8s is good.
161.26 s
Audit breakdown by category with detailed findings.
Remove large, duplicate JavaScript modules from bundles to reduce unnecessary bytes consumed by network activity.
Performance issues directly impact user engagement and conversion rates.
Polyfills and transforms enable older browsers to use new JavaScript features. However, many aren't necessary for modern browsers. Consider modifying your JavaScript build process to not transpile Baseline features, unless you know you must support older browsers. Learn why most sites can deploy ES6+ code without transpiling
Shipping ES5 transpiled code to modern browsers wastes bytes — every user with an evergreen browser pays for compatibility you don't need.
Most users today run browsers that natively support ES6+, async/await, optional chaining, and the rest of modern JavaScript. Transpiling to ES5 'just in case' adds 20-40% to your bundle for no benefit. Configure your build to target a modern browserslist, or ship a differential bundle pair (modern + legacy) with the module/nomodule pattern.
Source: Google web.dev / Lighthouse
3rd party code can significantly impact load performance. Reduce and defer loading of 3rd party code to prioritize your page's content.
Performance issues directly impact user engagement and conversion rates.
A long cache lifetime can speed up repeat visits to your page. Learn more about caching.
Performance issues directly impact user engagement and conversion rates.
| Request | Cache TTL | Transfer Size |
|---|---|---|
| assets.adobedtm.com/ba6d3e7c167e/6bf3c6b5f665/launch-55e2612a4c37.min.js | 3600.0 s | 84.1 KiB |
| cdn.cookielaw.org/scripttemplates/202306.2.0/otBannerSdk.js | 86400.0 s | 97.7 KiB |
| i.ytimg.com/vi_webp/21FE7_9DsBM/sddefault.webp | 7200.0 s | 17.7 KiB |
| cdn.cookielaw.org/logos/static/ot_company_logo.png | 86400.0 s | 19.1 KiB |
| cdn.cookielaw.org/scripttemplates/otSDKStub.js | 86400.0 s | 9.1 KiB |
| cdn.cookielaw.org/logos/static/powered_by_logo.svg | 86400.0 s | 2.5 KiB |
| static.doubleclick.net/instream/ad_status.js | 900.0 s | 495 B |
| cdn.cookielaw.org/logos/static/ot_close.svg | 86400.0 s | 620 B |
| www.gstatic.com/recaptcha/api2/logo_48.png | 604800.0 s | 2.3 KiB |
Consider setting font-display to swap or optional to ensure text is consistently visible. swap can be further optimized to mitigate layout shifts with font metric overrides.
Performance issues directly impact user engagement and conversion rates.
A forced reflow occurs when JavaScript queries geometric properties (such as offsetWidth) after styles have been invalidated by a change to the DOM state. This can result in poor performance. Learn more about forced reflows and possible mitigations.
Performance issues directly impact user engagement and conversion rates.
Optimize LCP by making the LCP image discoverable from the HTML immediately, and avoiding lazy-loading
Performance issues directly impact user engagement and conversion rates.
Avoid chaining critical requests by reducing the length of chains, reducing the download size of resources, or deferring the download of unnecessary resources to improve page load.
Performance issues directly impact user engagement and conversion rates.
Requests are blocking the page's initial render, which may delay LCP. Deferring or inlining can move these network requests out of the critical path.
Performance issues directly impact user engagement and conversion rates.
Your first network request is the most important. Reduce its latency by avoiding redirects, ensuring a fast server response, and enabling text compression.
Performance issues directly impact user engagement and conversion rates.
Reducing the download time of images can improve the perceived load time of the page and LCP. Learn more about optimizing image size
Performance issues directly impact user engagement and conversion rates.
| URL | Resource Size | Est Savings | |
|---|---|---|---|
gray article.wp-block-group > div.entry-content > div.organism > img.background-image | www.docker.com/app/uploads/brand/background/gray-1536x793.png | 28.6 KiB | 17.4 KiB |
These insights are also available in the Chrome DevTools Performance Panel - record a trace to view more detailed information.
Time to Interactive is the amount of time it takes for the page to become fully interactive. Learn more about the Time to Interactive metric.
Performance issues directly impact user engagement and conversion rates.
Redirects introduce additional delays before the page can be loaded. Learn how to avoid page redirects.
Performance issues directly impact user engagement and conversion rates.
| URL | Time Spent |
|---|---|
| docker.com/ | 755 ms |
| www.docker.com/ | 0.0 ms |
The maximum potential First Input Delay that your users could experience is the duration of the longest task. Learn more about the Maximum Potential First Input Delay metric.
Performance issues directly impact user engagement and conversion rates.
Reduce unused JavaScript and defer loading scripts until they are required to decrease bytes consumed by network activity. Learn how to reduce unused JavaScript.
Multi-megabyte JavaScript bundles delay every interactive feature on the page.
This is the Lighthouse audit fired when too much JS is shipped relative to what executes. The fix isn't a config flag — it requires bundle analysis (webpack-bundle-analyzer, rollup-plugin-visualizer), splitting routes into chunks, lazy-loading off-screen components, and removing unused dependencies. Fundamentally different from minification: minifying reduces byte count, this reduces what's downloaded at all.
Source: Google web.dev / Lighthouse
| URL | Transfer Size | Est Savings |
|---|---|---|
| www.gstatic.com/recaptcha/releases/gTpTIWhbKpxADzTzkcabhXN4/recaptcha__en.js | 361.8 KiB | 177.0 KiB |
| www.docker.com/app/themes/Ponyo/dist/js/index.js?ver=c6fa09706ca007368240 | 235.2 KiB | 124.1 KiB |
| www.googletagmanager.com/gtm.js?id=GTM-WL2QLG5 | 168.7 KiB | 81.2 KiB |
| cdn.cookielaw.org/scripttemplates/202306.2.0/otBannerSdk.js | 97.4 KiB | 50.3 KiB |
| assets.adobedtm.com/ba6d3e7c167e/6bf3c6b5f665/launch-55e2612a4c37.min.js | 83.9 KiB | 44.5 KiB |
| www.docker.com/wp/wp-includes/js/jquery/jquery.min.js?ver=3.7.1 | 34.6 KiB | 23.4 KiB |
Consider reducing the time spent parsing, compiling, and executing JS. You may find delivering smaller JS payloads helps with this. Learn how to reduce Javascript execution time.
Performance issues directly impact user engagement and conversion rates.
| URL | Total CPU Time | Script Evaluation | Script Parse |
|---|---|---|---|
| www.docker.com/ | 2.5 s | 650 ms | 23 ms |
| Unattributable | 1.5 s | 114 ms | 0.0 ms |
| www.docker.com/app/themes/Ponyo/dist/js/index.js?ver=c6fa09706ca007368240 | 485 ms | 381 ms | 84 ms |
| www.gstatic.com/recaptcha/releases/gTpTIWhbKpxADzTzkcabhXN4/recaptcha__en.js | 437 ms | 322 ms | 70 ms |
| www.googletagmanager.com/gtm.js?id=GTM-WL2QLG5 | 312 ms | 253 ms | 55 ms |
| cdn.cookielaw.org/scripttemplates/202306.2.0/otBannerSdk.js | 280 ms | 188 ms | 29 ms |
| assets.adobedtm.com/ba6d3e7c167e/6bf3c6b5f665/launch-55e2612a4c37.min.js | 257 ms | 221 ms | 30 ms |
| js-agent.newrelic.com/nr-spa-1.312.1.min.js | 222 ms | 169 ms | 15 ms |
| www.docker.com/app/themes/Ponyo/dist/js/ponyo.js?ver=308081ab31238164a132 | 75 ms | 30 ms | 0.3 ms |
Consider reducing the time spent parsing, compiling and executing JS. You may find delivering smaller JS payloads helps with this. Learn how to minimize main-thread work
Performance issues directly impact user engagement and conversion rates.
| Category | Time Spent |
|---|---|
| Script Evaluation | 2.6 s |
| Other | 2.0 s |
| Style & Layout | 1.0 s |
| Rendering | 381 ms |
| Script Parsing & Compilation | 348 ms |
| Parse HTML & CSS | 127 ms |
| Garbage Collection | 66 ms |
Reduce unused rules from stylesheets and defer CSS not used for above-the-fold content to decrease bytes consumed by network activity. Learn how to reduce unused CSS.
Performance issues directly impact user engagement and conversion rates.
| URL | Transfer Size | Est Savings |
|---|---|---|
| #onetrust-banner-sdk{-ms-text-size-adjust:100%;-webkit-text-size-adjust:100%} … | 19.6 KiB | 17.3 KiB |
| www.docker.com/app/themes/Ponyo/dist/css/screen.css?ver=095f5c1f2a2197d8b78e | 16.9 KiB | 12.4 KiB |
Large network payloads cost users real money and are highly correlated with long load times. Learn how to reduce payload sizes.
Performance issues directly impact user engagement and conversion rates.
Set an explicit width and height on image elements to reduce layout shifts and improve CLS. Learn how to set image dimensions
Performance issues directly impact user engagement and conversion rates.
| URL | |
|---|---|
header.site-header > div#docker-announcement-bar > div > img header.site-header > div#docker-announcement-bar > div > img | www.docker.com/app/uploads/2024/01/icon-new.svg |
More information about the performance of your application. These numbers don't directly affect the Performance score.
These checks highlight opportunities to improve the accessibility of your web app. Automatic detection can only detect a subset of issues and does not guarantee the accessibility of your web app, so manual testing is also encouraged.
Low-contrast text is difficult or impossible for many users to read. Learn how to provide sufficient color contrast.
Performance issues directly impact user engagement and conversion rates.
| Failing Elements |
|---|
MCP div.wp-block-ponyo-boone > div.wp-block-ponyo-tatiana > a.wp-block-ponyo-tab > div.tab-text |
Agents div.wp-block-ponyo-boone > div.wp-block-ponyo-tatiana > a.wp-block-ponyo-tab > div.tab-text |
Containers div.wp-block-ponyo-boone > div.wp-block-ponyo-tatiana > a.wp-block-ponyo-tab > div.tab-text |
Cookies Settings div.container > div.wp-block-ponyo-franklin > div.wp-block-ponyo-foster > button#ot-sdk-btn |
These are opportunities to improve the legibility of your content.
Properly ordered headings that do not skip levels convey the semantic structure of the page, making it easier to navigate and understand when using assistive technologies. Learn more about heading order.
Performance issues directly impact user engagement and conversion rates.
| Failing Elements |
|---|
Apache 2.0 freedom div.wp-block-ponyo-erika > div.container > div.copy-container > h4.wp-block-ponyo-heading |
Five pillars of supply chain security div.wp-block-ponyo-erika > div.container > div.copy-container > h4.wp-block-ponyo-heading |
Build once, run anywhere div.wp-block-ponyo-erika > div.container > div.copy-container > h4.wp-block-ponyo-heading |
These are opportunities to improve keyboard navigation in your application.
Link text (and alternate text for images, when used as links) that is discernible, unique, and focusable improves the navigation experience for screen reader users. Learn how to make links accessible.
Performance issues directly impact user engagement and conversion rates.
| Failing Elements |
|---|
div.wp-block-group > header.site-header > div.wp-block-group > a.logo div.wp-block-group > header.site-header > div.wp-block-group > a.logo |
div.wp-block-ponyo-newsletter-social > ul.social-wrap > li > a div.wp-block-ponyo-newsletter-social > ul.social-wrap > li > a |
These are opportunities to improve the semantics of the controls in your application. This may enhance the experience for users of assistive technology, like a screen reader.
Screen readers have a specific way of announcing lists. Ensuring proper list structure aids screen reader output. Learn more about proper list structure.
Performance issues directly impact user engagement and conversion rates.
| Failing Elements |
|---|
Products
Products Overview
Docker Desktop
Docker Hub
Docker Scout
Docker Build … div.wp-block-ponyo-freddie > div.menu-container > div.wp-block-ponyo-faith > ul |
Features
Command Line Interface
IDE Extensions
Container Runtime
Docker Extensi… div.wp-block-ponyo-freddie > div.menu-container > div.wp-block-ponyo-faith > ul |
Developers
Documentation
Getting Started
Trainings
Extensions SDK
Community
Ope… div.wp-block-ponyo-freddie > div.menu-container > div.wp-block-ponyo-faith > ul |
Pricing
Personal
Pro
Team
Business
Premium Support and TAM
Pricing FAQ
Contact … div.wp-block-ponyo-freddie > div.menu-container > div.wp-block-ponyo-faith > ul |
Company
About Us
What is a Container
Blog
Why Docker
Trust
Customer Success
Par… div.wp-block-ponyo-freddie > div.menu-container > div.wp-block-ponyo-faith > ul |
Languages
English
日本語 div.wp-block-ponyo-freddie > div.menu-container > div.wp-block-ponyo-faith > ul |
These are opportunities to improve the experience of reading tabular or list data using assistive technology, like a screen reader.
Source maps translate minified code to the original source code. This helps developers debug in production. In addition, Lighthouse is able to provide further insights. Consider deploying source maps to take advantage of these benefits. Learn more about source maps.
Performance issues directly impact user engagement and conversion rates.
These checks ensure that your page is following basic search engine optimization advice. There are many additional factors Lighthouse does not score here that may affect your search ranking, including performance on Core Web Vitals. Learn more about Google Search Essentials.
Descriptive link text helps search engines understand your content. Learn how to make links more accessible.
Performance issues directly impact user engagement and conversion rates.
| Link destination | Link Text |
|---|---|
| cookiepedia.co.uk/giving-consent-to-cookies | More information |
Format your HTML in a way that enables crawlers to better understand your app’s content.
Industry-standard audits powered by Google Lighthouse. — Desktop
Key metrics that affect user experience. — Desktop
First Contentful Paint First Contentful Paint — how long until the browser renders the first piece of content. Under 1.8s is good.
3.99 s
Largest Contentful Paint Largest Contentful Paint — how long until the largest visible element loads. Under 2.5s is good.
24.91 s
Total Blocking Time Total Blocking Time — total time the main thread was blocked, preventing user input. Under 200ms is good.
22 ms
Cumulative Layout Shift Cumulative Layout Shift — measures visual stability. How much the page layout shifts during loading. Under 0.1 is good.
0.001
Speed Index Speed Index — how quickly content is visually displayed during load. Under 3.4s is good.
7.22 s
Time to Interactive Time to Interactive — how long until the page is fully interactive and responds to user input. Under 3.8s is good.
25.04 s
Audit breakdown by category with detailed findings.
Remove large, duplicate JavaScript modules from bundles to reduce unnecessary bytes consumed by network activity.
Performance issues directly impact user engagement and conversion rates.
Polyfills and transforms enable older browsers to use new JavaScript features. However, many aren't necessary for modern browsers. Consider modifying your JavaScript build process to not transpile Baseline features, unless you know you must support older browsers. Learn why most sites can deploy ES6+ code without transpiling
Shipping ES5 transpiled code to modern browsers wastes bytes — every user with an evergreen browser pays for compatibility you don't need.
Most users today run browsers that natively support ES6+, async/await, optional chaining, and the rest of modern JavaScript. Transpiling to ES5 'just in case' adds 20-40% to your bundle for no benefit. Configure your build to target a modern browserslist, or ship a differential bundle pair (modern + legacy) with the module/nomodule pattern.
Source: Google web.dev / Lighthouse
3rd party code can significantly impact load performance. Reduce and defer loading of 3rd party code to prioritize your page's content.
Performance issues directly impact user engagement and conversion rates.
A long cache lifetime can speed up repeat visits to your page. Learn more about caching.
Performance issues directly impact user engagement and conversion rates.
| Request | Cache TTL | Transfer Size |
|---|---|---|
| assets.adobedtm.com/ba6d3e7c167e/6bf3c6b5f665/launch-55e2612a4c37.min.js | 3600.0 s | 84.1 KiB |
| cdn.cookielaw.org/scripttemplates/202306.2.0/otBannerSdk.js | 86400.0 s | 97.7 KiB |
| i.ytimg.com/vi_webp/21FE7_9DsBM/sddefault.webp | 7200.0 s | 17.7 KiB |
| cdn.cookielaw.org/logos/static/ot_company_logo.png | 86400.0 s | 19.1 KiB |
| cdn.cookielaw.org/scripttemplates/otSDKStub.js | 86400.0 s | 9.1 KiB |
| cdn.cookielaw.org/logos/static/powered_by_logo.svg | 86400.0 s | 2.5 KiB |
| /vr50ZXiY9tM1xNgVT2cLt0sGSdL_xuvVYA0fPtzpB9-LNE32KN7bvq75... | 86400.0 s | 2.0 KiB |
| static.doubleclick.net/instream/ad_status.js | 900.0 s | 494 B |
| cdn.cookielaw.org/logos/static/ot_close.svg | 86400.0 s | 648 B |
| www.gstatic.com/recaptcha/api2/logo_48.png | 604800.0 s | 2.3 KiB |
Consider setting font-display to swap or optional to ensure text is consistently visible. swap can be further optimized to mitigate layout shifts with font metric overrides.
Performance issues directly impact user engagement and conversion rates.
A forced reflow occurs when JavaScript queries geometric properties (such as offsetWidth) after styles have been invalidated by a change to the DOM state. This can result in poor performance. Learn more about forced reflows and possible mitigations.
Performance issues directly impact user engagement and conversion rates.
Optimize LCP by making the LCP image discoverable from the HTML immediately, and avoiding lazy-loading
Performance issues directly impact user engagement and conversion rates.
Avoid chaining critical requests by reducing the length of chains, reducing the download size of resources, or deferring the download of unnecessary resources to improve page load.
Performance issues directly impact user engagement and conversion rates.
Requests are blocking the page's initial render, which may delay LCP. Deferring or inlining can move these network requests out of the critical path.
Performance issues directly impact user engagement and conversion rates.
Your first network request is the most important. Reduce its latency by avoiding redirects, ensuring a fast server response, and enabling text compression.
Performance issues directly impact user engagement and conversion rates.
These insights are also available in the Chrome DevTools Performance Panel - record a trace to view more detailed information.
Time to Interactive is the amount of time it takes for the page to become fully interactive. Learn more about the Time to Interactive metric.
Performance issues directly impact user engagement and conversion rates.
Redirects introduce additional delays before the page can be loaded. Learn how to avoid page redirects.
Performance issues directly impact user engagement and conversion rates.
| URL | Time Spent |
|---|---|
| docker.com/ | 239 ms |
| www.docker.com/ | 0.0 ms |
Reduce unused JavaScript and defer loading scripts until they are required to decrease bytes consumed by network activity. Learn how to reduce unused JavaScript.
Multi-megabyte JavaScript bundles delay every interactive feature on the page.
This is the Lighthouse audit fired when too much JS is shipped relative to what executes. The fix isn't a config flag — it requires bundle analysis (webpack-bundle-analyzer, rollup-plugin-visualizer), splitting routes into chunks, lazy-loading off-screen components, and removing unused dependencies. Fundamentally different from minification: minifying reduces byte count, this reduces what's downloaded at all.
Source: Google web.dev / Lighthouse
| URL | Transfer Size | Est Savings |
|---|---|---|
| www.gstatic.com/recaptcha/releases/gTpTIWhbKpxADzTzkcabhXN4/recaptcha__en.js | 361.8 KiB | 177.1 KiB |
| www.docker.com/app/themes/Ponyo/dist/js/index.js?ver=c6fa09706ca007368240 | 235.2 KiB | 124.1 KiB |
| www.googletagmanager.com/gtm.js?id=GTM-WL2QLG5 | 168.7 KiB | 81.2 KiB |
| cdn.cookielaw.org/scripttemplates/202306.2.0/otBannerSdk.js | 97.4 KiB | 50.3 KiB |
| assets.adobedtm.com/ba6d3e7c167e/6bf3c6b5f665/launch-55e2612a4c37.min.js | 83.9 KiB | 44.5 KiB |
| www.docker.com/wp/wp-includes/js/jquery/jquery.min.js?ver=3.7.1 | 34.6 KiB | 23.4 KiB |
Reduce unused rules from stylesheets and defer CSS not used for above-the-fold content to decrease bytes consumed by network activity. Learn how to reduce unused CSS.
Performance issues directly impact user engagement and conversion rates.
| URL | Transfer Size | Est Savings |
|---|---|---|
| #onetrust-banner-sdk{-ms-text-size-adjust:100%;-webkit-text-size-adjust:100%} … | 19.6 KiB | 17.0 KiB |
| www.docker.com/app/themes/Ponyo/dist/css/screen.css?ver=095f5c1f2a2197d8b78e | 16.9 KiB | 12.5 KiB |
Large network payloads cost users real money and are highly correlated with long load times. Learn how to reduce payload sizes.
Performance issues directly impact user engagement and conversion rates.
Set an explicit width and height on image elements to reduce layout shifts and improve CLS. Learn how to set image dimensions
Performance issues directly impact user engagement and conversion rates.
| URL | |
|---|---|
header.site-header > div#docker-announcement-bar > div > img header.site-header > div#docker-announcement-bar > div > img | www.docker.com/app/uploads/2024/01/icon-new.svg |
More information about the performance of your application. These numbers don't directly affect the Performance score.
These checks highlight opportunities to improve the accessibility of your web app. Automatic detection can only detect a subset of issues and does not guarantee the accessibility of your web app, so manual testing is also encouraged.
Low-contrast text is difficult or impossible for many users to read. Learn how to provide sufficient color contrast.
Performance issues directly impact user engagement and conversion rates.
| Failing Elements |
|---|
MCP div.wp-block-ponyo-boone > div.wp-block-ponyo-tatiana > a.wp-block-ponyo-tab > div.tab-text |
Agents div.wp-block-ponyo-boone > div.wp-block-ponyo-tatiana > a.wp-block-ponyo-tab > div.tab-text |
Containers div.wp-block-ponyo-boone > div.wp-block-ponyo-tatiana > a.wp-block-ponyo-tab > div.tab-text |
Cookies Settings div.container > div.wp-block-ponyo-franklin > div.wp-block-ponyo-foster > button#ot-sdk-btn |
These are opportunities to improve the legibility of your content.
Properly ordered headings that do not skip levels convey the semantic structure of the page, making it easier to navigate and understand when using assistive technologies. Learn more about heading order.
Performance issues directly impact user engagement and conversion rates.
| Failing Elements |
|---|
Apache 2.0 freedom div.wp-block-ponyo-erika > div.container > div.copy-container > h4.wp-block-ponyo-heading |
Five pillars of supply chain security div.wp-block-ponyo-erika > div.container > div.copy-container > h4.wp-block-ponyo-heading |
Build once, run anywhere div.wp-block-ponyo-erika > div.container > div.copy-container > h4.wp-block-ponyo-heading |
These are opportunities to improve keyboard navigation in your application.
Link text (and alternate text for images, when used as links) that is discernible, unique, and focusable improves the navigation experience for screen reader users. Learn how to make links accessible.
Performance issues directly impact user engagement and conversion rates.
| Failing Elements |
|---|
div.wp-block-group > header.site-header > div.wp-block-group > a.logo div.wp-block-group > header.site-header > div.wp-block-group > a.logo |
div.wp-block-ponyo-newsletter-social > ul.social-wrap > li > a div.wp-block-ponyo-newsletter-social > ul.social-wrap > li > a |
These are opportunities to improve the semantics of the controls in your application. This may enhance the experience for users of assistive technology, like a screen reader.
Screen readers have a specific way of announcing lists. Ensuring proper list structure aids screen reader output. Learn more about proper list structure.
Performance issues directly impact user engagement and conversion rates.
| Failing Elements |
|---|
Products
Products Overview
Docker Desktop
Docker Hub
Docker Scout
Docker Build … div.wp-block-ponyo-freddie > div.menu-container > div.wp-block-ponyo-faith > ul |
Features
Command Line Interface
IDE Extensions
Container Runtime
Docker Extensi… div.wp-block-ponyo-freddie > div.menu-container > div.wp-block-ponyo-faith > ul |
Developers
Documentation
Getting Started
Trainings
Extensions SDK
Community
Ope… div.wp-block-ponyo-freddie > div.menu-container > div.wp-block-ponyo-faith > ul |
Pricing
Personal
Pro
Team
Business
Premium Support and TAM
Pricing FAQ
Contact … div.wp-block-ponyo-freddie > div.menu-container > div.wp-block-ponyo-faith > ul |
Company
About Us
What is a Container
Blog
Why Docker
Trust
Customer Success
Par… div.wp-block-ponyo-freddie > div.menu-container > div.wp-block-ponyo-faith > ul |
Languages
English
日本語 div.wp-block-ponyo-freddie > div.menu-container > div.wp-block-ponyo-faith > ul |
These are opportunities to improve the experience of reading tabular or list data using assistive technology, like a screen reader.
Source maps translate minified code to the original source code. This helps developers debug in production. In addition, Lighthouse is able to provide further insights. Consider deploying source maps to take advantage of these benefits. Learn more about source maps.
Performance issues directly impact user engagement and conversion rates.
These checks ensure that your page is following basic search engine optimization advice. There are many additional factors Lighthouse does not score here that may affect your search ranking, including performance on Core Web Vitals. Learn more about Google Search Essentials.
Descriptive link text helps search engines understand your content. Learn how to make links more accessible.
Performance issues directly impact user engagement and conversion rates.
| Link destination | Link Text |
|---|---|
| cookiepedia.co.uk/giving-consent-to-cookies | More information |
Format your HTML in a way that enables crawlers to better understand your app’s content.
Send Feedback