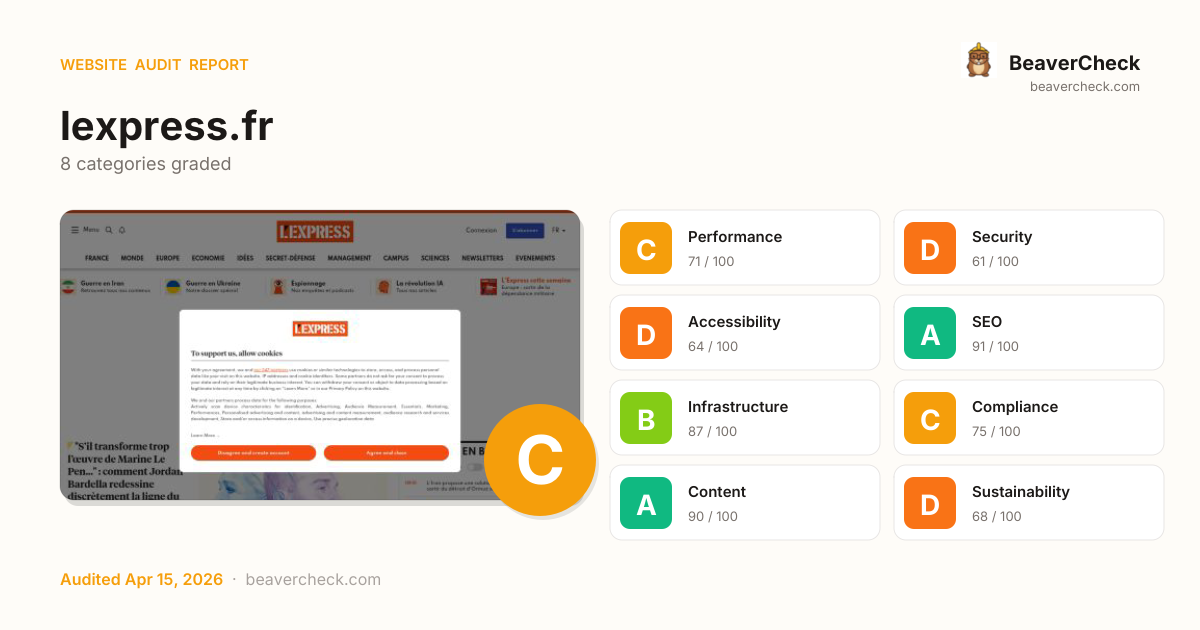
Mobile 375 × 812

Desktop 1440 × 900

Score: 72 / 100
Based on 8 categories, 0 sections
Decent speed, but optimizing further could improve engagement.
Several missing protections leave your users and data exposed.
Several issues make your site difficult for assistive technology users.
Well-optimized for search — your content is discoverable.
Solid infrastructure — fast server responses across the board.
Mostly compliant — a few items need attention.
Rich content metadata — your pages look great everywhere.
Heavier than average — reducing page weight saves energy and bandwidth.
The overall score is a weighted average of individual category scores. Categories with more impact on user experience and security carry more weight.
Weights reflect general web best practices. Individual needs may differ.
Content-Security-Policy header is missing
Security gaps expose your site and users to attacks, eroding trust.
HSTS header is missing
Security gaps expose your site and users to attacks, eroding trust.
No Content-Security-Policy header found
Security gaps expose your site and users to attacks, eroding trust.
1 control(s) without accessible label
Accessibility issues exclude users with disabilities — up to 15% of your potential audience.
2 button(s) with no accessible text
Accessibility issues exclude users with disabilities — up to 15% of your potential audience.
High impact, low effort — start here.
High impact, requires investment.
Small gains, minimal effort.
Nothing in this quadrant — good news.
Low impact, high effort — do last.
Nothing in this quadrant — good news.
[](https://beavercheck.com/results/82991feb-803e-4aba-82d2-5e3a0692abbb)<a href="https://beavercheck.com/results/82991feb-803e-4aba-82d2-5e3a0692abbb"><img src="https://beavercheck.com/badge?url=https%3A%2F%2Flexpress.fr" alt="BeaverCheck Score"></a>https://beavercheck.com/badge?url=https%3A%2F%2Flexpress.frThis badge auto-updates with your latest scan result.
Your site performs reasonably well, but a few targeted fixes could meaningfully improve results. Addressing the critical issues below would have the most immediate impact on your user trust.
€360 investment → €1,114/month returns + EUR 120,500,000 risk avoided
€360
4h · 5 findings
€1,114 /mo
~€13,363 / year
EUR 120,500,000
if kept compliant
€120 — in quick wins — start here for the fastest payback
Figures combine localized regulatory fine ceilings, search/conversion value priced against local CPC, and bandwidth waste estimates. Results depend on implementation quality and audience composition. Not legal or financial advice.
4.5 developer hours at €80/hr
Based on France rates (€80/hr)
Start here for the best return on investment
€10,041,667 / month at risk
~€120,500,007 / year if left unfixed
€120,500,000
+5 more
€0.62 /mo
8343.9 MB/mo × 0.074 EUR/GB
Compliance figures represent the statutory maximum fine for the most severe triggered category, capped per regulation — not the sum of per-finding penalties. Based on published regulatory fine ranges. This is not legal advice.
Unique monthly visitors from your analytics
Purchases, signups, or key actions
Optional — for revenue estimation
more engaged visitors from reduced bounce
Fix 5 critical issues to capture this value
Based on Google/Deloitte research ("Milliseconds Make Millions") showing a ~7% bounce rate increase per additional second of LCP above the 2.5s "Good" threshold.
Your site's LCP: → estimated after fixes.
These are estimates based on industry research — actual results vary
Your data stays in your browser — nothing is sent to our servers
Thanks for your feedback!
We'll use a cached audit if available, or offer to scan.
Industry-standard audits powered by Google Lighthouse.
Key metrics that affect user experience.
First Contentful Paint First Contentful Paint — how long until the browser renders the first piece of content. Under 1.8s is good.
3.07 s
Largest Contentful Paint Largest Contentful Paint — how long until the largest visible element loads. Under 2.5s is good.
3.22 s
Total Blocking Time Total Blocking Time — total time the main thread was blocked, preventing user input. Under 200ms is good.
1.93 s
Cumulative Layout Shift Cumulative Layout Shift — measures visual stability. How much the page layout shifts during loading. Under 0.1 is good.
0.116
Speed Index Speed Index — how quickly content is visually displayed during load. Under 3.4s is good.
5.06 s
Time to Interactive Time to Interactive — how long until the page is fully interactive and responds to user input. Under 3.8s is good.
21.61 s
Audit breakdown by category with detailed findings.
Remove large, duplicate JavaScript modules from bundles to reduce unnecessary bytes consumed by network activity.
Performance issues directly impact user engagement and conversion rates.
Polyfills and transforms enable older browsers to use new JavaScript features. However, many aren't necessary for modern browsers. Consider modifying your JavaScript build process to not transpile Baseline features, unless you know you must support older browsers. Learn why most sites can deploy ES6+ code without transpiling
Shipping ES5 transpiled code to modern browsers wastes bytes — every user with an evergreen browser pays for compatibility you don't need.
Most users today run browsers that natively support ES6+, async/await, optional chaining, and the rest of modern JavaScript. Transpiling to ES5 'just in case' adds 20-40% to your bundle for no benefit. Configure your build to target a modern browserslist, or ship a differential bundle pair (modern + legacy) with the module/nomodule pattern.
Source: Google web.dev / Lighthouse
3rd party code can significantly impact load performance. Reduce and defer loading of 3rd party code to prioritize your page's content.
Performance issues directly impact user engagement and conversion rates.
Layout shifts occur when elements move absent any user interaction. Investigate the causes of layout shifts, such as elements being added, removed, or their fonts changing as the page loads.
Performance issues directly impact user engagement and conversion rates.
Your first network request is the most important. Reduce its latency by avoiding redirects, ensuring a fast server response, and enabling text compression.
Performance issues directly impact user engagement and conversion rates.
Avoid chaining critical requests by reducing the length of chains, reducing the download size of resources, or deferring the download of unnecessary resources to improve page load.
Performance issues directly impact user engagement and conversion rates.
Requests are blocking the page's initial render, which may delay LCP. Deferring or inlining can move these network requests out of the critical path.
Performance issues directly impact user engagement and conversion rates.
| URL | Transfer Size | Duration |
|---|---|---|
| www.lexpress.fr/pf/dist/components/combinations/default.css?d=827&mxId=00000000 | 81.7 KiB | 453 ms |
| www.lexpress.fr/pf/dist/components/output-types/default.css?d=827&mxId=00000000 | 1.6 KiB |
A long cache lifetime can speed up repeat visits to your page. Learn more about caching.
Performance issues directly impact user engagement and conversion rates.
Reducing the download time of images can improve the perceived load time of the page and LCP. Learn more about optimizing image size
Performance issues directly impact user engagement and conversion rates.
| URL | Resource Size | Est Savings | |
|---|---|---|---|
Péter Magyar et le Premier ministre hongrois, Viktor Orban, le 9 octobre 2024 a… div.regular__cover > a.regular__cover > picture > img | /resizer/v2/YLVMJZPQXBEMRE7SOP3QSFWKRY.jpg?auth=91a7df9e5... | 24.7 KiB | 12.0 KiB |
©Mc2 Tajh Payne/U.S Navy/ZUMAPRESS.com/MAXPPP - April 2, 2026, Uss Gerald R For… article.article-fleuve-item > picture.article-fleuve-item__picture > a > img | /resizer/v2/RUYZZGCSR5G4FL4ZLA6AE7V5KY.jpg?auth=3790d4a19... | 11.1 KiB | 7.2 KiB |
Des pourparlers à Washington entre Israël et le Liban, le 14 avril 2026. article.article-fleuve-item > picture.article-fleuve-item__picture > a > img | /resizer/v2/TYSB5A2JO5BNHPFGUAKCLF6L2U.JPG?auth=7b8b84e1e... | 10.3 KiB | 6.4 KiB |
Logo div.didomi-popup-container > div.didomi-popup-view > div.didomi-popup-notice-logo-container > img.didomi-popup-notice-logo | /upload/images/logo/logo_web_cartouche_lexpress_rouge_des... | 7.4 KiB | 5.6 KiB |
Un avion F-35A Lightning II américain. article.article-fleuve-item > picture.article-fleuve-item__picture > a > img | /resizer/v2/TGUWFCOJNJEWPPEEKHN35TUHQM.jpg?auth=670156c5e... | 8.5 KiB | 4.6 KiB |
Le commissaire européen à l'Energie, Dan Jorgensen, participe à une conférence … article.article-fleuve-item > picture.article-fleuve-item__picture > a > img | /resizer/v2/JCDV7LQHIFG2VN2AHNTCUAQ7WQ.JPG?auth=d4fff96c8... | 7.9 KiB | 4.0 KiB |
These insights are also available in the Chrome DevTools Performance Panel - record a trace to view more detailed information.
Redirects introduce additional delays before the page can be loaded. Learn how to avoid page redirects.
Performance issues directly impact user engagement and conversion rates.
| URL | Time Spent |
|---|---|
| lexpress.fr/ | 782 ms |
| www.lexpress.fr/ | 0.0 ms |
These are the largest layout shifts observed on the page. Each table item represents a single layout shift, and shows the element that shifted the most. Below each item are possible root causes that led to the layout shift. Some of these layout shifts may not be included in the CLS metric value due to windowing. Learn how to improve CLS
Performance issues directly impact user engagement and conversion rates.
| Element | Layout shift score |
|---|---|
3902-RN div.regular__cover > a.regular__cover > picture > img | 0.088 |
To support us, allow cookies
With your agreement, we and our 347 partners use … div.notranslate > div#didomi-popup > div.didomi-exterior-border > div.didomi-popup-container | 0.028 |
Time to Interactive is the amount of time it takes for the page to become fully interactive. Learn more about the Time to Interactive metric.
Performance issues directly impact user engagement and conversion rates.
The maximum potential First Input Delay that your users could experience is the duration of the longest task. Learn more about the Maximum Potential First Input Delay metric.
Performance issues directly impact user engagement and conversion rates.
Reduce unused rules from stylesheets and defer CSS not used for above-the-fold content to decrease bytes consumed by network activity. Learn how to reduce unused CSS.
Performance issues directly impact user engagement and conversion rates.
| URL | Transfer Size | Est Savings |
|---|---|---|
| www.lexpress.fr/pf/dist/components/combinations/default.css?d=827&mxId=00000000 | 81.4 KiB | 76.5 KiB |
| 18.0 KiB | 14.4 KiB |
Consider reducing the time spent parsing, compiling, and executing JS. You may find delivering smaller JS payloads helps with this. Learn how to reduce Javascript execution time.
Performance issues directly impact user engagement and conversion rates.
| URL | Total CPU Time | Script Evaluation | Script Parse |
|---|---|---|---|
| www.lexpress.fr/ | 1.2 s | 39 ms | 141 ms |
| www.lexpress.fr/pf/dist/engine/react.js?d=827&mxId=00000000 | 1.2 s | 1.0 s | 32 ms |
| scripts.stay22.com/letmeallez.js | 1.0 s | 938 ms | 21 ms |
| Unattributable | 946 ms | 157 ms | 0.0 ms |
| www.lexpress.fr/pf/dist/components/combinations/default.js?d=827&mxId=00000000 | 482 ms | 337 ms | 122 ms |
| /sdk/d4911c3d5b4b9a80b40e05167f53d1b1e8da81f3/modern/sdk.... | 202 ms | 165 ms | 29 ms |
| www.googletagmanager.com/gtm.js?id=GTM-MK3GTGR | 165 ms | 135 ms | 29 ms |
| /sdk/d4911c3d5b4b9a80b40e05167f53d1b1e8da81f3/modern/ui-w... | 133 ms | 75 ms | 17 ms |
| accounts.google.com/gsi/client | 99 ms | 20 ms | 28 ms |
| cdn-eu.realytics.net/realytics-1.2.min.js | 97 ms | 77 ms | 5.9 ms |
| /f9b4c6b2-7c8e-43fd-9c79-f1fc18663cf0/loader.js?target_ty... | 77 ms | 13 ms | 63 ms |
| cdn.amplitude.com/libs/analytics-browser-2.11.7-min.js.gz | 72 ms | 61 ms | 10.0 ms |
| c2.taboola.com/nr/lexpress-web/newsroom.js | 61 ms | 54 ms | 6.0 ms |
Consider reducing the time spent parsing, compiling and executing JS. You may find delivering smaller JS payloads helps with this. Learn how to minimize main-thread work
Performance issues directly impact user engagement and conversion rates.
| Category | Time Spent |
|---|---|
| Script Evaluation | 3.2 s |
| Other | 945 ms |
| Style & Layout | 755 ms |
| Script Parsing & Compilation | 534 ms |
| Rendering | 207 ms |
| Parse HTML & CSS | 190 ms |
| Garbage Collection | 114 ms |
Reduce unused JavaScript and defer loading scripts until they are required to decrease bytes consumed by network activity. Learn how to reduce unused JavaScript.
Multi-megabyte JavaScript bundles delay every interactive feature on the page.
This is the Lighthouse audit fired when too much JS is shipped relative to what executes. The fix isn't a config flag — it requires bundle analysis (webpack-bundle-analyzer, rollup-plugin-visualizer), splitting routes into chunks, lazy-loading off-screen components, and removing unused dependencies. Fundamentally different from minification: minifying reduces byte count, this reduces what's downloaded at all.
Source: Google web.dev / Lighthouse
| URL | Transfer Size | Est Savings |
|---|---|---|
| www.lexpress.fr/pf/dist/components/combinations/default.js?d=827&mxId=00000000 | 358.0 KiB | 238.8 KiB |
| accounts.google.com/gsi/client | 95.4 KiB | 71.8 KiB |
| www.googletagmanager.com/gtm.js?id=GTM-MK3GTGR | 138.5 KiB | 65.3 KiB |
| scripts.stay22.com/letmeallez.js | 107.3 KiB | 61.2 KiB |
| /sdk/d4911c3d5b4b9a80b40e05167f53d1b1e8da81f3/modern/sdk.... | 100.7 KiB | 44.2 KiB |
| www.lexpress.fr/pf/dist/engine/react.js?d=827&mxId=00000000 | 94.4 KiB | 30.5 KiB |
Large network payloads cost users real money and are highly correlated with long load times. Learn how to reduce payload sizes.
Performance issues directly impact user engagement and conversion rates.
Set an explicit width and height on image elements to reduce layout shifts and improve CLS. Learn how to set image dimensions
Performance issues directly impact user engagement and conversion rates.
| URL | |
|---|---|
Logo div.didomi-popup-container > div.didomi-popup-view > div.didomi-popup-notice-logo-container > img.didomi-popup-notice-logo | /upload/images/logo/logo_web_cartouche_lexpress_rouge_des... |
Icon en surimpression de la vignette pour indiquer un article video div.display__collection__thumbnail__header__img > picture > div.watermark > img.watermark_img | www.lexpress.fr/pf/resources/images/watermarks/video.png?d=827 |
More information about the performance of your application. These numbers don't directly affect the Performance score.
These checks highlight opportunities to improve the accessibility of your web app. Automatic detection can only detect a subset of issues and does not guarantee the accessibility of your web app, so manual testing is also encouraged.
Low-contrast text is difficult or impossible for many users to read. Learn how to provide sufficient color contrast.
Performance issues directly impact user engagement and conversion rates.
| Failing Elements |
|---|
our 347 partners div.didomi-popup-notice-text-container > div.didomi-popup-notice-text > p > a.didomi-notice-view-partners-link-in-text |
Disagree and create account div.didomi-popup-view > div#buttons > button#didomi-notice-disagree-button > span |
Agree and close div.didomi-popup-view > div#buttons > button#didomi-notice-agree-button > span |
PAR MARYLOU MAGAL div > article.bloc-une > span.heading-22 > span |
MARYLOU MAGAL article.bloc-une > span.heading-22 > span > span |
These are opportunities to improve the legibility of your content.
Screen reader users rely on frame titles to describe the contents of frames. Learn more about frame titles.
Performance issues directly impact user engagement and conversion rates.
| Failing Elements |
|---|
div.collection > div.card__podcast > div.card__podcast__embed > iframe div.collection > div.card__podcast > div.card__podcast__embed > iframe |
Link text (and alternate text for images, when used as links) that is discernible, unique, and focusable improves the navigation experience for screen reader users. Learn how to make links accessible.
Performance issues directly impact user engagement and conversion rates.
| Failing Elements |
|---|
div.customFooter__subheader > ul.customFooter__socials > li > a div.customFooter__subheader > ul.customFooter__socials > li > a |
These are opportunities to improve the semantics of the controls in your application. This may enhance the experience for users of assistive technology, like a screen reader.
Visible text labels that do not match the accessible name can result in a confusing experience for screen reader users. Learn more about accessible names.
Performance issues directly impact user engagement and conversion rates.
| Failing Elements |
|---|
Learn More → div.didomi-popup-container > div.didomi-popup-view > div#buttons > button#didomi-notice-learn-more-button |
Errors logged to the console indicate unresolved problems. They can come from network request failures and other browser concerns. Learn more about this errors in console diagnostic audit
Performance issues directly impact user engagement and conversion rates.
| Source | Description |
|---|---|
Not signed in with the identity provider. |
Source maps translate minified code to the original source code. This helps developers debug in production. In addition, Lighthouse is able to provide further insights. Consider deploying source maps to take advantage of these benefits. Learn more about source maps.
Performance issues directly impact user engagement and conversion rates.
These checks ensure that your page is following basic search engine optimization advice. There are many additional factors Lighthouse does not score here that may affect your search ranking, including performance on Core Web Vitals. Learn more about Google Search Essentials.
Search engines may use `href` attributes on links to crawl websites. Ensure that the `href` attribute of anchor elements links to an appropriate destination, so more pages of the site can be discovered. Learn how to make links crawlable
Performance issues directly impact user engagement and conversion rates.
| Uncrawlable Link |
|---|
Accepter les cookies div#popin-cookie-backdrop > div.qiota-bandeau-cookies__content > div.qiota-bandeau-cookies__link > a.link |
To appear in search results, crawlers need access to your app.
Industry-standard audits powered by Google Lighthouse. — Desktop
Key metrics that affect user experience. — Desktop
First Contentful Paint First Contentful Paint — how long until the browser renders the first piece of content. Under 1.8s is good.
1.23 s
Largest Contentful Paint Largest Contentful Paint — how long until the largest visible element loads. Under 2.5s is good.
1.23 s
Total Blocking Time Total Blocking Time — total time the main thread was blocked, preventing user input. Under 200ms is good.
309 ms
Cumulative Layout Shift Cumulative Layout Shift — measures visual stability. How much the page layout shifts during loading. Under 0.1 is good.
0.017
Speed Index Speed Index — how quickly content is visually displayed during load. Under 3.4s is good.
1.98 s
Time to Interactive Time to Interactive — how long until the page is fully interactive and responds to user input. Under 3.8s is good.
4.93 s
Audit breakdown by category with detailed findings.
Remove large, duplicate JavaScript modules from bundles to reduce unnecessary bytes consumed by network activity.
Performance issues directly impact user engagement and conversion rates.
Polyfills and transforms enable older browsers to use new JavaScript features. However, many aren't necessary for modern browsers. Consider modifying your JavaScript build process to not transpile Baseline features, unless you know you must support older browsers. Learn why most sites can deploy ES6+ code without transpiling
Shipping ES5 transpiled code to modern browsers wastes bytes — every user with an evergreen browser pays for compatibility you don't need.
Most users today run browsers that natively support ES6+, async/await, optional chaining, and the rest of modern JavaScript. Transpiling to ES5 'just in case' adds 20-40% to your bundle for no benefit. Configure your build to target a modern browserslist, or ship a differential bundle pair (modern + legacy) with the module/nomodule pattern.
Source: Google web.dev / Lighthouse
3rd party code can significantly impact load performance. Reduce and defer loading of 3rd party code to prioritize your page's content.
Performance issues directly impact user engagement and conversion rates.
Your first network request is the most important. Reduce its latency by avoiding redirects, ensuring a fast server response, and enabling text compression.
Performance issues directly impact user engagement and conversion rates.
A forced reflow occurs when JavaScript queries geometric properties (such as offsetWidth) after styles have been invalidated by a change to the DOM state. This can result in poor performance. Learn more about forced reflows and possible mitigations.
Performance issues directly impact user engagement and conversion rates.
Avoid chaining critical requests by reducing the length of chains, reducing the download size of resources, or deferring the download of unnecessary resources to improve page load.
Performance issues directly impact user engagement and conversion rates.
A long cache lifetime can speed up repeat visits to your page. Learn more about caching.
Performance issues directly impact user engagement and conversion rates.
Reducing the download time of images can improve the perceived load time of the page and LCP. Learn more about optimizing image size
Performance issues directly impact user engagement and conversion rates.
| URL | Resource Size | Est Savings | |
|---|---|---|---|
Vladimir Poutine, ici avec Lioudmila Otcheretnaïa, dont il a partagé la vie de … a.text--unstyled > div.basic__article__image > picture > img | /resizer/v2/OE3HE3VM2ZAQZIIYKJ3TSIVHBM.jpg?auth=bb8218ada... | 21.3 KiB | 10.9 KiB |
Logo div.didomi-popup-container > div.didomi-popup-view > div.didomi-popup-notice-logo-container > img.didomi-popup-notice-logo | /upload/images/logo/logo_web_cartouche_lexpress_rouge_des... | 7.4 KiB | 6.4 KiB |
Requests are blocking the page's initial render, which may delay LCP. Deferring or inlining can move these network requests out of the critical path.
Performance issues directly impact user engagement and conversion rates.
| URL | Transfer Size | Duration |
|---|---|---|
| www.lexpress.fr/pf/dist/components/combinations/default.css?d=827&mxId=00000000 | 81.7 KiB | 164 ms |
| www.lexpress.fr/pf/dist/components/output-types/default.css?d=827&mxId=00000000 | 1.6 KiB |
These insights are also available in the Chrome DevTools Performance Panel - record a trace to view more detailed information.
Redirects introduce additional delays before the page can be loaded. Learn how to avoid page redirects.
Performance issues directly impact user engagement and conversion rates.
| URL | Time Spent |
|---|---|
| lexpress.fr/ | 388 ms |
| www.lexpress.fr/ | 0.0 ms |
Time to Interactive is the amount of time it takes for the page to become fully interactive. Learn more about the Time to Interactive metric.
Performance issues directly impact user engagement and conversion rates.
The maximum potential First Input Delay that your users could experience is the duration of the longest task. Learn more about the Maximum Potential First Input Delay metric.
Performance issues directly impact user engagement and conversion rates.
Reduce unused rules from stylesheets and defer CSS not used for above-the-fold content to decrease bytes consumed by network activity. Learn how to reduce unused CSS.
Performance issues directly impact user engagement and conversion rates.
| URL | Transfer Size | Est Savings |
|---|---|---|
| www.lexpress.fr/pf/dist/components/combinations/default.css?d=827&mxId=00000000 | 81.4 KiB | 73.0 KiB |
| 18.0 KiB | 14.8 KiB |
Reduce unused JavaScript and defer loading scripts until they are required to decrease bytes consumed by network activity. Learn how to reduce unused JavaScript.
Multi-megabyte JavaScript bundles delay every interactive feature on the page.
This is the Lighthouse audit fired when too much JS is shipped relative to what executes. The fix isn't a config flag — it requires bundle analysis (webpack-bundle-analyzer, rollup-plugin-visualizer), splitting routes into chunks, lazy-loading off-screen components, and removing unused dependencies. Fundamentally different from minification: minifying reduces byte count, this reduces what's downloaded at all.
Source: Google web.dev / Lighthouse
| URL | Transfer Size | Est Savings |
|---|---|---|
| www.lexpress.fr/pf/dist/components/combinations/default.js?d=827&mxId=00000000 | 358.0 KiB | 239.1 KiB |
| accounts.google.com/gsi/client | 95.4 KiB | 68.3 KiB |
| www.googletagmanager.com/gtm.js?id=GTM-MK3GTGR | 138.5 KiB | 65.3 KiB |
| scripts.stay22.com/letmeallez.js | 107.4 KiB | 61.3 KiB |
| /sdk/d4911c3d5b4b9a80b40e05167f53d1b1e8da81f3/modern/sdk.... | 100.7 KiB | 44.3 KiB |
| www.lexpress.fr/pf/dist/engine/react.js?d=827&mxId=00000000 | 94.4 KiB | 30.5 KiB |
Large network payloads cost users real money and are highly correlated with long load times. Learn how to reduce payload sizes.
Performance issues directly impact user engagement and conversion rates.
Set an explicit width and height on image elements to reduce layout shifts and improve CLS. Learn how to set image dimensions
Performance issues directly impact user engagement and conversion rates.
| URL | |
|---|---|
Logo div.didomi-popup-container > div.didomi-popup-view > div.didomi-popup-notice-logo-container > img.didomi-popup-notice-logo | /upload/images/logo/logo_web_cartouche_lexpress_rouge_des... |
Icon en surimpression de la vignette pour indiquer un article video div.display__collection__thumbnail__header__img > picture > div.watermark > img.watermark_img | www.lexpress.fr/pf/resources/images/watermarks/video.png?d=827 |
More information about the performance of your application. These numbers don't directly affect the Performance score.
These checks highlight opportunities to improve the accessibility of your web app. Automatic detection can only detect a subset of issues and does not guarantee the accessibility of your web app, so manual testing is also encouraged.
When a button doesn't have an accessible name, screen readers announce it as "button", making it unusable for users who rely on screen readers. Learn how to make buttons more accessible.
Performance issues directly impact user engagement and conversion rates.
| Failing Elements |
|---|
div.dailymotion-playlist > div.dailymotion-playlist__header > div.playlist-arrows > button.arrow div.dailymotion-playlist > div.dailymotion-playlist__header > div.playlist-arrows > button.arrow |
Screen reader users rely on frame titles to describe the contents of frames. Learn more about frame titles.
Performance issues directly impact user engagement and conversion rates.
| Failing Elements |
|---|
div.collection > div.card__podcast > div.card__podcast__embed > iframe div.collection > div.card__podcast > div.card__podcast__embed > iframe |
Link text (and alternate text for images, when used as links) that is discernible, unique, and focusable improves the navigation experience for screen reader users. Learn how to make links accessible.
Performance issues directly impact user engagement and conversion rates.
| Failing Elements |
|---|
div.customFooter__subheader > ul.customFooter__socials > li > a div.customFooter__subheader > ul.customFooter__socials > li > a |
These are opportunities to improve the semantics of the controls in your application. This may enhance the experience for users of assistive technology, like a screen reader.
Low-contrast text is difficult or impossible for many users to read. Learn how to provide sufficient color contrast.
Performance issues directly impact user engagement and conversion rates.
| Failing Elements |
|---|
our 347 partners div.didomi-popup-notice-text-container > div.didomi-popup-notice-text > p > a.didomi-notice-view-partners-link-in-text |
Disagree and create account div.didomi-popup-view > div#buttons > button#didomi-notice-disagree-button > span |
Agree and close div.didomi-popup-view > div#buttons > button#didomi-notice-agree-button > span |
L'Express cette semaine ul.sub-header-list > li.sub-header-list__item > a.sub-header-list__text-wrapper > div.sub-header-list__headline |
PUBLICITÉ div.placeholder--ban-atf-wrapper > div#top-banner-f0fd4GINb4Do3Nh-placers > div.ads-placeholder > span.ads-placeholder__text |
PAR MARYLOU MAGAL div > article.bloc-une > span.heading-22 > span |
MARYLOU MAGAL article.bloc-une > span.heading-22 > span > span |
18h10 div.fill-info-card > ul.fill-info-card__content-desktop > li.fill-info-card-item > div.fill-info-card-item__time |
17h00 div.fill-info-card > ul.fill-info-card__content-desktop > li.fill-info-card-item > div.fill-info-card-item__time |
16h00 div.fill-info-card > ul.fill-info-card__content-desktop > li.fill-info-card-item > div.fill-info-card-item__time |
15h36 div.fill-info-card > ul.fill-info-card__content-desktop > li.fill-info-card-item > div.fill-info-card-item__time |
15h00 div.fill-info-card > ul.fill-info-card__content-desktop > li.fill-info-card-item > div.fill-info-card-item__time |
These are opportunities to improve the legibility of your content.
Visible text labels that do not match the accessible name can result in a confusing experience for screen reader users. Learn more about accessible names.
Performance issues directly impact user engagement and conversion rates.
| Failing Elements |
|---|
Learn More → div.didomi-popup-container > div.didomi-popup-view > div#buttons > button#didomi-notice-learn-more-button |
Errors logged to the console indicate unresolved problems. They can come from network request failures and other browser concerns. Learn more about this errors in console diagnostic audit
Performance issues directly impact user engagement and conversion rates.
| Source | Description |
|---|---|
accounts.google.com/gsi/client line 85, col 88 | [GSI_LOGGER]: FedCM get() rejects with NetworkError: Error retrieving a token. |
Not signed in with the identity provider. |
Source maps translate minified code to the original source code. This helps developers debug in production. In addition, Lighthouse is able to provide further insights. Consider deploying source maps to take advantage of these benefits. Learn more about source maps.
Performance issues directly impact user engagement and conversion rates.
These checks ensure that your page is following basic search engine optimization advice. There are many additional factors Lighthouse does not score here that may affect your search ranking, including performance on Core Web Vitals. Learn more about Google Search Essentials.
Search engines may use `href` attributes on links to crawl websites. Ensure that the `href` attribute of anchor elements links to an appropriate destination, so more pages of the site can be discovered. Learn how to make links crawlable
Performance issues directly impact user engagement and conversion rates.
| Uncrawlable Link |
|---|
Accepter les cookies div#popin-cookie-backdrop > div.qiota-bandeau-cookies__content > div.qiota-bandeau-cookies__link > a.link |
To appear in search results, crawlers need access to your app.
Send Feedback