Spain · Madrid Completed: Apr 7, 2026 20:28 UTC
Mobile 375 × 812
Desktop 1440 × 900
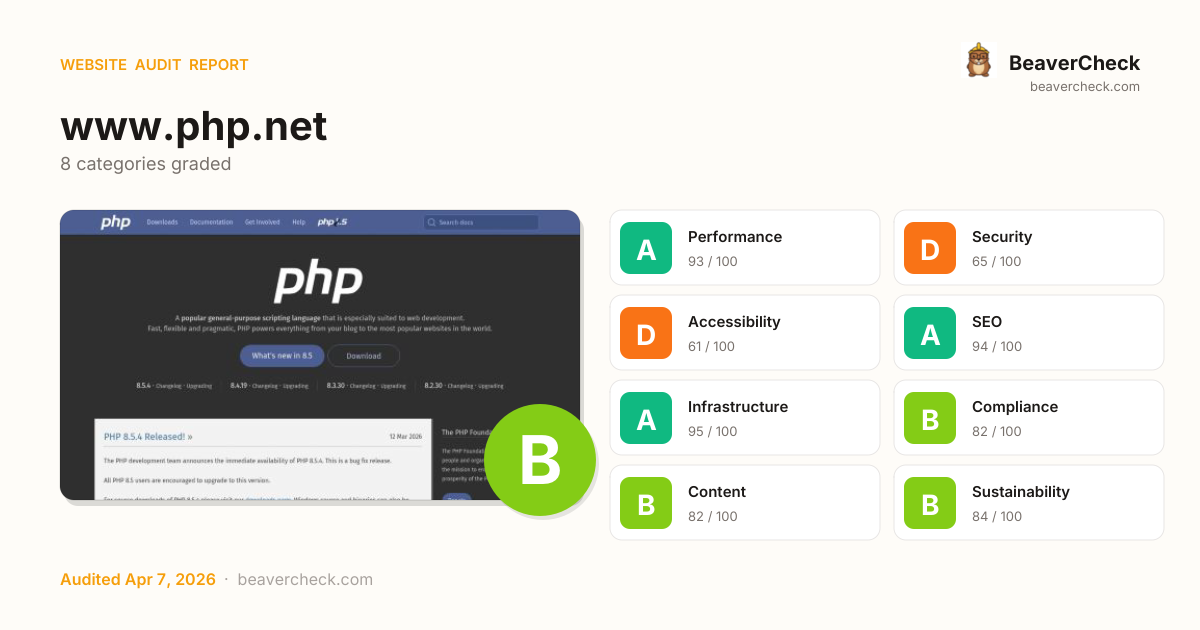
Score: 80 / 100
Based on 8 categories, 0 sections
The overall score is a weighted average of individual category scores. Categories with more impact on user experience and security carry more weight.
Weights reflect general web best practices. Individual needs may differ.
Content-Security-Policy header is missing
HSTS header is missing
No Content-Security-Policy header found
1 button(s) with no accessible text
1 image-only link(s) without alt text
[](https://beavercheck.com/results/8caf44a0-5db5-1873-1bc4-43b6f41d3ef9)<a href="https://beavercheck.com/results/8caf44a0-5db5-1873-1bc4-43b6f41d3ef9"><img src="https://beavercheck.com/badge?url=https%3A%2F%2Fwww.php.net" alt="BeaverCheck Score"></a>https://beavercheck.com/badge?url=https%3A%2F%2Fwww.php.netThis badge auto-updates with your latest scan result.
Thanks for your feedback!
Industry-standard audits powered by Google Lighthouse.
Key metrics that affect user experience.
First Contentful Paint First Contentful Paint — how long until the browser renders the first piece of content. Under 1.8s is good.
931 ms
Largest Contentful Paint Largest Contentful Paint — how long until the largest visible element loads. Under 2.5s is good.
1.15 s
Total Blocking Time Total Blocking Time — total time the main thread was blocked, preventing user input. Under 200ms is good.
198 ms
Cumulative Layout Shift Cumulative Layout Shift — measures visual stability. How much the page layout shifts during loading. Under 0.1 is good.
0.118
Speed Index Speed Index — how quickly content is visually displayed during load. Under 3.4s is good.
1.12 s
Time to Interactive Time to Interactive — how long until the page is fully interactive and responds to user input. Under 3.8s is good.
2.73 s
Audit breakdown by category with detailed findings.
Remove large, duplicate JavaScript modules from bundles to reduce unnecessary bytes consumed by network activity.
Polyfills and transforms enable older browsers to use new JavaScript features. However, many aren't necessary for modern browsers. Consider modifying your JavaScript build process to not transpile Baseline features, unless you know you must support older browsers. Learn why most sites can deploy ES6+ code without transpiling
3rd party code can significantly impact load performance. Reduce and defer loading of 3rd party code to prioritize your page's content.
Layout shifts occur when elements move absent any user interaction. Investigate the causes of layout shifts, such as elements being added, removed, or their fonts changing as the page loads.
Consider setting font-display to swap or optional to ensure text is consistently visible. swap can be further optimized to mitigate layout shifts with font metric overrides.
| URL | Est Savings |
|---|---|
| www.php.net/fonts/Font-Awesome/font/fontello.woff2?96103027 | 70 ms |
Avoid chaining critical requests by reducing the length of chains, reducing the download size of resources, or deferring the download of unnecessary resources to improve page load.
Requests are blocking the page's initial render, which may delay LCP. Deferring or inlining can move these network requests out of the critical path.
A long cache lifetime can speed up repeat visits to your page. Learn more about caching.
| Request | Cache TTL | Transfer Size |
|---|---|---|
| www.php.net/fonts/Fira/woff2/FiraSans-BookItalic.woff2 | 86400.0 s | 136.0 KiB |
| www.php.net/fonts/Fira/woff2/FiraSans-Medium.woff2 | 86400.0 s | 130.0 KiB |
| www.php.net/fonts/Fira/woff2/FiraSans-Book.woff2 | 86400.0 s | 129.0 KiB |
| www.php.net/fonts/Font-Awesome/font/fontello.woff2?96103027 | 86400.0 s | 3.1 KiB |
| www.php.net/images/php8/logo_php8_5.svg | 86400.0 s | 1.7 KiB |
| www.php.net/images/to-top@2x.png | 86400.0 s | 1.2 KiB |
| www.php.net/images/logos/php-logo-white.svg | 86400.0 s | 752 B |
| www.php.net/images/bg-texture-00.svg | 86400.0 s | 363 B |
These insights are also available in the Chrome DevTools Performance Panel - record a trace to view more detailed information.
These are the largest layout shifts observed on the page. Each table item represents a single layout shift, and shows the element that shifted the most. Below each item are possible root causes that led to the layout shift. Some of these layout shifts may not be included in the CLS metric value due to windowing. Learn how to improve CLS
| Element | Layout shift score |
|---|---|
8.5.4 · Changelog · Upgrading
8.4.19 · Changelog · Upgrading
8.3.30 · Changelog… div#intro > div.container > div.hero > ul.hero__versions | 0.064 |
8.5.4 · Changelog · Upgrading
8.4.19 · Changelog · Upgrading
8.3.30 · Changelog… div#intro > div.container > div.hero > ul.hero__versions | 0.055 |
The maximum potential First Input Delay that your users could experience is the duration of the longest task. Learn more about the Maximum Potential First Input Delay metric.
Minifying JavaScript files can reduce payload sizes and script parse time. Learn how to minify JavaScript.
| URL | Transfer Size | Est Savings |
|---|---|---|
| www.php.net/cached.php?t=1768309801&f=/js/common.js | 7.5 KiB | 2.8 KiB |
Reduce unused JavaScript and defer loading scripts until they are required to decrease bytes consumed by network activity. Learn how to reduce unused JavaScript.
| URL | Transfer Size | Est Savings |
|---|---|---|
| www.php.net/js/php-web.mjs | 31.5 KiB | 31.5 KiB |
Set an explicit width and height on image elements to reduce layout shifts and improve CLS. Learn how to set image dimensions
| URL | |
|---|---|
PHP 8.5 ul.navbar__nav > li.navbar__item > a.navbar__link > img | www.php.net/images/php8/logo_php8_5.svg |
More information about the performance of your application. These numbers don't directly affect the Performance score.
These checks highlight opportunities to improve the accessibility of your web app. Automatic detection can only detect a subset of issues and does not guarantee the accessibility of your web app, so manual testing is also encouraged.
One main landmark helps screen reader users navigate a web page. Learn more about landmarks.
| Failing Elements |
|---|
html html |
These items highlight common accessibility best practices.
These checks ensure that your page is following basic search engine optimization advice. There are many additional factors Lighthouse does not score here that may affect your search ranking, including performance on Core Web Vitals. Learn more about Google Search Essentials.
Industry-standard audits powered by Google Lighthouse. — Desktop
Key metrics that affect user experience. — Desktop
First Contentful Paint First Contentful Paint — how long until the browser renders the first piece of content. Under 1.8s is good.
317 ms
Largest Contentful Paint Largest Contentful Paint — how long until the largest visible element loads. Under 2.5s is good.
580 ms
Total Blocking Time Total Blocking Time — total time the main thread was blocked, preventing user input. Under 200ms is good.
0 ms
Cumulative Layout Shift Cumulative Layout Shift — measures visual stability. How much the page layout shifts during loading. Under 0.1 is good.
0.187
Speed Index Speed Index — how quickly content is visually displayed during load. Under 3.4s is good.
317 ms
Time to Interactive Time to Interactive — how long until the page is fully interactive and responds to user input. Under 3.8s is good.
580 ms
Audit breakdown by category with detailed findings.
Remove large, duplicate JavaScript modules from bundles to reduce unnecessary bytes consumed by network activity.
Polyfills and transforms enable older browsers to use new JavaScript features. However, many aren't necessary for modern browsers. Consider modifying your JavaScript build process to not transpile Baseline features, unless you know you must support older browsers. Learn why most sites can deploy ES6+ code without transpiling
3rd party code can significantly impact load performance. Reduce and defer loading of 3rd party code to prioritize your page's content.
Layout shifts occur when elements move absent any user interaction. Investigate the causes of layout shifts, such as elements being added, removed, or their fonts changing as the page loads.
Consider setting font-display to swap or optional to ensure text is consistently visible. swap can be further optimized to mitigate layout shifts with font metric overrides.
| URL | Est Savings |
|---|---|
| www.php.net/fonts/Font-Awesome/font/fontello.woff2?96103027 | 75 ms |
Avoid chaining critical requests by reducing the length of chains, reducing the download size of resources, or deferring the download of unnecessary resources to improve page load.
Requests are blocking the page's initial render, which may delay LCP. Deferring or inlining can move these network requests out of the critical path.
A long cache lifetime can speed up repeat visits to your page. Learn more about caching.
| Request | Cache TTL | Transfer Size |
|---|---|---|
| www.php.net/fonts/Fira/woff2/FiraSans-BookItalic.woff2 | 86400.0 s | 136.0 KiB |
| www.php.net/fonts/Fira/woff2/FiraSans-Medium.woff2 | 86400.0 s | 130.0 KiB |
| www.php.net/fonts/Fira/woff2/FiraSans-Book.woff2 | 86400.0 s | 129.0 KiB |
| www.php.net/fonts/Font-Awesome/font/fontello.woff2?96103027 | 86400.0 s | 3.1 KiB |
| www.php.net/images/php8/logo_php8_5.svg | 86400.0 s | 1.7 KiB |
| www.php.net/images/to-top@2x.png | 86400.0 s | 1.2 KiB |
| www.php.net/images/logos/php-logo-white.svg | 86400.0 s | 752 B |
| www.php.net/images/bg-texture-00.svg | 86400.0 s | 363 B |
These insights are also available in the Chrome DevTools Performance Panel - record a trace to view more detailed information.
Minifying JavaScript files can reduce payload sizes and script parse time. Learn how to minify JavaScript.
| URL | Transfer Size | Est Savings |
|---|---|---|
| www.php.net/cached.php?t=1768309801&f=/js/common.js | 7.5 KiB | 2.8 KiB |
Reduce unused JavaScript and defer loading scripts until they are required to decrease bytes consumed by network activity. Learn how to reduce unused JavaScript.
| URL | Transfer Size | Est Savings |
|---|---|---|
| www.php.net/js/php-web.mjs | 31.5 KiB | 31.5 KiB |
Set an explicit width and height on image elements to reduce layout shifts and improve CLS. Learn how to set image dimensions
| URL | |
|---|---|
PHP 8.5 ul.navbar__nav > li.navbar__item > a.navbar__link > img | www.php.net/images/php8/logo_php8_5.svg |
More information about the performance of your application. These numbers don't directly affect the Performance score.
These are the largest layout shifts observed on the page. Each table item represents a single layout shift, and shows the element that shifted the most. Below each item are possible root causes that led to the layout shift. Some of these layout shifts may not be included in the CLS metric value due to windowing. Learn how to improve CLS
| Element | Layout shift score |
|---|---|
12 Mar 2026
PHP 8.5.4 Released!
The PHP development team announces the immedia… body.home > div#layout | 0.186 |
popular general-purpose scripting language div.container > div.hero > p.hero__text > strong | 0.001 |
These checks highlight opportunities to improve the accessibility of your web app. Automatic detection can only detect a subset of issues and does not guarantee the accessibility of your web app, so manual testing is also encouraged.
Link text (and alternate text for images, when used as links) that is discernible, unique, and focusable improves the navigation experience for screen reader users. Learn how to make links accessible.
| Failing Elements |
|---|
body.home > div.elephpants > div.images > a body.home > div.elephpants > div.images > a |
body.home > div.elephpants > div.images > a body.home > div.elephpants > div.images > a |
These are opportunities to improve the semantics of the controls in your application. This may enhance the experience for users of assistive technology, like a screen reader.
One main landmark helps screen reader users navigate a web page. Learn more about landmarks.
| Failing Elements |
|---|
html html |
These items highlight common accessibility best practices.
These checks ensure that your page is following basic search engine optimization advice. There are many additional factors Lighthouse does not score here that may affect your search ranking, including performance on Core Web Vitals. Learn more about Google Search Essentials.
Send Feedback