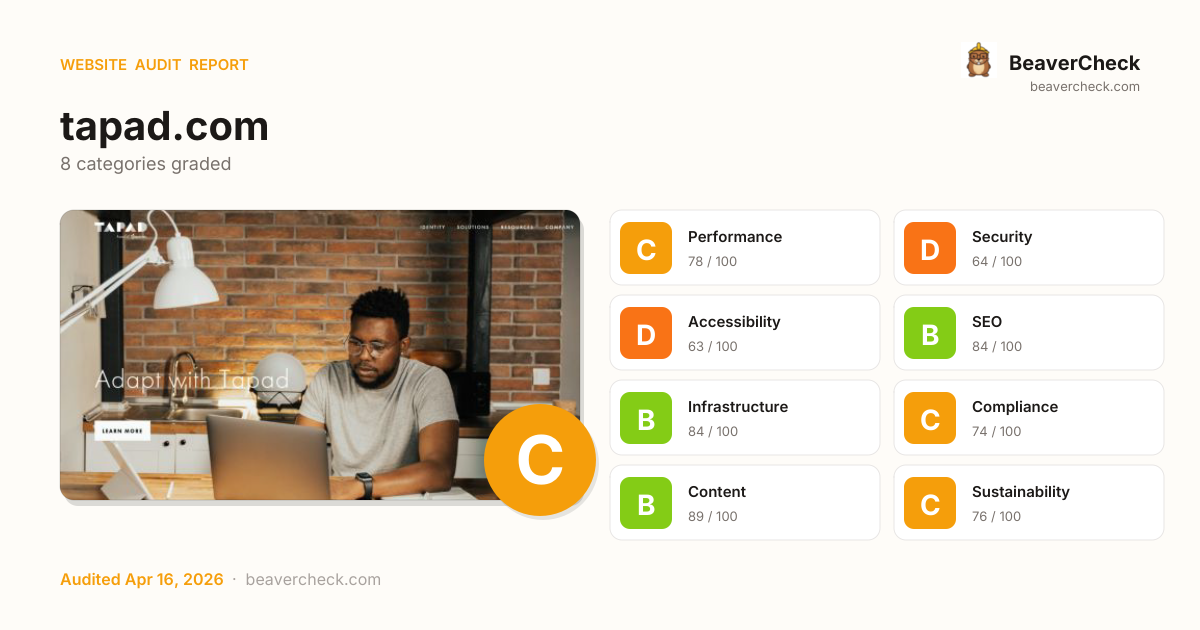
Skip to content
Audit Complete

Results for https://tapad.com

Visit site
Netherlands Netherlands · Amsterdam Completed: Apr 16, 2026 17:59 UTC
Download JSON Download Markdown Report

Mobile 375 × 812

Screenshot of the audited page (Mobile 375×812)

Desktop 1440 × 900

Screenshot of the audited page (Desktop 1440×900)
C74

Site Health

Score: 74 / 100

Based on 8 categories, 0 sections

Decent speed, but optimizing further could improve engagement.

Several missing protections leave your users and data exposed.

Several issues make your site difficult for assistive technology users.

Solid SEO basics — a few optimizations could boost rankings.

Good server performance with room for optimization.

Mostly compliant — a few items need attention.

Rich content metadata — your pages look great everywhere.

Reasonable footprint with room for optimization.

How is this calculated?

The overall score is a weighted average of individual category scores. Categories with more impact on user experience and security carry more weight.

Performance 25%Security 25%Accessibility 15%SEO 10%Infrastructure 10%Compliance 8%Content 5%Sustainability 2%

Weights reflect general web best practices. Individual needs may differ.

How the composite score is calculated

How you compare

CMS sites average 73
At average
Better than 44% of CMS sites
Adobe Fonts sites average 73
At average
Better than 60% of Adobe Fonts sites See full Adobe Fonts benchmark →

Top Priorities (5)

1

Content-Security-Policy header is missing

Security gaps expose your site and users to attacks, eroding trust.

Security › Security Headers
2

HSTS header is missing

Security gaps expose your site and users to attacks, eroding trust.

Security › Security Headers
3

No Content-Security-Policy header found

Security gaps expose your site and users to attacks, eroding trust.

Security › Content Security Policy
4

4 link(s) with no accessible text

Accessibility issues exclude users with disabilities — up to 15% of your potential audience.

Accessibility › Link & Button Quality
5

6 button(s) with no accessible text

Accessibility issues exclude users with disabilities — up to 15% of your potential audience.

Accessibility › Link & Button Quality
View fix priority matrix

Fix Priority Matrix

5 findings

Quick Wins

3

High impact, low effort — start here.

Strategic

2

High impact, requires investment.

Easy Improvements

0

Small gains, minimal effort.

Nothing in this quadrant — good news.

Deprioritize

0

Low impact, high effort — do last.

Nothing in this quadrant — good news.

← Low effort High effort →
BeaverCheck badge
Embed this badge
[![BeaverCheck](https://beavercheck.com/badge?url=https%3A%2F%2Ftapad.com)](https://beavercheck.com/results/8d3adf51-3e93-45f8-a5cf-febbecd4bdb1)
<a href="https://beavercheck.com/results/8d3adf51-3e93-45f8-a5cf-febbecd4bdb1"><img src="https://beavercheck.com/badge?url=https%3A%2F%2Ftapad.com" alt="BeaverCheck Score"></a>
https://beavercheck.com/badge?url=https%3A%2F%2Ftapad.com

This badge auto-updates with your latest scan result.

What fixing these means

Your site performs reasonably well, but a few targeted fixes could meaningfully improve results. Addressing the critical issues below would have the most immediate impact on your user trust.

3 security gaps detected — browsers may warn visitors about your site.
2 accessibility issues exclude users who rely on assistive technology.

Conversion Barriers

2 critical 5 warning

7 barrier(s) likely increasing bounce by ~27%.

Speed (2)

Page takes 20.7s to load

+12% bounce

Users abandon at ~3s — you're 18.2s over the 2.5s threshold

Fix: Optimize render-blocking resources, preload the hero image, and compress images

High main-thread blocking time

+2% bounce

Page is non-interactive for 278ms after first paint

Fix: Defer third-party scripts and split large bundles

Trust (2)

No HSTS header

+1% bounce

Returning visitors are briefly exposed to downgrade attacks on first request

Fix: Set Strict-Transport-Security: max-age=31536000; includeSubDomains

No Content-Security-Policy header

+1% bounce

Higher XSS blast radius — one compromised script can exfiltrate the checkout form

Fix: Ship a reporting-only CSP first, then enforce once violations are clean

Navigation (3)

5 link(s) with generic text ("click here", "read more")

+1% bounce

Screen-reader users navigating by link list see no context — and search engines can't infer relevance

Fix: Rewrite with descriptive phrases that identify the destination

No skip-to-content link

+1% bounce

Keyboard and screen-reader users must tab through the entire header on every page

Fix: Add a visible-on-focus <a href="#main">Skip to content</a> as the first focusable element

9 broken link(s) on the page

+5% bounce

Clicks land on 404s — trust drops and the session often ends

Fix: Fix or remove the broken destinations surfaced on the Content tab

Preliminary CRO audit — each barrier links to the tab with detailed analysis.

Return on Investment

€383 investment → €0.79/month returns + EUR 500,000 risk avoided

Payback period: > 2 years First-year ROI: -98%

Investment

€383

4h · 5 findings

Monthly returns

€0.79 /mo

~€9.51 / year

  • Bandwidth savings €0.79

Regulatory risk avoided

EUR 500,000

if kept compliant

  • EAA EUR 500,000

€128 — in quick wins — start here for the fastest payback

Figures combine localized regulatory fine ceilings, search/conversion value priced against local CPC, and bandwidth waste estimates. Results depend on implementation quality and audience composition. Not legal or financial advice.

Full methodology & sources

Estimated Remediation Cost

€383

4.5 developer hours at €85/hr

Based on European Union rates (€85/hr)

Quick wins
€128 3 fixes in ~90 minutes

Start here for the best return on investment

Cost by category

Cost by effort level

Adjust assumptions
/hr

Rates reflect fully-loaded developer cost including overhead

How developer rates are sourced

What Inaction Is Costing You

€41,667 / month at risk

~€500,010 / year if left unfixed

Compliance Risk

€500,000

EAA
  • 5 of 5 <nav> elements are unlabeled
    EAA: EUR 1,000 – EUR 500,000
  • Skip navigation link is missing (WCAG 2.4.1)
    EAA: EUR 1,000 – EUR 500,000
  • Heading level skipped: H1 → H3 (missing H2)
    EAA: EUR 1,000 – EUR 500,000

+2 more

Bandwidth Waste

€0.79 /mo

10700.8 MB/mo × 0.074 EUR/GB

  • Optimize transfer: save ~1.1 MB per page load
    Saves €0.79/mo

Compliance figures represent the statutory maximum fine for the most severe triggered category, capped per regulation — not the sum of per-finding penalties. Based on published regulatory fine ranges. This is not legal advice.

Compliance methodology · SEO assumptions · Bandwidth model

Your performance is already good — improvements may show diminishing returns

Unique monthly visitors from your analytics

Purchases, signups, or key actions

Optional — for revenue estimation

additional conversions/month

more engaged visitors from reduced bounce

potential monthly revenue
Current bounce (est.)
After fixes (est.)
Estimated bounce reduction

Fix 5 critical issues to capture this value

How this is calculated

Based on Google/Deloitte research ("Milliseconds Make Millions") showing a ~7% bounce rate increase per additional second of LCP above the 2.5s "Good" threshold.

Your site's LCP: → estimated after fixes.

These are estimates based on industry research — actual results vary

Bounce-rate model & assumptions

Your data stays in your browser — nothing is sent to our servers

Was this report useful?

Thanks for your feedback!

We'll use a cached audit if available, or offer to scan.

Checking for existing audit...

Lighthouse Scores

Industry-standard audits powered by Google Lighthouse.

51
Performance Overall performance score (0–100) based on Core Web Vitals and other metrics. 90+ is good.
78
Accessibility Measures how accessible the page is for users with disabilities. Checks color contrast, ARIA labels, and semantic HTML.
96
Best Practices Checks for modern web development best practices including HTTPS, no console errors, and secure JavaScript.
92
SEO Measures basic SEO optimizations: meta tags, crawlability, link text, and mobile friendliness.

Core Web Vitals

Key metrics that affect user experience.

First Contentful Paint First Contentful Paint — how long until the browser renders the first piece of content. Under 1.8s is good.

9.16 s

Largest Contentful Paint Largest Contentful Paint — how long until the largest visible element loads. Under 2.5s is good.

20.74 s

Total Blocking Time Total Blocking Time — total time the main thread was blocked, preventing user input. Under 200ms is good.

278 ms

Cumulative Layout Shift Cumulative Layout Shift — measures visual stability. How much the page layout shifts during loading. Under 0.1 is good.

0.000

Speed Index Speed Index — how quickly content is visually displayed during load. Under 3.4s is good.

9.16 s

Time to Interactive Time to Interactive — how long until the page is fully interactive and responds to user input. Under 3.8s is good.

20.75 s

Detailed Report

Audit breakdown by category with detailed findings.

51

Performance

Insights

Remove large, duplicate JavaScript modules from bundles to reduce unnecessary bytes consumed by network activity.

Why this matters

Performance issues directly impact user engagement and conversion rates.

Polyfills and transforms enable older browsers to use new JavaScript features. However, many aren't necessary for modern browsers. Consider modifying your JavaScript build process to not transpile Baseline features, unless you know you must support older browsers. Learn why most sites can deploy ES6+ code without transpiling

Why this matters

Shipping ES5 transpiled code to modern browsers wastes bytes — every user with an evergreen browser pays for compatibility you don't need.

Learn more

Most users today run browsers that natively support ES6+, async/await, optional chaining, and the rest of modern JavaScript. Transpiling to ES5 'just in case' adds 20-40% to your bundle for no benefit. Configure your build to target a modern browserslist, or ship a differential bundle pair (modern + legacy) with the module/nomodule pattern.

Source: Google web.dev / Lighthouse

3rd party code can significantly impact load performance. Reduce and defer loading of 3rd party code to prioritize your page's content.

Why this matters

Performance issues directly impact user engagement and conversion rates.

A forced reflow occurs when JavaScript queries geometric properties (such as offsetWidth) after styles have been invalidated by a change to the DOM state. This can result in poor performance. Learn more about forced reflows and possible mitigations.

Why this matters

Performance issues directly impact user engagement and conversion rates.

headings: [map[key:source label:Source valueType:source-location] map[granularity:1 key:reflowTime label:Total reflow time valueType:ms]]
items: [map[reflowTime:53.289 source:map[column:28 line:659 type:source-location url:https://platform-api.sharethis.com/js/sharethis.js urlProvider:network]]]

Reducing the download time of images can improve the perceived load time of the page and LCP. Learn more about optimizing image size

Why this matters

Performance issues directly impact user engagement and conversion rates.

URLResource SizeEst Savings
Adapt with Tapad LEARN MORE body.homepage > main.content > div.home-components > div.hero-home
tapad.com/assets/images/former-cloudfront/hero3_homepage.webp1.8 MiB1.4 MiB

Optimize LCP by making the LCP image discoverable from the HTML immediately, and avoiding lazy-loading

Why this matters

Performance issues directly impact user engagement and conversion rates.

lhId: page-0-DIV
nodeLabel: Adapt with Tapad LEARN MORE
path: 1,HTML,1,BODY,2,MAIN,0,DIV,0,DIV
selector: body.homepage > main.content > div.home-components > div.hero-home
snippet: <div class="hero-home hero-home-image" style="background-image: url(&quot;https://tapad.com/assets/images/former-cloudfront/he…&quot;);">

Avoid chaining critical requests by reducing the length of chains, reducing the download size of resources, or deferring the download of unnecessary resources to improve page load.

Why this matters

Performance issues directly impact user engagement and conversion rates.

description: [preconnect](https://developer.chrome.com/docs/lighthouse/performance/uses-rel-preconnect/) hints help the browser establish a connection earlier in the page load, saving time when the first request for that origin is made. The following are the origins that the page preconnected to.
title: Preconnected origins
value: no origins were preconnected
description: Add [preconnect](https://developer.chrome.com/docs/lighthouse/performance/uses-rel-preconnect/) hints to your most important origins, but try to use no more than 4.
title: Preconnect candidates

Requests are blocking the page's initial render, which may delay LCP. Deferring or inlining can move these network requests out of the critical path.

Why this matters

Performance issues directly impact user engagement and conversion rates.

Your first network request is the most important. Reduce its latency by avoiding redirects, ensuring a fast server response, and enabling text compression.

Why this matters

Performance issues directly impact user engagement and conversion rates.

Consider setting font-display to swap or optional to ensure text is consistently visible. swap can be further optimized to mitigate layout shifts with font metric overrides.

Why this matters

Performance issues directly impact user engagement and conversion rates.

These insights are also available in the Chrome DevTools Performance Panel - record a trace to view more detailed information.

Time to Interactive is the amount of time it takes for the page to become fully interactive. Learn more about the Time to Interactive metric.

Why this matters

Performance issues directly impact user engagement and conversion rates.

TTI

The maximum potential First Input Delay that your users could experience is the duration of the longest task. Learn more about the Maximum Potential First Input Delay metric.

Why this matters

Performance issues directly impact user engagement and conversion rates.

Diagnostics

Minifying CSS files can reduce network payload sizes. Learn how to minify CSS.

Why this matters

Performance issues directly impact user engagement and conversion rates.

Estimated savings: 150 ms 29.3 KiB
URLTransfer SizeEst Savings
tapad.com/css/main.css?v=1690473096301.1 KiB29.3 KiB

Minifying JavaScript files can reduce payload sizes and script parse time. Learn how to minify JavaScript.

Why this matters

Performance issues directly impact user engagement and conversion rates.

Estimated savings: 900 ms 167.9 KiB

Reduce unused rules from stylesheets and defer CSS not used for above-the-fold content to decrease bytes consumed by network activity. Learn how to reduce unused CSS.

Why this matters

Performance issues directly impact user engagement and conversion rates.

Estimated savings: 1.5 s 284.6 KiB
URLTransfer SizeEst Savings
tapad.com/css/main.css?v=1690473096300.3 KiB284.6 KiB

Reduce unused JavaScript and defer loading scripts until they are required to decrease bytes consumed by network activity. Learn how to reduce unused JavaScript.

Why this matters

Multi-megabyte JavaScript bundles delay every interactive feature on the page.

Learn more

This is the Lighthouse audit fired when too much JS is shipped relative to what executes. The fix isn't a config flag — it requires bundle analysis (webpack-bundle-analyzer, rollup-plugin-visualizer), splitting routes into chunks, lazy-loading off-screen components, and removing unused dependencies. Fundamentally different from minification: minifying reduces byte count, this reduces what's downloaded at all.

Source: Google web.dev / Lighthouse

Estimated savings: 1.2 s 229.4 KiB
URLTransfer SizeEst Savings
tapad.com/js/bundle.js?v=1690473096311.6 KiB202.3 KiB
platform-api.sharethis.com/js/sharethis.js46.3 KiB27.1 KiB

Consider reducing the time spent parsing, compiling and executing JS. You may find delivering smaller JS payloads helps with this. Learn how to minimize main-thread work

Why this matters

Performance issues directly impact user engagement and conversion rates.

CategoryTime Spent
Script Evaluation688 ms
Other568 ms
Style & Layout349 ms
Script Parsing & Compilation338 ms
Parse HTML & CSS86 ms
Rendering28 ms
Garbage Collection13 ms

Set an explicit width and height on image elements to reduce layout shifts and improve CLS. Learn how to set image dimensions

Why this matters

Performance issues directly impact user engagement and conversion rates.

URL
TAPAD LOGO div.row > div.footer-logo > a > img
tapad.com/assets/images/singles/logos/TapadExpStacked_purple.svg
Consumerbehavior Mobile div.row > div.col-12 > div.content-slider-img > img.img-fluid
Artboard 1 Copy 11 div.row > div.col-12 > div.content-slider-img > img.img-fluid
Didyouknow Mobile div.col-12 > a > div.content-slider-img > img.img-fluid
Consumerbehavior Mobile div.row > div.col-12 > div.content-slider-img > img.img-fluid
Artboard 1 Copy 11 div.row > div.col-12 > div.content-slider-img > img.img-fluid
Didyouknow Mobile div.col-12 > a > div.content-slider-img > img.img-fluid
Consumerbehavior Mobile div.row > div.col-12 > div.content-slider-img > img.img-fluid
Icon div.col-12 > div.element > div.four-up-icon-box > img.img-fluid
Openx Logo div.our-partners > div.row > div.col > img.lazyload
Amobee div.our-partners > div.row > div.col > img.lazyload
Beeswaxlogo Converted div.our-partners > div.row > div.col > img.lazyload
Arm div.our-partners > div.row > div.col > img.lazyload
Partner Logo Ttd div.our-partners > div.row > div.col > img.lazyload
Adswizz div.our-partners > div.row > div.col > img.lazyload
Twine Data Logo div.our-partners > div.row > div.col > img.lazyload
Charcoal Grey Basis Technologies Logo div.our-partners > div.row > div.col > img.lazyload
Freckle Logo div.our-partners > div.row > div.col > img.lazyload
Flashtalking Logo div.our-partners > div.row > div.col > img.lazyload
Resonate New Logo White div.our-partners > div.row > div.col > img.lazyload
Sizmek div.our-partners > div.row > div.col > img.lazyload
EDAA Certification div.footer-icons > div.footer-image-icons > a > img.edaa-logo
Made in NY div.row > div.footer-icons > div.footer-image-icons > img.made-in-ny-icon

More information about the performance of your application. These numbers don't directly affect the Performance score.

Layout shift culprits
Optimize DOM size
LCP breakdown
Modern HTTP
Optimize viewport for mobile
JavaScript execution time 1.0 s
Avoid long main-thread tasks 8 long tasks found
Page didn't prevent back/forward cache restoration
Network Requests
Network Round Trip Times 10 ms
Server Backend Latencies 300 ms
Tasks
Diagnostics
Metrics
Screenshot Thumbnails
Final Screenshot
Script Treemap Data
Resources Summary
Avoid multiple page redirects
Initial server response time was short Root document took 120 ms
INP breakdown
User Timing marks and measures
Avoid non-composited animations
Avoid large layout shifts
78

Accessibility

These checks highlight opportunities to improve the accessibility of your web app. Automatic detection can only detect a subset of issues and does not guarantee the accessibility of your web app, so manual testing is also encouraged.

Names and labels

When a button doesn't have an accessible name, screen readers announce it as "button", making it unusable for users who rely on screen readers. Learn how to make buttons more accessible.

Why this matters

Performance issues directly impact user engagement and conversion rates.

Failing Elements
nav#nav-primary > div#mobile-nav > div#mobile-nav-toggle > button.hamburger-button nav#nav-primary > div#mobile-nav > div#mobile-nav-toggle > button.hamburger-button
div.content-slider-wrapper > div.content-slider > div.owl-nav > button.owl-prev div.content-slider-wrapper > div.content-slider > div.owl-nav > button.owl-prev
div.content-slider-wrapper > div.content-slider > div.owl-nav > button.owl-next div.content-slider-wrapper > div.content-slider > div.owl-nav > button.owl-next
div.content-slider-wrapper > div.content-slider > div.owl-dots > button.owl-dot div.content-slider-wrapper > div.content-slider > div.owl-dots > button.owl-dot

Link text (and alternate text for images, when used as links) that is discernible, unique, and focusable improves the navigation experience for screen reader users. Learn how to make links accessible.

Why this matters

Performance issues directly impact user engagement and conversion rates.

Failing Elements
div.owl-item > div.container1 > div.row > a div.owl-item > div.container1 > div.row > a
div.row > div.footer-icons > div.social-icons > a div.row > div.footer-icons > div.social-icons > a

These are opportunities to improve the semantics of the controls in your application. This may enhance the experience for users of assistive technology, like a screen reader.

Navigation

Properly ordered headings that do not skip levels convey the semantic structure of the page, making it easier to navigate and understand when using assistive technologies. Learn more about heading order.

Why this matters

Performance issues directly impact user engagement and conversion rates.

Failing Elements
WE PROVIDE THE WORLD’S LEADING DIGITAL CROSS-DEVICE GRAPH div.container > div.d-flex > div.home-intro-paragraph-inner > h3

These are opportunities to improve keyboard navigation in your application.

Internationalization and localization

If a page doesn't specify a `lang` attribute, a screen reader assumes that the page is in the default language that the user chose when setting up the screen reader. If the page isn't actually in the default language, then the screen reader might not announce the page's text correctly. Learn more about the `lang` attribute.

Why this matters

Performance issues directly impact user engagement and conversion rates.

Failing Elements
html.fontawesome-i2svg-active html.fontawesome-i2svg-active

These are opportunities to improve the interpretation of your content by users in different locales.

Interactive controls are keyboard focusable
Interactive elements indicate their purpose and state
The page has a logical tab order
Visual order on the page follows DOM order
User focus is not accidentally trapped in a region
The user's focus is directed to new content added to the page
HTML5 landmark elements are used to improve navigation
Offscreen content is hidden from assistive technology
Custom controls have associated labels
Custom controls have ARIA roles
`[aria-hidden="true"]` is not present on the document `<body>`
`[role]`s have all required `[aria-*]` attributes
`[role]` values are valid
Image elements have `[alt]` attributes
`[user-scalable="no"]` is not used in the `<meta name="viewport">` element and the `[maximum-scale]` attribute is not less than 5.
`[aria-hidden="true"]` elements do not contain focusable descendents
Background and foreground colors have a sufficient contrast ratio
Document has a `<title>` element
Lists contain only `<li>` elements and script supporting elements (`<script>` and `<template>`).
List items (`<li>`) are contained within `<ul>`, `<ol>` or `<menu>` parent elements
Touch targets have sufficient size and spacing.
Document has a main landmark.
Deprecated ARIA roles were not used
All heading elements contain content.
Uses ARIA roles only on compatible elements
`[accesskey]` values are unique
`[aria-*]` attributes match their roles
`button`, `link`, and `menuitem` elements have accessible names
ARIA attributes are used as specified for the element's role
Elements with `role="dialog"` or `role="alertdialog"` have accessible names.
ARIA input fields have accessible names
ARIA `meter` elements have accessible names
ARIA `progressbar` elements have accessible names
Elements use only permitted ARIA attributes
Elements with an ARIA `[role]` that require children to contain a specific `[role]` have all required children.
`[role]`s are contained by their required parent element
Elements with the `role=text` attribute do not have focusable descendents.
ARIA toggle fields have accessible names
ARIA `tooltip` elements have accessible names
ARIA `treeitem` elements have accessible names
`[aria-*]` attributes have valid values
`[aria-*]` attributes are valid and not misspelled
The page contains a heading, skip link, or landmark region
`<dl>`'s contain only properly-ordered `<dt>` and `<dd>` groups, `<script>`, `<template>` or `<div>` elements.
Definition list items are wrapped in `<dl>` elements
ARIA IDs are unique
No form fields have multiple labels
`<frame>` or `<iframe>` elements have a title
`<html>` element has a valid value for its `[lang]` attribute
`<html>` element has an `[xml:lang]` attribute with the same base language as the `[lang]` attribute.
Input buttons have discernible text.
`<input type="image">` elements have `[alt]` text
Form elements have associated labels
Links are distinguishable without relying on color.
The document does not use `<meta http-equiv="refresh">`
`<object>` elements have alternate text
Select elements have associated label elements.
Skip links are focusable.
No element has a `[tabindex]` value greater than 0
Cells in a `<table>` element that use the `[headers]` attribute refer to table cells within the same table.
`<th>` elements and elements with `[role="columnheader"/"rowheader"]` have data cells they describe.
`[lang]` attributes have a valid value
`<video>` elements contain a `<track>` element with `[kind="captions"]`
Tables have different content in the summary attribute and `<caption>`.
Image elements do not have `[alt]` attributes that are redundant text.
Identical links have the same purpose.
Elements with visible text labels have matching accessible names.
Tables use `<caption>` instead of cells with the `[colspan]` attribute to indicate a caption.
`<td>` elements in a large `<table>` have one or more table headers.
96

Best Practices

General

Errors logged to the console indicate unresolved problems. They can come from network request failures and other browser concerns. Learn more about this errors in console diagnostic audit

Why this matters

Performance issues directly impact user engagement and conversion rates.

SourceDescription
Failed to load resource: the server responded with a status of 404 ()
Manifest fetch from https://tapad.com/manifest.jsonjson?v=1 failed, code 404
Uses HTTPS
Avoids deprecated APIs
Avoids third-party cookies
Allows users to paste into input fields
Avoids requesting the geolocation permission on page load
Avoids requesting the notification permission on page load
Displays images with correct aspect ratio
Serves images with appropriate resolution
Page has the HTML doctype
Properly defines charset
No issues in the `Issues` panel in Chrome Devtools
Ensure CSP is effective against XSS attacks
Use a strong HSTS policy
Ensure proper origin isolation with COOP
Mitigate clickjacking with XFO or CSP
Mitigate DOM-based XSS with Trusted Types
Detected JavaScript libraries
Page has valid source maps
Redirects HTTP traffic to HTTPS
92

SEO

These checks ensure that your page is following basic search engine optimization advice. There are many additional factors Lighthouse does not score here that may affect your search ranking, including performance on Core Web Vitals. Learn more about Google Search Essentials.

Content Best Practices

Descriptive link text helps search engines understand your content. Learn how to make links more accessible.

Why this matters

Performance issues directly impact user engagement and conversion rates.

Link destinationLink Text
tapad.com/solutions/switchboardLEARN MORE

Format your HTML in a way that enables crawlers to better understand your app’s content.

Structured data is valid
Page isn’t blocked from indexing
Document has a `<title>` element
Document has a meta description
Page has successful HTTP status code
Links are crawlable
Image elements have `[alt]` attributes
Document has a valid `hreflang`
Document has a valid `rel=canonical`
robots.txt is valid

Lighthouse Scores

Industry-standard audits powered by Google Lighthouse. — Desktop

82
Performance Overall performance score (0–100) based on Core Web Vitals and other metrics. 90+ is good.
78
Accessibility Measures how accessible the page is for users with disabilities. Checks color contrast, ARIA labels, and semantic HTML.
96
Best Practices Checks for modern web development best practices including HTTPS, no console errors, and secure JavaScript.
92
SEO Measures basic SEO optimizations: meta tags, crawlability, link text, and mobile friendliness.

Core Web Vitals

Key metrics that affect user experience. — Desktop

First Contentful Paint First Contentful Paint — how long until the browser renders the first piece of content. Under 1.8s is good.

1.12 s

Largest Contentful Paint Largest Contentful Paint — how long until the largest visible element loads. Under 2.5s is good.

2.34 s

Total Blocking Time Total Blocking Time — total time the main thread was blocked, preventing user input. Under 200ms is good.

19 ms

Cumulative Layout Shift Cumulative Layout Shift — measures visual stability. How much the page layout shifts during loading. Under 0.1 is good.

0.001

Speed Index Speed Index — how quickly content is visually displayed during load. Under 3.4s is good.

2.01 s

Time to Interactive Time to Interactive — how long until the page is fully interactive and responds to user input. Under 3.8s is good.

2.34 s

Detailed Report

Audit breakdown by category with detailed findings.

82

Performance

Insights

Remove large, duplicate JavaScript modules from bundles to reduce unnecessary bytes consumed by network activity.

Why this matters

Performance issues directly impact user engagement and conversion rates.

Polyfills and transforms enable older browsers to use new JavaScript features. However, many aren't necessary for modern browsers. Consider modifying your JavaScript build process to not transpile Baseline features, unless you know you must support older browsers. Learn why most sites can deploy ES6+ code without transpiling

Why this matters

Shipping ES5 transpiled code to modern browsers wastes bytes — every user with an evergreen browser pays for compatibility you don't need.

Learn more

Most users today run browsers that natively support ES6+, async/await, optional chaining, and the rest of modern JavaScript. Transpiling to ES5 'just in case' adds 20-40% to your bundle for no benefit. Configure your build to target a modern browserslist, or ship a differential bundle pair (modern + legacy) with the module/nomodule pattern.

Source: Google web.dev / Lighthouse

3rd party code can significantly impact load performance. Reduce and defer loading of 3rd party code to prioritize your page's content.

Why this matters

Performance issues directly impact user engagement and conversion rates.

A long cache lifetime can speed up repeat visits to your page. Learn more about caching.

Why this matters

Performance issues directly impact user engagement and conversion rates.

Consider setting font-display to swap or optional to ensure text is consistently visible. swap can be further optimized to mitigate layout shifts with font metric overrides.

Why this matters

Performance issues directly impact user engagement and conversion rates.

Avoid chaining critical requests by reducing the length of chains, reducing the download size of resources, or deferring the download of unnecessary resources to improve page load.

Why this matters

Performance issues directly impact user engagement and conversion rates.

description: [preconnect](https://developer.chrome.com/docs/lighthouse/performance/uses-rel-preconnect/) hints help the browser establish a connection earlier in the page load, saving time when the first request for that origin is made. The following are the origins that the page preconnected to.
title: Preconnected origins
value: no origins were preconnected
description: Add [preconnect](https://developer.chrome.com/docs/lighthouse/performance/uses-rel-preconnect/) hints to your most important origins, but try to use no more than 4.
title: Preconnect candidates

Requests are blocking the page's initial render, which may delay LCP. Deferring or inlining can move these network requests out of the critical path.

Why this matters

Performance issues directly impact user engagement and conversion rates.

Your first network request is the most important. Reduce its latency by avoiding redirects, ensuring a fast server response, and enabling text compression.

Why this matters

Performance issues directly impact user engagement and conversion rates.

Reducing the download time of images can improve the perceived load time of the page and LCP. Learn more about optimizing image size

Why this matters

Performance issues directly impact user engagement and conversion rates.

URLResource SizeEst Savings
Adapt with Tapad LEARN MORE body.homepage > main.content > div.home-components > div.hero-home
tapad.com/assets/images/former-cloudfront/hero3_homepage.webp1.8 MiB1.4 MiB

These insights are also available in the Chrome DevTools Performance Panel - record a trace to view more detailed information.

Diagnostics

Minifying CSS files can reduce network payload sizes. Learn how to minify CSS.

Why this matters

Performance issues directly impact user engagement and conversion rates.

Estimated savings: 0.0 ms 29.3 KiB
URLTransfer SizeEst Savings
tapad.com/css/main.css?v=1690473096301.2 KiB29.3 KiB

Minifying JavaScript files can reduce payload sizes and script parse time. Learn how to minify JavaScript.

Why this matters

Performance issues directly impact user engagement and conversion rates.

Estimated savings: 120 ms 167.9 KiB

Reduce unused rules from stylesheets and defer CSS not used for above-the-fold content to decrease bytes consumed by network activity. Learn how to reduce unused CSS.

Why this matters

Performance issues directly impact user engagement and conversion rates.

Estimated savings: 320 ms 283.4 KiB
URLTransfer SizeEst Savings
tapad.com/css/main.css?v=1690473096300.3 KiB283.4 KiB

Reduce unused JavaScript and defer loading scripts until they are required to decrease bytes consumed by network activity. Learn how to reduce unused JavaScript.

Why this matters

Multi-megabyte JavaScript bundles delay every interactive feature on the page.

Learn more

This is the Lighthouse audit fired when too much JS is shipped relative to what executes. The fix isn't a config flag — it requires bundle analysis (webpack-bundle-analyzer, rollup-plugin-visualizer), splitting routes into chunks, lazy-loading off-screen components, and removing unused dependencies. Fundamentally different from minification: minifying reduces byte count, this reduces what's downloaded at all.

Source: Google web.dev / Lighthouse

Estimated savings: 200 ms 224.7 KiB
URLTransfer SizeEst Savings
tapad.com/js/bundle.js?v=1690473096311.6 KiB197.6 KiB
platform-api.sharethis.com/js/sharethis.js46.3 KiB27.1 KiB

Set an explicit width and height on image elements to reduce layout shifts and improve CLS. Learn how to set image dimensions

Why this matters

Performance issues directly impact user engagement and conversion rates.

URL
Consumerbehavior div.row > div.col-12 > div.content-slider-img > img.img-fluid
tapad.com/assets/images/former-cloudfront/ConsumerBehavior.webp
Deviceconnections div.row > div.col-12 > div.content-slider-img > img.img-fluid
tapad.com/assets/images/former-cloudfront/DeviceConnections.webp
Didyouknowd div.col-12 > a > div.content-slider-img > img.img-fluid
tapad.com/assets/images/former-cloudfront/DidYouKnowd.webp
Consumerbehavior div.row > div.col-12 > div.content-slider-img > img.img-fluid
tapad.com/assets/images/former-cloudfront/ConsumerBehavior.webp
TAPAD LOGO div.row > div.footer-logo > a > img
tapad.com/assets/images/singles/logos/TapadExpStacked_purple.svg
Scroll Icon div.home-components > div.hero-home > div.scroll-icon > img
tapad.com/assets/images/singles/home/scroller.svg
Icon div.col-12 > div.element > div.four-up-icon-box > img.img-fluid
Openx Logo div.our-partners > div.row > div.col > img.lazyload
Amobee div.our-partners > div.row > div.col > img.lazyload
Beeswaxlogo Converted div.our-partners > div.row > div.col > img.lazyload
Arm div.our-partners > div.row > div.col > img.lazyload
Partner Logo Ttd div.our-partners > div.row > div.col > img.lazyload
Adswizz div.our-partners > div.row > div.col > img.lazyload
Twine Data Logo div.our-partners > div.row > div.col > img.lazyload
Charcoal Grey Basis Technologies Logo div.our-partners > div.row > div.col > img.lazyload
Freckle Logo div.our-partners > div.row > div.col > img.lazyload
Flashtalking Logo div.our-partners > div.row > div.col > img.lazyload
Resonate New Logo White div.our-partners > div.row > div.col > img.lazyload
Sizmek div.our-partners > div.row > div.col > img.lazyload
EDAA Certification div.footer-icons > div.footer-image-icons > a > img.edaa-logo
Made in NY div.row > div.footer-icons > div.footer-image-icons > img.made-in-ny-icon

More information about the performance of your application. These numbers don't directly affect the Performance score.

Time to Interactive 2.3 s
Max Potential First Input Delay 70 ms
Layout shift culprits
Optimize DOM size
Forced reflow
LCP breakdown
Modern HTTP
Optimize viewport for mobile
JavaScript execution time 0.3 s
Minimizes main-thread work 1.0 s
Avoid long main-thread tasks 2 long tasks found
Avoid non-composited animations 1 animated element found
Page didn't prevent back/forward cache restoration
Network Requests
Network Round Trip Times 10 ms
Server Backend Latencies 120 ms
Tasks
Diagnostics
Metrics
Screenshot Thumbnails
Final Screenshot
Script Treemap Data
Resources Summary
Avoid multiple page redirects
Initial server response time was short Root document took 120 ms
Avoid large layout shifts 1 layout shift found
INP breakdown
LCP request discovery
User Timing marks and measures
78

Accessibility

These checks highlight opportunities to improve the accessibility of your web app. Automatic detection can only detect a subset of issues and does not guarantee the accessibility of your web app, so manual testing is also encouraged.

Names and labels

When a button doesn't have an accessible name, screen readers announce it as "button", making it unusable for users who rely on screen readers. Learn how to make buttons more accessible.

Why this matters

Performance issues directly impact user engagement and conversion rates.

Failing Elements
div.content-slider-wrapper > div.content-slider > div.owl-nav > button.owl-prev div.content-slider-wrapper > div.content-slider > div.owl-nav > button.owl-prev
div.content-slider-wrapper > div.content-slider > div.owl-nav > button.owl-next div.content-slider-wrapper > div.content-slider > div.owl-nav > button.owl-next
div.content-slider-wrapper > div.content-slider > div.owl-dots > button.owl-dot div.content-slider-wrapper > div.content-slider > div.owl-dots > button.owl-dot

Link text (and alternate text for images, when used as links) that is discernible, unique, and focusable improves the navigation experience for screen reader users. Learn how to make links accessible.

Why this matters

Performance issues directly impact user engagement and conversion rates.

Failing Elements
div.owl-item > div.container1 > div.row > a div.owl-item > div.container1 > div.row > a
div.row > div.footer-icons > div.social-icons > a div.row > div.footer-icons > div.social-icons > a

These are opportunities to improve the semantics of the controls in your application. This may enhance the experience for users of assistive technology, like a screen reader.

Navigation

Properly ordered headings that do not skip levels convey the semantic structure of the page, making it easier to navigate and understand when using assistive technologies. Learn more about heading order.

Why this matters

Performance issues directly impact user engagement and conversion rates.

Failing Elements
WE PROVIDE THE WORLD’S LEADING DIGITAL CROSS-DEVICE GRAPH div.container > div.d-flex > div.home-intro-paragraph-inner > h3

These are opportunities to improve keyboard navigation in your application.

Internationalization and localization

If a page doesn't specify a `lang` attribute, a screen reader assumes that the page is in the default language that the user chose when setting up the screen reader. If the page isn't actually in the default language, then the screen reader might not announce the page's text correctly. Learn more about the `lang` attribute.

Why this matters

Performance issues directly impact user engagement and conversion rates.

Failing Elements
html.fontawesome-i2svg-active html.fontawesome-i2svg-active

These are opportunities to improve the interpretation of your content by users in different locales.

Interactive controls are keyboard focusable
Interactive elements indicate their purpose and state
The page has a logical tab order
Visual order on the page follows DOM order
User focus is not accidentally trapped in a region
The user's focus is directed to new content added to the page
HTML5 landmark elements are used to improve navigation
Offscreen content is hidden from assistive technology
Custom controls have associated labels
Custom controls have ARIA roles
`[aria-hidden="true"]` is not present on the document `<body>`
`[role]`s have all required `[aria-*]` attributes
`[role]` values are valid
Image elements have `[alt]` attributes
`[user-scalable="no"]` is not used in the `<meta name="viewport">` element and the `[maximum-scale]` attribute is not less than 5.
`[aria-hidden="true"]` elements do not contain focusable descendents
Background and foreground colors have a sufficient contrast ratio
Document has a `<title>` element
Lists contain only `<li>` elements and script supporting elements (`<script>` and `<template>`).
List items (`<li>`) are contained within `<ul>`, `<ol>` or `<menu>` parent elements
Touch targets have sufficient size and spacing.
Document has a main landmark.
Deprecated ARIA roles were not used
All heading elements contain content.
Uses ARIA roles only on compatible elements
`[accesskey]` values are unique
`[aria-*]` attributes match their roles
`button`, `link`, and `menuitem` elements have accessible names
ARIA attributes are used as specified for the element's role
Elements with `role="dialog"` or `role="alertdialog"` have accessible names.
ARIA input fields have accessible names
ARIA `meter` elements have accessible names
ARIA `progressbar` elements have accessible names
Elements use only permitted ARIA attributes
Elements with an ARIA `[role]` that require children to contain a specific `[role]` have all required children.
`[role]`s are contained by their required parent element
Elements with the `role=text` attribute do not have focusable descendents.
ARIA toggle fields have accessible names
ARIA `tooltip` elements have accessible names
ARIA `treeitem` elements have accessible names
`[aria-*]` attributes have valid values
`[aria-*]` attributes are valid and not misspelled
The page contains a heading, skip link, or landmark region
`<dl>`'s contain only properly-ordered `<dt>` and `<dd>` groups, `<script>`, `<template>` or `<div>` elements.
Definition list items are wrapped in `<dl>` elements
ARIA IDs are unique
No form fields have multiple labels
`<frame>` or `<iframe>` elements have a title
`<html>` element has a valid value for its `[lang]` attribute
`<html>` element has an `[xml:lang]` attribute with the same base language as the `[lang]` attribute.
Input buttons have discernible text.
`<input type="image">` elements have `[alt]` text
Form elements have associated labels
Links are distinguishable without relying on color.
The document does not use `<meta http-equiv="refresh">`
`<object>` elements have alternate text
Select elements have associated label elements.
Skip links are focusable.
No element has a `[tabindex]` value greater than 0
Cells in a `<table>` element that use the `[headers]` attribute refer to table cells within the same table.
`<th>` elements and elements with `[role="columnheader"/"rowheader"]` have data cells they describe.
`[lang]` attributes have a valid value
`<video>` elements contain a `<track>` element with `[kind="captions"]`
Tables have different content in the summary attribute and `<caption>`.
Image elements do not have `[alt]` attributes that are redundant text.
Identical links have the same purpose.
Elements with visible text labels have matching accessible names.
Tables use `<caption>` instead of cells with the `[colspan]` attribute to indicate a caption.
`<td>` elements in a large `<table>` have one or more table headers.
96

Best Practices

General

Errors logged to the console indicate unresolved problems. They can come from network request failures and other browser concerns. Learn more about this errors in console diagnostic audit

Why this matters

Performance issues directly impact user engagement and conversion rates.

SourceDescription
Failed to load resource: the server responded with a status of 404 ()
Manifest fetch from https://tapad.com/manifest.jsonjson?v=1 failed, code 404
Uses HTTPS
Avoids deprecated APIs
Avoids third-party cookies
Allows users to paste into input fields
Avoids requesting the geolocation permission on page load
Avoids requesting the notification permission on page load
Displays images with correct aspect ratio
Serves images with appropriate resolution
Page has the HTML doctype
Properly defines charset
No issues in the `Issues` panel in Chrome Devtools
Ensure CSP is effective against XSS attacks
Use a strong HSTS policy
Ensure proper origin isolation with COOP
Mitigate clickjacking with XFO or CSP
Mitigate DOM-based XSS with Trusted Types
Detected JavaScript libraries
Page has valid source maps
Redirects HTTP traffic to HTTPS
92

SEO

These checks ensure that your page is following basic search engine optimization advice. There are many additional factors Lighthouse does not score here that may affect your search ranking, including performance on Core Web Vitals. Learn more about Google Search Essentials.

Content Best Practices

Descriptive link text helps search engines understand your content. Learn how to make links more accessible.

Why this matters

Performance issues directly impact user engagement and conversion rates.

Link destinationLink Text
tapad.com/solutions/switchboardLEARN MORE

Format your HTML in a way that enables crawlers to better understand your app’s content.

Structured data is valid
Page isn’t blocked from indexing
Document has a `<title>` element
Document has a meta description
Page has successful HTTP status code
Links are crawlable
Image elements have `[alt]` attributes
Document has a valid `hreflang`
Document has a valid `rel=canonical`
robots.txt is valid

Send Feedback