Global Performance
6/6 locations ✓Acceptable global latency — average 380ms across 6 locations, fastest from Amsterdam (91ms), slowest from Sao Paulo (656ms). No CDN detected. 3 locations above the 500ms target.
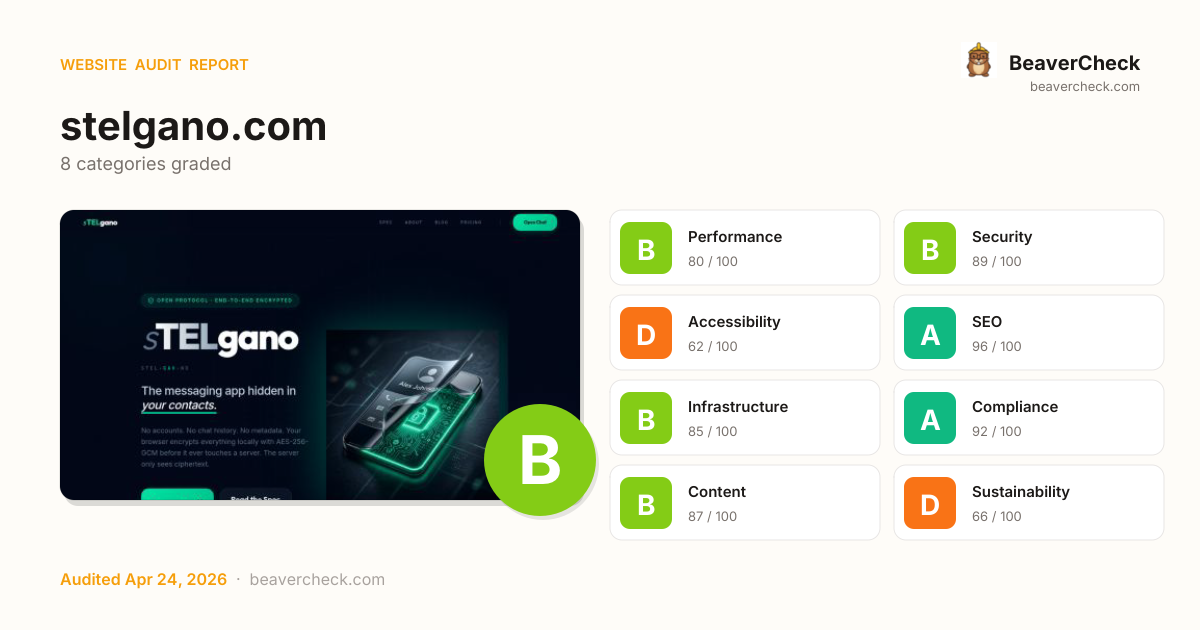
Audit overview
Accessibility and Sustainability need attention; the other categories are in good shape.
Fix Priority Matrix
5 findingsQuick Wins
2High impact, low effort — start here.
Strategic
3High impact, requires investment.
Easy Improvements
0Small gains, minimal effort.
Nothing in this quadrant — good news.
Deprioritize
0Low impact, high effort — do last.
Nothing in this quadrant — good news.
Screenshots
Top Priorities (5)
Page weighs 5.8 MB (5.2 MB transferred)
Informational: total page weight (uncompressed) and bytes actually transferred over the wire.
2 button(s) with no accessible text
Buttons with no accessible text (icon-only, no aria-label) can't be activated by voice control or understood by screen readers.
Images are 4.8 MB — compress or use modern formats
Image bandwidth is high — modern formats (WebP/AVIF) and resizing typically cut it 50%+.
No DMARC record found
Without DMARC, anyone can send phishing emails using your domain name.
Page weight 4.2 MB over 1MB target
Performance issues directly impact user engagement and conversion rates.
Business case
What fixing the audit's findings is worth -- and what ignoring them keeps costing.
Return on investment
$500 investment → $5,587/month returns + USD 150,000 risk avoided
Figures combine localized regulatory fine ceilings, search/conversion value priced against local CPC, and bandwidth waste estimates. Results depend on implementation quality and audience composition. Not legal or financial advice.
Conversion barriers
4 barrier(s) likely increasing bounce by ~14%.
- Page loads in 3.4sEvery additional 100ms above 2.5s costs conversions — you're 941ms over→ Target <2.5s LCP: defer non-critical scripts and optimize the hero image
- High main-thread blocking timePage is non-interactive for 408ms after first paint→ Defer third-party scripts and split large bundles
- No structured dataNo rich-result eligibility in Google — lower SERP CTR vs competitors with stars and prices→ Add JSON-LD for your page type (Product, Article, FAQPage, LocalBusiness, …)
- No skip-to-content linkKeyboard and screen-reader users must tab through the entire header on every page→ Add a visible-on-focus <a href="#main">Skip to content</a> as the first focusable element
Preliminary CRO audit — each barrier links to the tab with detailed analysis.
Remediation cost
Start here for the best return on investment
Cost by category
Cost by effort level
Adjust assumptions
Team composition
Multiplier applied to dev hours to reflect QA, design, and PM overhead. Use Dev only for solo work; Full team for projects with formal review processes.
Rates reflect fully-loaded developer cost including overhead
Warning:Cost of inaction
Compliance Risk
$150,000
- 2 of 2 <nav> elements are unlabeledADA Title III: USD 25,000 – USD 150,000
- Skip navigation link is missing (WCAG 2.4.1)ADA Title III: USD 25,000 – USD 150,000
Bounce-Rate Cost
$3,813 /mo
+14.2pp bounce · ~1,417 lost visitors/mo
CPC: USD 2.69
Bandwidth Waste
$1.30 /mo
16209.3 MB/mo × 0.080 USD/GB
- Optimize transfer: save ~1.6 MB per page loadSaves $1.30/mo
Compliance figures represent the statutory maximum fine for the most severe triggered category, capped per regulation — not the sum of per-finding penalties. Based on published regulatory fine ranges. This is not legal advice.
Unique monthly visitors from your analytics
Purchases, signups, or key actions
Optional — for revenue estimation
more engaged visitors from reduced bounce
Fix 2 critical issues to capture this value
How this is calculated
Based on Google/Deloitte research ("Milliseconds Make Millions") showing a ~7% bounce rate increase per additional second of LCP above the 2.5s "Good" threshold.
Your site's LCP: → estimated after fixes.
These are estimates based on industry research — actual results vary
Your data stays in your browser — nothing is sent to our servers
Lighthouse
Mobile
First Contentful Paint First Contentful Paint — how long until the browser renders the first piece of content. Under 1.8s is good.
986 ms
Largest Contentful Paint Largest Contentful Paint — how long until the largest visible element loads. Under 2.5s is good.
3.44 s
Total Blocking Time Total Blocking Time — total time the main thread was blocked, preventing user input. Under 200ms is good.
408 ms
Cumulative Layout Shift Cumulative Layout Shift — measures visual stability. How much the page layout shifts during loading. Under 0.1 is good.
0.023
Speed Index Speed Index — how quickly content is visually displayed during load. Under 3.4s is good.
4.40 s
Time to Interactive Time to Interactive — how long until the page is fully interactive and responds to user input. Under 3.8s is good.
11.31 s
Desktop
First Contentful Paint First Contentful Paint — how long until the browser renders the first piece of content. Under 1.8s is good.
468 ms
Largest Contentful Paint Largest Contentful Paint — how long until the largest visible element loads. Under 2.5s is good.
3.02 s
Total Blocking Time Total Blocking Time — total time the main thread was blocked, preventing user input. Under 200ms is good.
0 ms
Cumulative Layout Shift Cumulative Layout Shift — measures visual stability. How much the page layout shifts during loading. Under 0.1 is good.
0.024
Speed Index Speed Index — how quickly content is visually displayed during load. Under 3.4s is good.
640 ms
Time to Interactive Time to Interactive — how long until the page is fully interactive and responds to user input. Under 3.8s is good.
3.02 s
Categories
8Performance
Page weighs 5.8 MB (5.2 MB transferred)
Security
No DMARC record found
Accessibility
2 button(s) with no accessible text
SEO
All checks pass
Infrastructure
All checks pass
Compliance
All checks pass
Content
All checks pass
Sustainability
All checks pass
How you compare
Where this site stands against peers running the same stack.
Top 10% of HSTS sites score 95+ on Infrastructure; you're at 85 — closing this gap is the highest-leverage improvement.
Top 10% of HTTP/3 sites score 96+ on Sustainability; you're at 66 — closing this gap is the highest-leverage improvement.
Technology stack
HSTS, on Elixir
Stack Architecture
 HTTP/3
  Lucide
  Open Graph
  Phoenix Framework Phoenix LiveView
  Tailwind CSS
  Elixir
  Erlang
 All Detected Technologies (9)
Elixir is a dynamic, functional language designed for building scalable and maintainable applications.
Erlang is a general-purpose, concurrent, functional programming language, and a garbage-collected runtime system.
HTTP Strict Transport Security (HSTS) informs browsers that the site should only be accessed using HTTPS.
HTTP/3 is the third major version of the Hypertext Transfer Protocol used to exchange information on the World Wide Web.
Lucide is an open-source icon library that provides 1000+ vector (svg) files for displaying icons and symbols in digital and non-digital projects.
Open Graph is a protocol that is used to integrate any web page into the social graph.
Phoenix Framework is an open-source web application framework built using the Elixir programming language.
Phoenix LiveView is a library that brings live, interactive, real-time user experiences to your Phoenix applications.
Observations (2)
No build tool detected
A framework (HSTS) was detected but no bundler was identified. The build tool may not be detectable from output patterns, or the site may use the framework's built-in bundler.
Complex technology stack detected
9 technologies identified. A complex stack increases maintenance burden and attack surface. Consider whether all components are actively needed.
Show your score
Drop this badge on your README, marketing site, or status page. It auto-updates every time the audit re-runs and links back to this report.
This badge auto-updates with your latest scan result.
[](https://beavercheck.com/results/936f5591-46ec-43a4-a5cd-e12fe33cac1b)<a href="https://beavercheck.com/results/936f5591-46ec-43a4-a5cd-e12fe33cac1b"><img src="https://beavercheck.com/badge?url=https%3A%2F%2Fstelgano.com" alt="BeaverCheck Score"></a>https://beavercheck.com/badge?url=https%3A%2F%2Fstelgano.comExport & share
Download the audit, share with your team, or grab a fix plan ready to copy into your tracker.
Copies markdown to clipboard
Fix Plan
Three-week roadmap to ship the audit's findings, with one-click copy targets for your tracker.
Three-week fix plan
2 sprints · 5h total → projected B (89)
Sprint 1: Quick Wins
+4Highest ROI — low effort, high impact
- · Page weighs 5.8 MB (5.2 MB transferred)
- · 2 button(s) with no accessible text
Sprint 2: Core Fixes
+2Medium effort, high structural impact
- · No DMARC record found
- · Images are 4.8 MB — compress or use modern formats
- · Page weight 4.2 MB over 1MB target