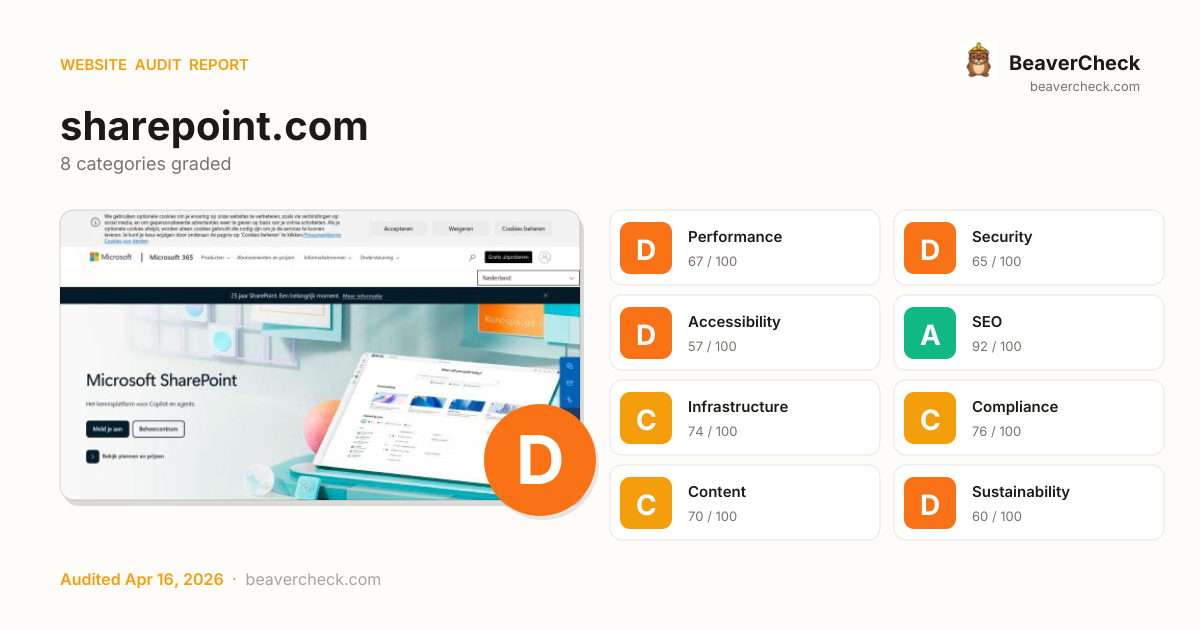
Mobile 375 × 812

Desktop 1440 × 900

Score: 69 / 100
Based on 8 categories, 0 sections
Room to improve — your 21.7s load time is above Google's 2.5s 'Good' threshold.
Several missing protections leave your users and data exposed.
Several issues make your site difficult for assistive technology users.
Well-optimized for search — your content is discoverable.
Good server performance with room for optimization.
Mostly compliant — a few items need attention.
Good content signals with minor gaps.
Heavier than average — reducing page weight saves energy and bandwidth.
The overall score is a weighted average of individual category scores. Categories with more impact on user experience and security carry more weight.
Weights reflect general web best practices. Individual needs may differ.
Content-Security-Policy header is missing
Security gaps expose your site and users to attacks, eroding trust.
HSTS header is missing
Security gaps expose your site and users to attacks, eroding trust.
No Content-Security-Policy header found
Security gaps expose your site and users to attacks, eroding trust.
Page weighs 10.9 MB (4.8 MB transferred)
Performance issues directly impact user engagement and conversion rates.
2 image-only link(s) without alt text
Accessibility issues exclude users with disabilities — up to 15% of your potential audience.
High impact, low effort — start here.
High impact, requires investment.
Small gains, minimal effort.
Nothing in this quadrant — good news.
Low impact, high effort — do last.
Nothing in this quadrant — good news.
[](https://beavercheck.com/results/98f39d95-593f-40f7-a58d-28c425911b2f)<a href="https://beavercheck.com/results/98f39d95-593f-40f7-a58d-28c425911b2f"><img src="https://beavercheck.com/badge?url=https%3A%2F%2Fsharepoint.com" alt="BeaverCheck Score"></a>https://beavercheck.com/badge?url=https%3A%2F%2Fsharepoint.comThis badge auto-updates with your latest scan result.
Your site has several issues that may be affecting user experience and business outcomes. Your LCP of 21.7s exceeds Google's 2.5s 'Good' threshold and the 1 performance issue below directly contributes to it. Accessibility issues exclude users who rely on assistive technology — an estimated 15% of your potential audience. Addressing the critical issues below would have the most immediate impact on your user trust.
9 barrier(s) likely increasing bounce by ~34%.
Page takes 21.7s to load
+12% bounceUsers abandon at ~3s — you're 19.2s over the 2.5s threshold
Fix: Optimize render-blocking resources, preload the hero image, and compress images
Page feels frozen for 4.0s
+5% bounceClicks on the primary CTA are ignored while JavaScript runs
Fix: Break up long tasks; defer non-critical JavaScript to post-hydration
No HSTS header
+1% bounceReturning visitors are briefly exposed to downgrade attacks on first request
Fix: Set Strict-Transport-Security: max-age=31536000; includeSubDomains
No Content-Security-Policy header
+1% bounceHigher XSS blast radius — one compromised script can exfiltrate the checkout form
Fix: Ship a reporting-only CSP first, then enforce once violations are clean
Severe layout shift during page load
+6% bounceUsers mis-click when content jumps — converting intent into frustration
Fix: Reserve space for images, ads, and embeds with explicit width/height
No structured data
+2% bounceNo rich-result eligibility in Google — lower SERP CTR vs competitors with stars and prices
Fix: Add JSON-LD for your page type (Product, Article, FAQPage, LocalBusiness, …)
Content is hard to read
+2% bounceGraduate-level reading difficulty — limits the addressable audience for product or blog pages
Fix: Shorten sentences; replace jargon with plain language; target Flesch ease ≥60
No skip-to-content link
+1% bounceKeyboard and screen-reader users must tab through the entire header on every page
Fix: Add a visible-on-focus <a href="#main">Skip to content</a> as the first focusable element
39 broken link(s) on the page
+5% bounceClicks land on 404s — trust drops and the session often ends
Fix: Fix or remove the broken destinations surfaced on the Content tab
Preliminary CRO audit — each barrier links to the tab with detailed analysis.
€425 investment → €1.11/month returns + EUR 120,500,000 risk avoided
€425
5h · 5 findings
€1.11 /mo
~€13 / year
EUR 120,500,000
if kept compliant
€128 — in quick wins — start here for the fastest payback
Figures combine localized regulatory fine ceilings, search/conversion value priced against local CPC, and bandwidth waste estimates. Results depend on implementation quality and audience composition. Not legal or financial advice.
5.0 developer hours at €85/hr
Based on Netherlands rates (€85/hr)
Start here for the best return on investment
€10,041,668 / month at risk
~€120,500,013 / year if left unfixed
€120,500,000
+6 more
€1.11 /mo
14999.5 MB/mo × 0.074 EUR/GB
Compliance figures represent the statutory maximum fine for the most severe triggered category, capped per regulation — not the sum of per-finding penalties. Based on published regulatory fine ranges. This is not legal advice.
Unique monthly visitors from your analytics
Purchases, signups, or key actions
Optional — for revenue estimation
more engaged visitors from reduced bounce
Fix 5 critical issues to capture this value
Based on Google/Deloitte research ("Milliseconds Make Millions") showing a ~7% bounce rate increase per additional second of LCP above the 2.5s "Good" threshold.
Your site's LCP: → estimated after fixes.
These are estimates based on industry research — actual results vary
Your data stays in your browser — nothing is sent to our servers
Thanks for your feedback!
We'll use a cached audit if available, or offer to scan.
Industry-standard audits powered by Google Lighthouse.
Key metrics that affect user experience.
First Contentful Paint First Contentful Paint — how long until the browser renders the first piece of content. Under 1.8s is good.
10.09 s
Largest Contentful Paint Largest Contentful Paint — how long until the largest visible element loads. Under 2.5s is good.
21.71 s
Total Blocking Time Total Blocking Time — total time the main thread was blocked, preventing user input. Under 200ms is good.
4.03 s
Cumulative Layout Shift Cumulative Layout Shift — measures visual stability. How much the page layout shifts during loading. Under 0.1 is good.
0.399
Speed Index Speed Index — how quickly content is visually displayed during load. Under 3.4s is good.
11.65 s
Time to Interactive Time to Interactive — how long until the page is fully interactive and responds to user input. Under 3.8s is good.
32.01 s
Audit breakdown by category with detailed findings.
Remove large, duplicate JavaScript modules from bundles to reduce unnecessary bytes consumed by network activity.
Performance issues directly impact user engagement and conversion rates.
Polyfills and transforms enable older browsers to use new JavaScript features. However, many aren't necessary for modern browsers. Consider modifying your JavaScript build process to not transpile Baseline features, unless you know you must support older browsers. Learn why most sites can deploy ES6+ code without transpiling
Shipping ES5 transpiled code to modern browsers wastes bytes — every user with an evergreen browser pays for compatibility you don't need.
Most users today run browsers that natively support ES6+, async/await, optional chaining, and the rest of modern JavaScript. Transpiling to ES5 'just in case' adds 20-40% to your bundle for no benefit. Configure your build to target a modern browserslist, or ship a differential bundle pair (modern + legacy) with the module/nomodule pattern.
Source: Google web.dev / Lighthouse
3rd party code can significantly impact load performance. Reduce and defer loading of 3rd party code to prioritize your page's content.
Performance issues directly impact user engagement and conversion rates.
A long cache lifetime can speed up repeat visits to your page. Learn more about caching.
Performance issues directly impact user engagement and conversion rates.
Layout shifts occur when elements move absent any user interaction. Investigate the causes of layout shifts, such as elements being added, removed, or their fonts changing as the page loads.
Performance issues directly impact user engagement and conversion rates.
Your first network request is the most important. Reduce its latency by avoiding redirects, ensuring a fast server response, and enabling text compression.
Performance issues directly impact user engagement and conversion rates.
Consider setting font-display to swap or optional to ensure text is consistently visible. swap can be further optimized to mitigate layout shifts with font metric overrides.
Performance issues directly impact user engagement and conversion rates.
A forced reflow occurs when JavaScript queries geometric properties (such as offsetWidth) after styles have been invalidated by a change to the DOM state. This can result in poor performance. Learn more about forced reflows and possible mitigations.
Performance issues directly impact user engagement and conversion rates.
Reducing the download time of images can improve the perceived load time of the page and LCP. Learn more about optimizing image size
Performance issues directly impact user engagement and conversion rates.
| URL | Resource Size | Est Savings | |
|---|---|---|---|
div.section-master__image > div.ocr-img > picture > img div.section-master__image > div.ocr-img > picture > img | /is/image/microsoftcorp/1072651-HeroBG-1600x616?resMode=s... | 592.3 KiB | 559.7 KiB |
div > div.media > div.ocr-img > img#image-oc323d div > div.media > div.ocr-img > img#image-oc323d | /is/image/microsoftcorp/1072651-Vertical-Accordian-4.4-80... | 237.7 KiB | 193.5 KiB |
div.card__media > div.media > div.ocr-img > img#image-oc126d div.card__media > div.media > div.ocr-img > img#image-oc126d | /is/image/microsoftcorp/1072651-Overview-01-416x178?resMo... | 146.8 KiB | 119.7 KiB |
div.card__media > div.media > div.ocr-img > img div.card__media > div.media > div.ocr-img > img | /is/image/microsoftcorp/1072651-Overview-02-416x178?resMo... | 122.8 KiB | 95.7 KiB |
div.card__media > div.media > div.ocr-img > img#image-ocaec5 div.card__media > div.media > div.ocr-img > img#image-ocaec5 | /is/image/microsoftcorp/1072651-Overview-03-416x178?resMo... | 119.5 KiB | 92.4 KiB |
div.col > div.media > div.ocr-img > img#image-ocb533 div.col > div.media > div.ocr-img > img#image-ocb533 | /is/image/microsoftcorp/3218600_Thumbnail_InteractiveDemo... | 114.8 KiB | 82.7 KiB |
div.card__media > div.media > div.ocr-img > img#image-oc58dd div.card__media > div.media > div.ocr-img > img#image-oc58dd | /is/image/microsoftcorp/1072651-Overview-02-304x131?resMo... | 93.7 KiB | 66.6 KiB |
Optimize LCP by making the LCP image discoverable from the HTML immediately, and avoiding lazy-loading
Performance issues directly impact user engagement and conversion rates.
Avoid chaining critical requests by reducing the length of chains, reducing the download size of resources, or deferring the download of unnecessary resources to improve page load.
Performance issues directly impact user engagement and conversion rates.
Requests are blocking the page's initial render, which may delay LCP. Deferring or inlining can move these network requests out of the critical path.
Performance issues directly impact user engagement and conversion rates.
These insights are also available in the Chrome DevTools Performance Panel - record a trace to view more detailed information.
Time to Interactive is the amount of time it takes for the page to become fully interactive. Learn more about the Time to Interactive metric.
Performance issues directly impact user engagement and conversion rates.
The maximum potential First Input Delay that your users could experience is the duration of the longest task. Learn more about the Maximum Potential First Input Delay metric.
Performance issues directly impact user engagement and conversion rates.
Redirects introduce additional delays before the page can be loaded. Learn how to avoid page redirects.
Performance issues directly impact user engagement and conversion rates.
These are the largest layout shifts observed on the page. Each table item represents a single layout shift, and shows the element that shifted the most. Below each item are possible root causes that led to the layout shift. Some of these layout shifts may not be included in the CLS metric value due to windowing. Learn how to improve CLS
Performance issues directly impact user engagement and conversion rates.
| Element | Layout shift score |
|---|---|
Choose your billing country/region:
Nederland
Aruba
Bonaire, Sint Eustatius en … div > div.root > div.aem-Grid > div.layout-container | 0.399 |
Microsoft SharePoint
Het kennisplatform voor Copilot en agents.
Meld je aan
Beh… div.responsivegrid > div.aem-Grid > div.section-master > div#primaryArea | 0.119 |
Nederland
Aruba
Bonaire, Sint Eustatius en Saba
Curaçao
Suriname div#market-selector-oc20ad > div.d-flex > div.custom-select > select#x5f88c43e04a846b9a133111371502400 | 0.000 |
div.list-item__inner > div.list-item__trailing > div.ocr-icon > span.glyph-prepend div.list-item__inner > div.list-item__trailing > div.ocr-icon > span.glyph-prepend | 0.000 |
Minifying JavaScript files can reduce payload sizes and script parse time. Learn how to minify JavaScript.
Performance issues directly impact user engagement and conversion rates.
| URL | Transfer Size | Est Savings |
|---|---|---|
| /golf/etc.clientlibs/microsoft/components/structure/page/... | 552.2 KiB | 504.0 KiB |
| /golf/etc.clientlibs/onecloud/clientlibs/clientlib-mwf-ne... | 86.6 KiB | 36.7 KiB |
| /golf/etc.clientlibs/onecloud/clientlibs/clientlib-produc... | 23.2 KiB | 13.6 KiB |
| /etc.clientlibs/onecloud/clientlibs/clientlib-product-pri... | 23.2 KiB | 13.6 KiB |
| /etc.clientlibs/onecloud/clientlibs/clientlib-product-pri... | 23.2 KiB | 13.6 KiB |
| /etc.clientlibs/onecloud/clientlibs/clientlib-product-pri... | 23.2 KiB | 13.6 KiB |
| /etc.clientlibs/onecloud/clientlibs/clientlib-product-pri... | 23.2 KiB | 13.6 KiB |
| /golf/etc.clientlibs/onecloud/clientlibs/clientlib-cookie... | 4.8 KiB | 2.8 KiB |
| /golf/etc.clientlibs/cascade.component.authoring/clientli... | 5.0 KiB | 2.5 KiB |
Reduce unused rules from stylesheets and defer CSS not used for above-the-fold content to decrease bytes consumed by network activity. Learn how to reduce unused CSS.
Performance issues directly impact user engagement and conversion rates.
| URL | Transfer Size | Est Savings |
|---|---|---|
| /golf/etc.clientlibs/onecloud/clientlibs/clientlib-reimag... | 99.3 KiB | 81.3 KiB |
| /golf/etc.clientlibs/onecloud/clientlibs/clientlib-mwf-ne... | 39.6 KiB | 38.1 KiB |
| /onerfstatics/marketingsites-neu-prod/west-european/shell... | 22.3 KiB | 20.2 KiB |
| .mectrl_resetStyle,a.mectrl_resetStyle,button.mectrl_resetStyle{height:auto;min-width:auto; … } … | 15.2 KiB | 14.9 KiB |
| .mectrl_resetStyle,a.mectrl_resetStyle,button.mectrl_resetStyle{height:auto;min-width:auto; … } … | 10.3 KiB | 10.2 KiB |
Reduce unused JavaScript and defer loading scripts until they are required to decrease bytes consumed by network activity. Learn how to reduce unused JavaScript.
Multi-megabyte JavaScript bundles delay every interactive feature on the page.
This is the Lighthouse audit fired when too much JS is shipped relative to what executes. The fix isn't a config flag — it requires bundle analysis (webpack-bundle-analyzer, rollup-plugin-visualizer), splitting routes into chunks, lazy-loading off-screen components, and removing unused dependencies. Fundamentally different from minification: minifying reduces byte count, this reduces what's downloaded at all.
Source: Google web.dev / Lighthouse
| URL | Transfer Size | Est Savings |
|---|---|---|
| www.microsoft.com/videoplayer/ump.mjs | 348.4 KiB | 245.6 KiB |
| /golf/etc.clientlibs/onecloud/clientlibs/clientlib-reimag... | 149.1 KiB | 105.4 KiB |
| /golf/etc.clientlibs/onecloud/clientlibs/clientlib-mwf-ne... | 86.6 KiB | 53.6 KiB |
| /golf/etc.clientlibs/cascade.component.authoring/clientli... | 68.2 KiB | 40.9 KiB |
| www.microsoft.com/msonecloudapi/assets/msochead.js | 44.6 KiB | 28.0 KiB |
| /onerfstatics/marketingsites-neu-prod/shell/_scrf/js/them... | 36.3 KiB | 21.1 KiB |
| www.microsoft.com/msonecloudapi/assets/msocbody.js | 40.1 KiB | 20.5 KiB |
Consider reducing the time spent parsing, compiling, and executing JS. You may find delivering smaller JS payloads helps with this. Learn how to reduce Javascript execution time.
Performance issues directly impact user engagement and conversion rates.
Consider reducing the time spent parsing, compiling and executing JS. You may find delivering smaller JS payloads helps with this. Learn how to minimize main-thread work
Performance issues directly impact user engagement and conversion rates.
| Category | Time Spent |
|---|---|
| Style & Layout | 8.3 s |
| Script Evaluation | 5.1 s |
| Other | 2.5 s |
| Script Parsing & Compilation | 1.2 s |
| Parse HTML & CSS | 544 ms |
| Rendering | 294 ms |
| Garbage Collection | 70 ms |
Many navigations are performed by going back to a previous page, or forwards again. The back/forward cache (bfcache) can speed up these return navigations. Learn more about the bfcache
Performance issues directly impact user engagement and conversion rates.
| Failure reason | Failure type |
|---|---|
| The page has an unload handler in the main frame. | Actionable |
Large network payloads cost users real money and are highly correlated with long load times. Learn how to reduce payload sizes.
Performance issues directly impact user engagement and conversion rates.
Set an explicit width and height on image elements to reduce layout shifts and improve CLS. Learn how to set image dimensions
Performance issues directly impact user engagement and conversion rates.
| URL | |
|---|---|
div > div.media > div.ocr-img > img#image-oc323d div > div.media > div.ocr-img > img#image-oc323d | /is/image/microsoftcorp/1072651-Vertical-Accordian-4.4-80... |
div.col > div.media > div.ocr-img > img#image-ocb533 div.col > div.media > div.ocr-img > img#image-ocb533 | /is/image/microsoftcorp/3218600_Thumbnail_InteractiveDemo... |
div.card__media > div.media > div.ocr-img > img#image-oc126d div.card__media > div.media > div.ocr-img > img#image-oc126d | /is/image/microsoftcorp/1072651-Overview-01-416x178?resMo... |
div.card__media > div.media > div.ocr-img > img#image-ocaec5 div.card__media > div.media > div.ocr-img > img#image-ocaec5 | /is/image/microsoftcorp/1072651-Overview-03-416x178?resMo... |
div.card__media > div.media > div.ocr-img > img#image-oc58dd div.card__media > div.media > div.ocr-img > img#image-oc58dd | /is/image/microsoftcorp/1072651-Overview-02-304x131?resMo... |
div.card__media > div.media > div.ocr-img > img div.card__media > div.media > div.ocr-img > img | /is/image/microsoftcorp/1072651-Overview-02-416x178?resMo... |
div.theme-light > div.c-uhfh-gcontainer-st > a#uhfLogo > img.c-image div.theme-light > div.c-uhfh-gcontainer-st > a#uhfLogo > img.c-image | uhf.microsoft.com/images/microsoft/RE1Mu3b.png |
More information about the performance of your application. These numbers don't directly affect the Performance score.
These checks highlight opportunities to improve the accessibility of your web app. Automatic detection can only detect a subset of issues and does not guarantee the accessibility of your web app, so manual testing is also encouraged.
A value greater than 0 implies an explicit navigation ordering. Although technically valid, this often creates frustrating experiences for users who rely on assistive technologies. Learn more about the `tabindex` attribute.
Performance issues directly impact user engagement and conversion rates.
| Failing Elements |
|---|
Overslaan naar hoofdinhoud div#headerArea > div#headerRegion > div#headerUniversalHeader > a#uhfSkipToMain |
Microsoft header.c-uhfh > div.theme-light > div.c-uhfh-gcontainer-st > a#uhfLogo |
Microsoft 365 div.theme-light > div.c-uhfh-gcontainer-st > div.cat-logo-button-cont > button#uhfCatLogoButton |
Zoeken in Microsoft 365 div.c-uhfh-gcontainer-st > div.c-uhfh-actions > form#searchForm > button#search |
These are opportunities to improve keyboard navigation in your application.
Visible text labels that do not match the accessible name can result in a confusing experience for screen reader users. Learn more about accessible names.
Performance issues directly impact user engagement and conversion rates.
| Failing Elements |
|---|
Beheercentrum div.block-heading > div.block-heading__button-group > div.button-group > a#action-ocfca5 |
Bekijk alles div.layout__col > div.section-master__layout-slot > div.action > a#action-oc5226 |
Lees meer over het opzeggen van je Microsoft 365-abonnement div.footnote-item > div.footnote__item > div.footnote__item-text > a.ms-rte-link |
Meer informatie over gegevensretentie, -verwijdering en -vernietiging in Micros… div.footnote-item > div.footnote__item > div.footnote__item-text > a.ms-rte-link |
Deprecated APIs will eventually be removed from the browser. Learn more about deprecated APIs.
Performance issues directly impact user engagement and conversion rates.
| Deprecation / Warning | Source |
|---|---|
| Unload event listeners are deprecated and will be removed. | |
| Specifying overflow: visible on img, video and canvas tags may cause them to produce visual content outside of the element bounds. See https://github.com/WICG/shared-element-transitions/blob/main/debugging_overflow_on_images.md. | /onerfstatics/marketingsites-neu-prod/shell/_scrf/js/them... line 4, col 11496 |
Errors logged to the console indicate unresolved problems. They can come from network request failures and other browser concerns. Learn more about this errors in console diagnostic audit
Performance issues directly impact user engagement and conversion rates.
| Source | Description |
|---|---|
SyntaxError: Identifier 'LocalStorageUtil' has already been declared | |
SyntaxError: Identifier 'LocalStorageUtil' has already been declared |
Issues logged to the `Issues` panel in Chrome Devtools indicate unresolved problems. They can come from network request failures, insufficient security controls, and other browser concerns. Open up the Issues panel in Chrome DevTools for more details on each issue.
Performance issues directly impact user engagement and conversion rates.
| Issue type |
|---|
| Cookie |
Source maps translate minified code to the original source code. This helps developers debug in production. In addition, Lighthouse is able to provide further insights. Consider deploying source maps to take advantage of these benefits. Learn more about source maps.
Performance issues directly impact user engagement and conversion rates.
These checks ensure that your page is following basic search engine optimization advice. There are many additional factors Lighthouse does not score here that may affect your search ranking, including performance on Core Web Vitals. Learn more about Google Search Essentials.
Search engines may use `href` attributes on links to crawl websites. Ensure that the `href` attribute of anchor elements links to an appropriate destination, so more pages of the site can be discovered. Learn how to make links crawlable
Performance issues directly impact user engagement and conversion rates.
| Uncrawlable Link |
|---|
Overslaan naar hoofdinhoud div#headerArea > div#headerRegion > div#headerUniversalHeader > a#uhfSkipToMain |
Terug naar carrousel-besturing div.carousel > div#carousel-ocf28a > section.carousel__section > a.carousel__back-to-controls |
Terug naar sectie Resources div.carousel > div#carousel-oc1dad > section.carousel__section > a.carousel__back-to-controls |
Terug naar sectie Microsoft 365-apps div.carousel > div#carousel-ocb495 > section.carousel__section > a.carousel__back-to-controls |
To appear in search results, crawlers need access to your app.
Industry-standard audits powered by Google Lighthouse. — Desktop
Key metrics that affect user experience. — Desktop
First Contentful Paint First Contentful Paint — how long until the browser renders the first piece of content. Under 1.8s is good.
2.37 s
Largest Contentful Paint Largest Contentful Paint — how long until the largest visible element loads. Under 2.5s is good.
4.18 s
Total Blocking Time Total Blocking Time — total time the main thread was blocked, preventing user input. Under 200ms is good.
775 ms
Cumulative Layout Shift Cumulative Layout Shift — measures visual stability. How much the page layout shifts during loading. Under 0.1 is good.
0.071
Speed Index Speed Index — how quickly content is visually displayed during load. Under 3.4s is good.
3.22 s
Time to Interactive Time to Interactive — how long until the page is fully interactive and responds to user input. Under 3.8s is good.
7.24 s
Audit breakdown by category with detailed findings.
Remove large, duplicate JavaScript modules from bundles to reduce unnecessary bytes consumed by network activity.
Performance issues directly impact user engagement and conversion rates.
Polyfills and transforms enable older browsers to use new JavaScript features. However, many aren't necessary for modern browsers. Consider modifying your JavaScript build process to not transpile Baseline features, unless you know you must support older browsers. Learn why most sites can deploy ES6+ code without transpiling
Shipping ES5 transpiled code to modern browsers wastes bytes — every user with an evergreen browser pays for compatibility you don't need.
Most users today run browsers that natively support ES6+, async/await, optional chaining, and the rest of modern JavaScript. Transpiling to ES5 'just in case' adds 20-40% to your bundle for no benefit. Configure your build to target a modern browserslist, or ship a differential bundle pair (modern + legacy) with the module/nomodule pattern.
Source: Google web.dev / Lighthouse
3rd party code can significantly impact load performance. Reduce and defer loading of 3rd party code to prioritize your page's content.
Performance issues directly impact user engagement and conversion rates.
A long cache lifetime can speed up repeat visits to your page. Learn more about caching.
Performance issues directly impact user engagement and conversion rates.
Your first network request is the most important. Reduce its latency by avoiding redirects, ensuring a fast server response, and enabling text compression.
Performance issues directly impact user engagement and conversion rates.
Consider setting font-display to swap or optional to ensure text is consistently visible. swap can be further optimized to mitigate layout shifts with font metric overrides.
Performance issues directly impact user engagement and conversion rates.
A forced reflow occurs when JavaScript queries geometric properties (such as offsetWidth) after styles have been invalidated by a change to the DOM state. This can result in poor performance. Learn more about forced reflows and possible mitigations.
Performance issues directly impact user engagement and conversion rates.
Optimize LCP by making the LCP image discoverable from the HTML immediately, and avoiding lazy-loading
Performance issues directly impact user engagement and conversion rates.
Avoid chaining critical requests by reducing the length of chains, reducing the download size of resources, or deferring the download of unnecessary resources to improve page load.
Performance issues directly impact user engagement and conversion rates.
Requests are blocking the page's initial render, which may delay LCP. Deferring or inlining can move these network requests out of the critical path.
Performance issues directly impact user engagement and conversion rates.
Reducing the download time of images can improve the perceived load time of the page and LCP. Learn more about optimizing image size
Performance issues directly impact user engagement and conversion rates.
| URL | Resource Size | Est Savings | |
|---|---|---|---|
div.section-master__image > div.ocr-img > picture > img div.section-master__image > div.ocr-img > picture > img | /is/image/microsoftcorp/1072651-HeroBG-1600x616?resMode=s... | 592.3 KiB | 433.9 KiB |
div > div.media > div.ocr-img > img#image-oc323d div > div.media > div.ocr-img > img#image-oc323d | /is/image/microsoftcorp/1072651-Vertical-Accordian-4.4-80... | 237.7 KiB | 183.0 KiB |
div.card__media > div.media > div.ocr-img > img#image-oc126d div.card__media > div.media > div.ocr-img > img#image-oc126d | /is/image/microsoftcorp/1072651-Overview-01-416x178?resMo... | 146.8 KiB | 123.3 KiB |
div.card__media > div.media > div.ocr-img > img div.card__media > div.media > div.ocr-img > img | /is/image/microsoftcorp/1072651-Overview-02-416x178?resMo... | 122.8 KiB | 99.3 KiB |
div.card__media > div.media > div.ocr-img > img#image-ocaec5 div.card__media > div.media > div.ocr-img > img#image-ocaec5 | /is/image/microsoftcorp/1072651-Overview-03-416x178?resMo... | 119.5 KiB | 96.1 KiB |
div.card__media > div.media > div.ocr-img > img#image-oc58dd div.card__media > div.media > div.ocr-img > img#image-oc58dd | /is/image/microsoftcorp/1072651-Overview-02-304x131?resMo... | 93.7 KiB | 70.3 KiB |
div.section-master > div.section-master__image > div.ocr-img > img div.section-master > div.section-master__image > div.ocr-img > img | /is/image/microsoftcorp/1044018-templates-bg-1600x1172?re... | 51.8 KiB | 26.7 KiB |
div.col > div.media > div.ocr-img > img#image-ocb533 div.col > div.media > div.ocr-img > img#image-ocb533 | /is/image/microsoftcorp/3218600_Thumbnail_InteractiveDemo... | 114.8 KiB | 23.2 KiB |
These insights are also available in the Chrome DevTools Performance Panel - record a trace to view more detailed information.
The maximum potential First Input Delay that your users could experience is the duration of the longest task. Learn more about the Maximum Potential First Input Delay metric.
Performance issues directly impact user engagement and conversion rates.
Redirects introduce additional delays before the page can be loaded. Learn how to avoid page redirects.
Performance issues directly impact user engagement and conversion rates.
Time to Interactive is the amount of time it takes for the page to become fully interactive. Learn more about the Time to Interactive metric.
Performance issues directly impact user engagement and conversion rates.
Minifying JavaScript files can reduce payload sizes and script parse time. Learn how to minify JavaScript.
Performance issues directly impact user engagement and conversion rates.
| URL | Transfer Size | Est Savings |
|---|---|---|
| /golf/etc.clientlibs/microsoft/components/structure/page/... | 552.2 KiB | 504.0 KiB |
| /golf/etc.clientlibs/onecloud/clientlibs/clientlib-mwf-ne... | 86.6 KiB | 36.7 KiB |
| /golf/etc.clientlibs/onecloud/clientlibs/clientlib-produc... | 23.2 KiB | 13.6 KiB |
| /etc.clientlibs/onecloud/clientlibs/clientlib-product-pri... | 23.2 KiB | 13.6 KiB |
| /etc.clientlibs/onecloud/clientlibs/clientlib-product-pri... | 23.2 KiB | 13.6 KiB |
| /etc.clientlibs/onecloud/clientlibs/clientlib-product-pri... | 23.2 KiB | 13.6 KiB |
| /etc.clientlibs/onecloud/clientlibs/clientlib-product-pri... | 23.2 KiB | 13.6 KiB |
| /golf/etc.clientlibs/onecloud/clientlibs/clientlib-cookie... | 4.8 KiB | 2.8 KiB |
| /golf/etc.clientlibs/cascade.component.authoring/clientli... | 5.0 KiB | 2.5 KiB |
Reduce unused rules from stylesheets and defer CSS not used for above-the-fold content to decrease bytes consumed by network activity. Learn how to reduce unused CSS.
Performance issues directly impact user engagement and conversion rates.
| URL | Transfer Size | Est Savings |
|---|---|---|
| /golf/etc.clientlibs/onecloud/clientlibs/clientlib-reimag... | 99.3 KiB | 78.1 KiB |
| /golf/etc.clientlibs/onecloud/clientlibs/clientlib-mwf-ne... | 39.6 KiB | 37.9 KiB |
| /onerfstatics/marketingsites-neu-prod/west-european/shell... | 22.3 KiB | 20.4 KiB |
| .mectrl_resetStyle,a.mectrl_resetStyle,button.mectrl_resetStyle{height:auto;min-width:auto; … } … | 15.2 KiB | 14.9 KiB |
| .mectrl_resetStyle,a.mectrl_resetStyle,button.mectrl_resetStyle{height:auto;min-width:auto; … } … | 10.3 KiB | 10.2 KiB |
Reduce unused JavaScript and defer loading scripts until they are required to decrease bytes consumed by network activity. Learn how to reduce unused JavaScript.
Multi-megabyte JavaScript bundles delay every interactive feature on the page.
This is the Lighthouse audit fired when too much JS is shipped relative to what executes. The fix isn't a config flag — it requires bundle analysis (webpack-bundle-analyzer, rollup-plugin-visualizer), splitting routes into chunks, lazy-loading off-screen components, and removing unused dependencies. Fundamentally different from minification: minifying reduces byte count, this reduces what's downloaded at all.
Source: Google web.dev / Lighthouse
| URL | Transfer Size | Est Savings |
|---|---|---|
| www.microsoft.com/videoplayer/ump.mjs | 348.4 KiB | 245.6 KiB |
| /golf/etc.clientlibs/onecloud/clientlibs/clientlib-reimag... | 149.1 KiB | 103.2 KiB |
| /golf/etc.clientlibs/onecloud/clientlibs/clientlib-mwf-ne... | 86.6 KiB | 53.6 KiB |
| /golf/etc.clientlibs/cascade.component.authoring/clientli... | 68.2 KiB | 40.9 KiB |
| www.microsoft.com/msonecloudapi/assets/msochead.js | 44.6 KiB | 28.0 KiB |
| /onerfstatics/marketingsites-neu-prod/shell/_scrf/js/them... | 36.3 KiB | 21.6 KiB |
| www.microsoft.com/msonecloudapi/assets/msocbody.js | 40.1 KiB | 20.5 KiB |
Consider reducing the time spent parsing, compiling, and executing JS. You may find delivering smaller JS payloads helps with this. Learn how to reduce Javascript execution time.
Performance issues directly impact user engagement and conversion rates.
| URL | Total CPU Time | Script Evaluation | Script Parse |
|---|---|---|---|
| /golf/etc.clientlibs/onecloud/clientlibs/clientlib-mwf-ne... | 1.6 s | 131 ms | 20 ms |
| /nl-nl/microsoft-365/sharepoint/collaboration?ms.officeur... | 1.1 s | 110 ms | 12 ms |
| /golf/etc.clientlibs/onecloud/clientlibs/clientlib-reimag... | 949 ms | 128 ms | 31 ms |
| Unattributable | 431 ms | 2.9 ms | 0.0 ms |
| /golf/etc.clientlibs/microsoft/components/structure/page/... | 344 ms | 170 ms | 123 ms |
| /onerfstatics/marketingsites-neu-prod/shell/_scrf/js/them... | 196 ms | 62 ms | 6.1 ms |
| www.microsoft.com/videoplayer/ump.mjs | 138 ms | 101 ms | 2.5 ms |
| /golf/etc.clientlibs/onecloud/components/content/market-s... | 123 ms | 118 ms | 1.0 ms |
| /golf/etc.clientlibs/onecloud/clientlibs/clientlib-chat.A... | 87 ms | 78 ms | 4.6 ms |
| www.microsoft.com/msonecloudapi/assets/msochead.js | 83 ms | 71 ms | 6.7 ms |
| mem.gfx.ms/scripts/me/MeControl/10.25136.1/nl-NL/meBoot.min.js | 58 ms | 35 ms | 11 ms |
| /golf/etc.clientlibs/cascade.component.authoring/clientli... | 55 ms | 55 ms | 0.0 ms |
| /golf/etc.clientlibs/cascade.component.authoring/clientli... | 54 ms | 43 ms | 11 ms |
Consider reducing the time spent parsing, compiling and executing JS. You may find delivering smaller JS payloads helps with this. Learn how to minimize main-thread work
Performance issues directly impact user engagement and conversion rates.
| Category | Time Spent |
|---|---|
| Style & Layout | 3.0 s |
| Script Evaluation | 1.3 s |
| Other | 686 ms |
| Script Parsing & Compilation | 312 ms |
| Parse HTML & CSS | 151 ms |
| Rendering | 85 ms |
| Garbage Collection | 12 ms |
Many navigations are performed by going back to a previous page, or forwards again. The back/forward cache (bfcache) can speed up these return navigations. Learn more about the bfcache
Performance issues directly impact user engagement and conversion rates.
| Failure reason | Failure type |
|---|---|
| The page has an unload handler in the main frame. | Actionable |
Large network payloads cost users real money and are highly correlated with long load times. Learn how to reduce payload sizes.
Performance issues directly impact user engagement and conversion rates.
Set an explicit width and height on image elements to reduce layout shifts and improve CLS. Learn how to set image dimensions
Performance issues directly impact user engagement and conversion rates.
| URL | |
|---|---|
div > div.media > div.ocr-img > img#image-oc323d div > div.media > div.ocr-img > img#image-oc323d | /is/image/microsoftcorp/1072651-Vertical-Accordian-4.4-80... |
div.col > div.media > div.ocr-img > img#image-ocb533 div.col > div.media > div.ocr-img > img#image-ocb533 | /is/image/microsoftcorp/3218600_Thumbnail_InteractiveDemo... |
div.card__media > div.media > div.ocr-img > img#image-oc126d div.card__media > div.media > div.ocr-img > img#image-oc126d | /is/image/microsoftcorp/1072651-Overview-01-416x178?resMo... |
div.card__media > div.media > div.ocr-img > img#image-ocaec5 div.card__media > div.media > div.ocr-img > img#image-ocaec5 | /is/image/microsoftcorp/1072651-Overview-03-416x178?resMo... |
div.card__media > div.media > div.ocr-img > img#image-oc58dd div.card__media > div.media > div.ocr-img > img#image-oc58dd | /is/image/microsoftcorp/1072651-Overview-02-304x131?resMo... |
div.card__media > div.media > div.ocr-img > img div.card__media > div.media > div.ocr-img > img | /is/image/microsoftcorp/1072651-Overview-02-416x178?resMo... |
div.theme-light > div.c-uhfh-gcontainer-st > a#uhfLogo > img.c-image div.theme-light > div.c-uhfh-gcontainer-st > a#uhfLogo > img.c-image | uhf.microsoft.com/images/microsoft/RE1Mu3b.png |
More information about the performance of your application. These numbers don't directly affect the Performance score.
These checks highlight opportunities to improve the accessibility of your web app. Automatic detection can only detect a subset of issues and does not guarantee the accessibility of your web app, so manual testing is also encouraged.
Visible text labels that do not match the accessible name can result in a confusing experience for screen reader users. Learn more about accessible names.
Performance issues directly impact user engagement and conversion rates.
| Failing Elements |
|---|
Beheercentrum div.block-heading > div.block-heading__button-group > div.button-group > a#action-ocfca5 |
Bekijk alles div.layout__col > div.section-master__layout-slot > div.action > a#action-oc5226 |
Lees meer over het opzeggen van je Microsoft 365-abonnement div.footnote-item > div.footnote__item > div.footnote__item-text > a.ms-rte-link |
Meer informatie over gegevensretentie, -verwijdering en -vernietiging in Micros… div.footnote-item > div.footnote__item > div.footnote__item-text > a.ms-rte-link |
Deprecated APIs will eventually be removed from the browser. Learn more about deprecated APIs.
Performance issues directly impact user engagement and conversion rates.
| Deprecation / Warning | Source |
|---|---|
| Unload event listeners are deprecated and will be removed. | |
| Specifying overflow: visible on img, video and canvas tags may cause them to produce visual content outside of the element bounds. See https://github.com/WICG/shared-element-transitions/blob/main/debugging_overflow_on_images.md. | /onerfstatics/marketingsites-neu-prod/shell/_scrf/js/them... line 4, col 11496 |
Errors logged to the console indicate unresolved problems. They can come from network request failures and other browser concerns. Learn more about this errors in console diagnostic audit
Performance issues directly impact user engagement and conversion rates.
| Source | Description |
|---|---|
SyntaxError: Identifier 'LocalStorageUtil' has already been declared | |
SyntaxError: Identifier 'LocalStorageUtil' has already been declared |
Issues logged to the `Issues` panel in Chrome Devtools indicate unresolved problems. They can come from network request failures, insufficient security controls, and other browser concerns. Open up the Issues panel in Chrome DevTools for more details on each issue.
Performance issues directly impact user engagement and conversion rates.
| Issue type |
|---|
| Cookie |
Source maps translate minified code to the original source code. This helps developers debug in production. In addition, Lighthouse is able to provide further insights. Consider deploying source maps to take advantage of these benefits. Learn more about source maps.
Performance issues directly impact user engagement and conversion rates.
These checks ensure that your page is following basic search engine optimization advice. There are many additional factors Lighthouse does not score here that may affect your search ranking, including performance on Core Web Vitals. Learn more about Google Search Essentials.
Search engines may use `href` attributes on links to crawl websites. Ensure that the `href` attribute of anchor elements links to an appropriate destination, so more pages of the site can be discovered. Learn how to make links crawlable
Performance issues directly impact user engagement and conversion rates.
| Uncrawlable Link |
|---|
Overslaan naar hoofdinhoud div#headerArea > div#headerRegion > div#headerUniversalHeader > a#uhfSkipToMain |
Terug naar carrousel-besturing div.carousel > div#carousel-ocf28a > section.carousel__section > a.carousel__back-to-controls |
Terug naar sectie Resources div.carousel > div#carousel-oc1dad > section.carousel__section > a.carousel__back-to-controls |
Terug naar sectie Microsoft 365-apps div.carousel > div#carousel-ocb495 > section.carousel__section > a.carousel__back-to-controls |
To appear in search results, crawlers need access to your app.
Send Feedback