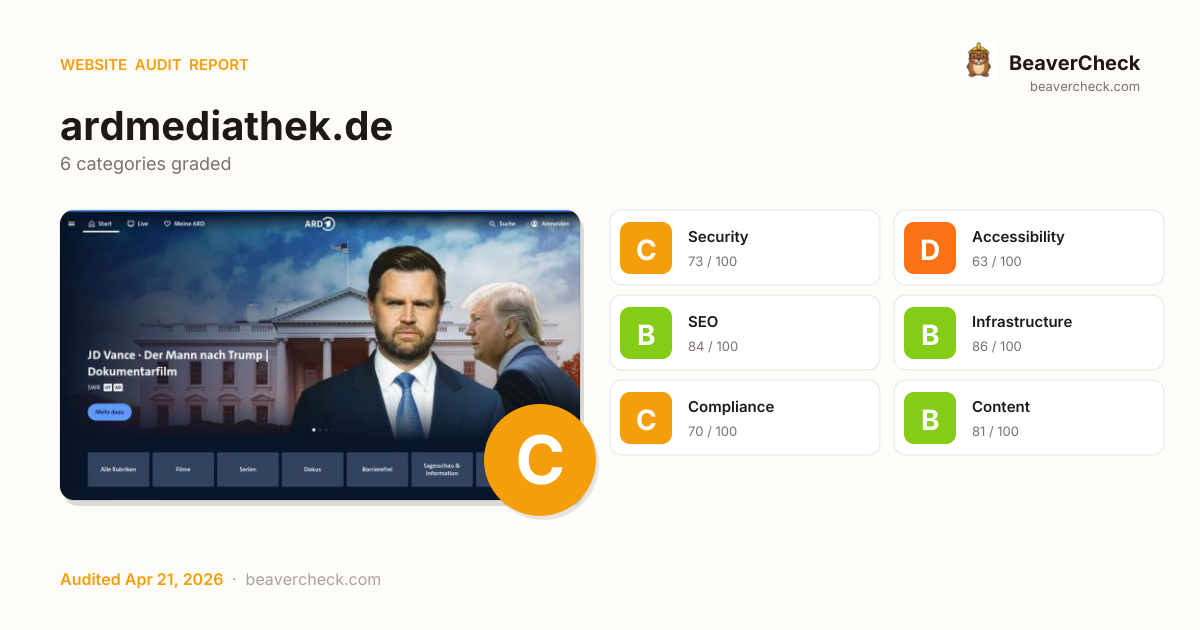
Audit overview
Compliance needs attention; the rest of the categories are in good shape.
Fix Priority Matrix
5 findingsQuick Wins
3High impact, low effort — start here.
Strategic
2High impact, requires investment.
Easy Improvements
0Small gains, minimal effort.
Nothing in this quadrant — good news.
Deprioritize
0Low impact, high effort — do last.
Nothing in this quadrant — good news.
Screenshots


Top Priorities (5)
Content-Security-Policy header is missing
Without a CSP, a single XSS bug can exfiltrate everything your users type — including credentials.
HSTS header is missing
Without HSTS, a network attacker can downgrade the very first connection to HTTP and steal the user's session.
10 button(s) with no accessible text
Buttons with no accessible text (icon-only, no aria-label) can't be activated by voice control or understood by screen readers.
17 image(s) missing alt attribute
Each image without alt text is a WCAG 1.1.1 failure — invisible to screen-reader users, lost from Google Image Search.
17 image-in-link without alt text
Image-only links with no alt create empty links — screen-reader users hear 'link' with no destination context.
Unique monthly visitors from your analytics
Purchases, signups, or key actions
Optional — for revenue estimation
more engaged visitors from reduced bounce
Fix 5 critical issues to capture this value
How this is calculated
Based on Google/Deloitte research ("Milliseconds Make Millions") showing a ~7% bounce rate increase per additional second of LCP above the 2.5s "Good" threshold.
Your site's LCP: → estimated after fixes.
These are estimates based on industry research — actual results vary
Your data stays in your browser — nothing is sent to our servers
Lighthouse
Mobile
First Contentful Paint First Contentful Paint — how long until the browser renders the first piece of content. Under 1.8s is good.
2.25 s
Largest Contentful Paint Largest Contentful Paint — how long until the largest visible element loads. Under 2.5s is good.
2.25 s
Total Blocking Time Total Blocking Time — total time the main thread was blocked, preventing user input. Under 200ms is good.
869 ms
Cumulative Layout Shift Cumulative Layout Shift — measures visual stability. How much the page layout shifts during loading. Under 0.1 is good.
0.010
Speed Index Speed Index — how quickly content is visually displayed during load. Under 3.4s is good.
3.13 s
Time to Interactive Time to Interactive — how long until the page is fully interactive and responds to user input. Under 3.8s is good.
7.23 s
Desktop
First Contentful Paint First Contentful Paint — how long until the browser renders the first piece of content. Under 1.8s is good.
987 ms
Largest Contentful Paint Largest Contentful Paint — how long until the largest visible element loads. Under 2.5s is good.
987 ms
Total Blocking Time Total Blocking Time — total time the main thread was blocked, preventing user input. Under 200ms is good.
63 ms
Cumulative Layout Shift Cumulative Layout Shift — measures visual stability. How much the page layout shifts during loading. Under 0.1 is good.
0.017
Speed Index Speed Index — how quickly content is visually displayed during load. Under 3.4s is good.
1.23 s
Time to Interactive Time to Interactive — how long until the page is fully interactive and responds to user input. Under 3.8s is good.
2.14 s
Categories
8Performance
All checks pass
Security
Content-Security-Policy header is missing
Accessibility
10 button(s) with no accessible text
SEO
All checks pass
Infrastructure
All checks pass
Compliance
All checks pass
Content
All checks pass
Sustainability
All checks pass
How you compare
Where this site stands against peers running the same stack.
Top 10% of core-js sites score 96+ on SEO; you're at 84 — closing this gap is the highest-leverage improvement.
Top 10% of Facebook sites score 85+ on Compliance; you're at 72 — closing this gap is the highest-leverage improvement.
Technology stack
Stack Architecture
 HTTP/3
  Open Graph
  React
React  React Router 6
 Swiper
  core-js 3.46.0
All Detected Technologies (8)
HTTP/3 is the third major version of the Hypertext Transfer Protocol used to exchange information on the World Wide Web.
Open Graph is a protocol that is used to integrate any web page into the social graph.
React is an open-source JavaScript library for building user interfaces or UI components.
React Router provides declarative routing for React.
Swiper is a JavaScript library that creates modern touch sliders with hardware-accelerated transitions.
core-js is a modular standard library for JavaScript, with polyfills for cutting-edge ECMAScript features.
Observations (2)
No build tool detected
A framework (Facebook) was detected but no bundler was identified. The build tool may not be detectable from output patterns, or the site may use the framework's built-in bundler.
Complex technology stack detected
8 technologies identified. A complex stack increases maintenance burden and attack surface. Consider whether all components are actively needed.
Show your score
Drop this badge on your README, marketing site, or status page. It auto-updates every time the audit re-runs and links back to this report.

This badge auto-updates with your latest scan result.
[](https://beavercheck.com/sites/ardmediathek.de)<a href="https://beavercheck.com/sites/ardmediathek.de"><img src="https://beavercheck.com/badge?url=https%3A%2F%2Fardmediathek.de" alt="BeaverCheck Score"></a>https://beavercheck.com/badge?url=https%3A%2F%2Fardmediathek.deExport & share
Download the audit, share with your team, or grab a fix plan ready to copy into your tracker.