Spain · Madrid Completed: Apr 7, 2026 20:15 UTC
Mobile 375 × 812

Desktop 1440 × 900
Score: 79 / 100
Based on 8 categories, 0 sections
The overall score is a weighted average of individual category scores. Categories with more impact on user experience and security carry more weight.
Weights reflect general web best practices. Individual needs may differ.
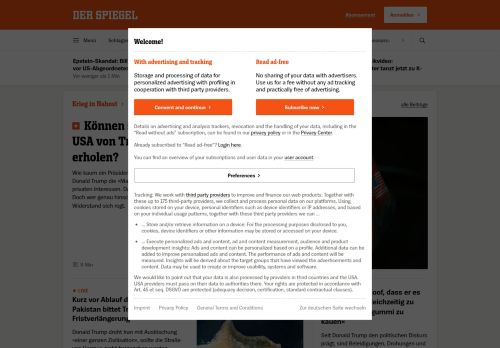
1 link(s) with no accessible text
2 control(s) without accessible label
219 image-only link(s) without alt text
43 button(s) with no accessible text
No H1 heading found
[](https://beavercheck.com/results/a90ea7d8-0906-3cc5-b076-7316d53a50be)<a href="https://beavercheck.com/results/a90ea7d8-0906-3cc5-b076-7316d53a50be"><img src="https://beavercheck.com/badge?url=https%3A%2F%2Fwww.spiegel.de" alt="BeaverCheck Score"></a>https://beavercheck.com/badge?url=https%3A%2F%2Fwww.spiegel.deThis badge auto-updates with your latest scan result.
Thanks for your feedback!
Industry-standard audits powered by Google Lighthouse.
Key metrics that affect user experience.
First Contentful Paint First Contentful Paint — how long until the browser renders the first piece of content. Under 1.8s is good.
3.47 s
Largest Contentful Paint Largest Contentful Paint — how long until the largest visible element loads. Under 2.5s is good.
5.34 s
Total Blocking Time Total Blocking Time — total time the main thread was blocked, preventing user input. Under 200ms is good.
774 ms
Cumulative Layout Shift Cumulative Layout Shift — measures visual stability. How much the page layout shifts during loading. Under 0.1 is good.
0.000
Speed Index Speed Index — how quickly content is visually displayed during load. Under 3.4s is good.
3.47 s
Time to Interactive Time to Interactive — how long until the page is fully interactive and responds to user input. Under 3.8s is good.
11.01 s
Audit breakdown by category with detailed findings.
Remove large, duplicate JavaScript modules from bundles to reduce unnecessary bytes consumed by network activity.
Polyfills and transforms enable older browsers to use new JavaScript features. However, many aren't necessary for modern browsers. Consider modifying your JavaScript build process to not transpile Baseline features, unless you know you must support older browsers. Learn why most sites can deploy ES6+ code without transpiling
3rd party code can significantly impact load performance. Reduce and defer loading of 3rd party code to prioritize your page's content.
Reducing the download time of images can improve the perceived load time of the page and LCP. Learn more about optimizing image size
| URL | Resource Size | Est Savings | |
|---|---|---|---|
a > div.relative > picture > img.rounded a > div.relative > picture > img.rounded | /images/492ca17f-a43d-4e60-8296-28c8785610d8_w1040_r1.33_... | 60.6 KiB | 31.5 KiB |
Avoid chaining critical requests by reducing the length of chains, reducing the download size of resources, or deferring the download of unnecessary resources to improve page load.
A long cache lifetime can speed up repeat visits to your page. Learn more about caching.
| Request | Cache TTL | Transfer Size |
|---|---|---|
| assets.adobedtm.com/cc10f7b4369d/32ae8c3350c5/launch-8a2e39fde471.min.js | 3600.0 s | 118.3 KiB |
| sp-spiegel-de.spiegel.de/Notice.8f529.js | 3600.0 s | 91.2 KiB |
| sp-spiegel-de.spiegel.de/unified/wrapperMessagingWithoutDetection.js | 3600.0 s | 41.9 KiB |
| sp-spiegel-de.spiegel.de/Notice.30929.css | 3600.0 s | 6.7 KiB |
| sp-spiegel-de.spiegel.de/polyfills.01516.js | 3600.0 s | 2.3 KiB |
| /cc10f7b4369d/32ae8c3350c5/faf63fc4e267/RC0118948576ac4d6... | 3600.0 s | 538 B |
These insights are also available in the Chrome DevTools Performance Panel - record a trace to view more detailed information.
Time to Interactive is the amount of time it takes for the page to become fully interactive. Learn more about the Time to Interactive metric.
The maximum potential First Input Delay that your users could experience is the duration of the longest task. Learn more about the Maximum Potential First Input Delay metric.
Reduce unused JavaScript and defer loading scripts until they are required to decrease bytes consumed by network activity. Learn how to reduce unused JavaScript.
| URL | Transfer Size | Est Savings |
|---|---|---|
| sp-spiegel-de.spiegel.de/Notice.8f529.js | 90.9 KiB | 62.9 KiB |
| cdn.prod.www.spiegel.de/public/shared/generated/js/index.bef94a1227f9ba910327.js | 55.0 KiB | 42.2 KiB |
| www.spiegel.de/ | 28.4 KiB | 26.8 KiB |
| assets.adobedtm.com/cc10f7b4369d/32ae8c3350c5/launch-8a2e39fde471.min.js | 118.1 KiB | 24.1 KiB |
Consider reducing the time spent parsing, compiling, and executing JS. You may find delivering smaller JS payloads helps with this. Learn how to reduce Javascript execution time.
| URL | Total CPU Time | Script Evaluation | Script Parse |
|---|---|---|---|
| www.spiegel.de/ | 3.3 s | 216 ms | 52 ms |
| Unattributable | 704 ms | 101 ms | 0.0 ms |
| sp-spiegel-de.spiegel.de/Notice.8f529.js | 635 ms | 489 ms | 34 ms |
| sp-spiegel-de.spiegel.de/unified/wrapperMessagingWithoutDetection.js | 461 ms | 317 ms | 14 ms |
| cdn.prod.www.spiegel.de/public/shared/generated/js/index.bef94a1227f9ba910327.js | 344 ms | 293 ms | 18 ms |
| assets.adobedtm.com/cc10f7b4369d/32ae8c3350c5/launch-8a2e39fde471.min.js | 246 ms | 185 ms | 52 ms |
| /public/shared/generated/js/commons.c0c8da65a3f202a0f54c.js | 119 ms | 103 ms | 11 ms |
| /public/shared/generated/js/header.a8fe52f48a8d879860e4.js | 79 ms | 67 ms | 2.3 ms |
| /prod.iqdcontroller.iqdigital/cdn_iqdspiegel_mob/live/iqa... | 66 ms | 28 ms | 38 ms |
| /public/shared/generated/js/vendors.f1c4f8bff0ebc606b86f.js | 59 ms | 13 ms | 9.2 ms |
| sp-spiegel-de.spiegel.de/unified/4.40.1/gdpr-tcf.27718c8cb9d29947d2c1.bundle.js | 56 ms | 42 ms | 13 ms |
Consider reducing the time spent parsing, compiling and executing JS. You may find delivering smaller JS payloads helps with this. Learn how to minimize main-thread work
| Category | Time Spent |
|---|---|
| Other | 1.9 s |
| Script Evaluation | 1.9 s |
| Style & Layout | 1.2 s |
| Rendering | 465 ms |
| Parse HTML & CSS | 395 ms |
| Script Parsing & Compilation | 248 ms |
| Garbage Collection | 57 ms |
Reduce unused rules from stylesheets and defer CSS not used for above-the-fold content to decrease bytes consumed by network activity. Learn how to reduce unused CSS.
| URL | Transfer Size | Est Savings |
|---|---|---|
| @font-face { font-family: SpiegelSlabCdUI; font-weight: 800; font-display: auto; src: url(d… | 65.2 KiB | 64.7 KiB |
| /public/spon/generated/css/styles.5bb336b1851727164f63.css | 20.3 KiB | 17.1 KiB |
More information about the performance of your application. These numbers don't directly affect the Performance score.
These checks highlight opportunities to improve the accessibility of your web app. Automatic detection can only detect a subset of issues and does not guarantee the accessibility of your web app, so manual testing is also encouraged.
Low-contrast text is difficult or impossible for many users to read. Learn how to provide sufficient color contrast.
| Failing Elements |
|---|
Abo div.mx-auto > div.flex > a.font-bold > span.lg:hidden |
LIVE a.text-black > span.flex > span.text-black > span.inline-flex |
Diskutieren Sie hier div.flex > div.lg:w-10/12 > a.inline-flex > span.text-s |
LIVE h2.lg:grow > a.text-black > span.text-black > span.inline-flex |
Diskutieren Sie hier div.flex > div.lg:w-10/12 > a.inline-flex > span.text-s |
Unsere Kolumnistinnen und Kolumnisten div.relative > section.relative > div.relative > div.text-primary-base |
Jetzt registrieren div.lg:py-24 > div.lg:ml-24 > a.inline-flex > span.text-s |
These are opportunities to improve the legibility of your content.
Touch targets with sufficient size and spacing help users who may have difficulty targeting small controls to activate the targets. Learn more about touch targets.
| Failing Elements |
|---|
Cartoon des Tages article.lg:p-24 > div.relative > div.flex > a |
These items highlight common accessibility best practices.
These checks ensure that your page is following basic search engine optimization advice. There are many additional factors Lighthouse does not score here that may affect your search ranking, including performance on Core Web Vitals. Learn more about Google Search Essentials.
Industry-standard audits powered by Google Lighthouse. — Desktop
Key metrics that affect user experience. — Desktop
First Contentful Paint First Contentful Paint — how long until the browser renders the first piece of content. Under 1.8s is good.
907 ms
Largest Contentful Paint Largest Contentful Paint — how long until the largest visible element loads. Under 2.5s is good.
1.19 s
Total Blocking Time Total Blocking Time — total time the main thread was blocked, preventing user input. Under 200ms is good.
71 ms
Cumulative Layout Shift Cumulative Layout Shift — measures visual stability. How much the page layout shifts during loading. Under 0.1 is good.
0.000
Speed Index Speed Index — how quickly content is visually displayed during load. Under 3.4s is good.
1.42 s
Time to Interactive Time to Interactive — how long until the page is fully interactive and responds to user input. Under 3.8s is good.
2.57 s
Audit breakdown by category with detailed findings.
Remove large, duplicate JavaScript modules from bundles to reduce unnecessary bytes consumed by network activity.
Polyfills and transforms enable older browsers to use new JavaScript features. However, many aren't necessary for modern browsers. Consider modifying your JavaScript build process to not transpile Baseline features, unless you know you must support older browsers. Learn why most sites can deploy ES6+ code without transpiling
3rd party code can significantly impact load performance. Reduce and defer loading of 3rd party code to prioritize your page's content.
Avoid chaining critical requests by reducing the length of chains, reducing the download size of resources, or deferring the download of unnecessary resources to improve page load.
A long cache lifetime can speed up repeat visits to your page. Learn more about caching.
| Request | Cache TTL | Transfer Size |
|---|---|---|
| assets.adobedtm.com/cc10f7b4369d/32ae8c3350c5/launch-8a2e39fde471.min.js | 3600.0 s | 118.3 KiB |
| sp-spiegel-de.spiegel.de/Notice.8f529.js | 3600.0 s | 91.2 KiB |
| sp-spiegel-de.spiegel.de/unified/wrapperMessagingWithoutDetection.js | 3600.0 s | 41.9 KiB |
| sp-spiegel-de.spiegel.de/Notice.30929.css | 3600.0 s | 6.7 KiB |
| sp-spiegel-de.spiegel.de/polyfills.01516.js | 3600.0 s | 2.3 KiB |
| /cc10f7b4369d/32ae8c3350c5/faf63fc4e267/RC0118948576ac4d6... | 3600.0 s | 538 B |
These insights are also available in the Chrome DevTools Performance Panel - record a trace to view more detailed information.
Time to Interactive is the amount of time it takes for the page to become fully interactive. Learn more about the Time to Interactive metric.
Consider reducing the time spent parsing, compiling and executing JS. You may find delivering smaller JS payloads helps with this. Learn how to minimize main-thread work
| Category | Time Spent |
|---|---|
| Other | 746 ms |
| Script Evaluation | 593 ms |
| Style & Layout | 342 ms |
| Rendering | 131 ms |
| Parse HTML & CSS | 117 ms |
| Script Parsing & Compilation | 76 ms |
| Garbage Collection | 20 ms |
Reduce unused rules from stylesheets and defer CSS not used for above-the-fold content to decrease bytes consumed by network activity. Learn how to reduce unused CSS.
| URL | Transfer Size | Est Savings |
|---|---|---|
| @font-face { font-family: SpiegelSlabCdUI; font-weight: 800; font-display: auto; src: url(d… | 65.2 KiB | 64.7 KiB |
Reduce unused JavaScript and defer loading scripts until they are required to decrease bytes consumed by network activity. Learn how to reduce unused JavaScript.
| URL | Transfer Size | Est Savings |
|---|---|---|
| sp-spiegel-de.spiegel.de/Notice.8f529.js | 90.9 KiB | 62.9 KiB |
| cdn.prod.www.spiegel.de/public/shared/generated/js/index.bef94a1227f9ba910327.js | 55.0 KiB | 42.2 KiB |
| www.spiegel.de/ | 28.4 KiB | 26.7 KiB |
| assets.adobedtm.com/cc10f7b4369d/32ae8c3350c5/launch-8a2e39fde471.min.js | 118.1 KiB | 24.1 KiB |
More information about the performance of your application. These numbers don't directly affect the Performance score.
These checks highlight opportunities to improve the accessibility of your web app. Automatic detection can only detect a subset of issues and does not guarantee the accessibility of your web app, so manual testing is also encouraged.
Low-contrast text is difficult or impossible for many users to read. Learn how to provide sufficient color contrast.
| Failing Elements |
|---|
Abonnement div.mx-auto > div.flex > a.font-bold > span.sm:hidden |
Anmelden div.flex > span.sm:hidden > a.inline-flex > span.text-s |
LIVE a.group > span.block > span.text-black > span.inline-flex |
LIVE a.text-black > span.flex > span.text-black > span.inline-flex |
Diskutieren Sie hier div.flex > div.lg:w-10/12 > a.inline-flex > span.text-s |
LIVE h2.lg:grow > a.text-black > span.text-black > span.inline-flex |
Diskutieren Sie hier div.flex > div.lg:w-10/12 > a.inline-flex > span.text-s |
Unsere Kolumnistinnen und Kolumnisten div.relative > section.relative > div.relative > div.text-primary-base |
Jetzt registrieren div.lg:py-24 > div.lg:ml-24 > a.inline-flex > span.text-s |
These are opportunities to improve the legibility of your content.
Touch targets with sufficient size and spacing help users who may have difficulty targeting small controls to activate the targets. Learn more about touch targets.
| Failing Elements |
|---|
Cartoon des Tages article.lg:p-24 > div.relative > div.flex > a |
These items highlight common accessibility best practices.
These checks ensure that your page is following basic search engine optimization advice. There are many additional factors Lighthouse does not score here that may affect your search ranking, including performance on Core Web Vitals. Learn more about Google Search Essentials.
Send Feedback