Spain · Madrid Completed: Apr 16, 2026 16:58 UTC
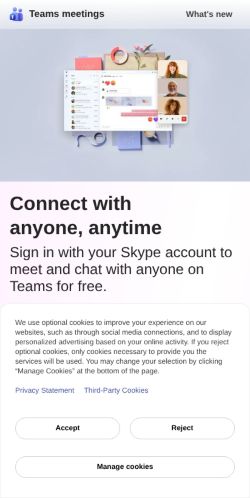
Mobile 375 × 812
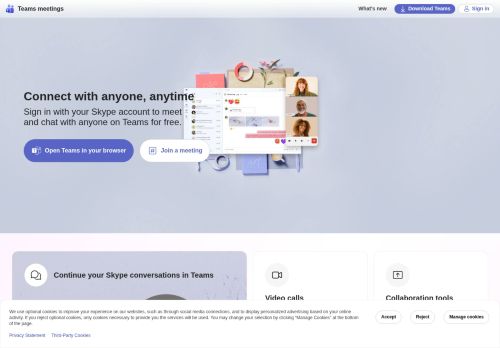
Desktop 1440 × 900
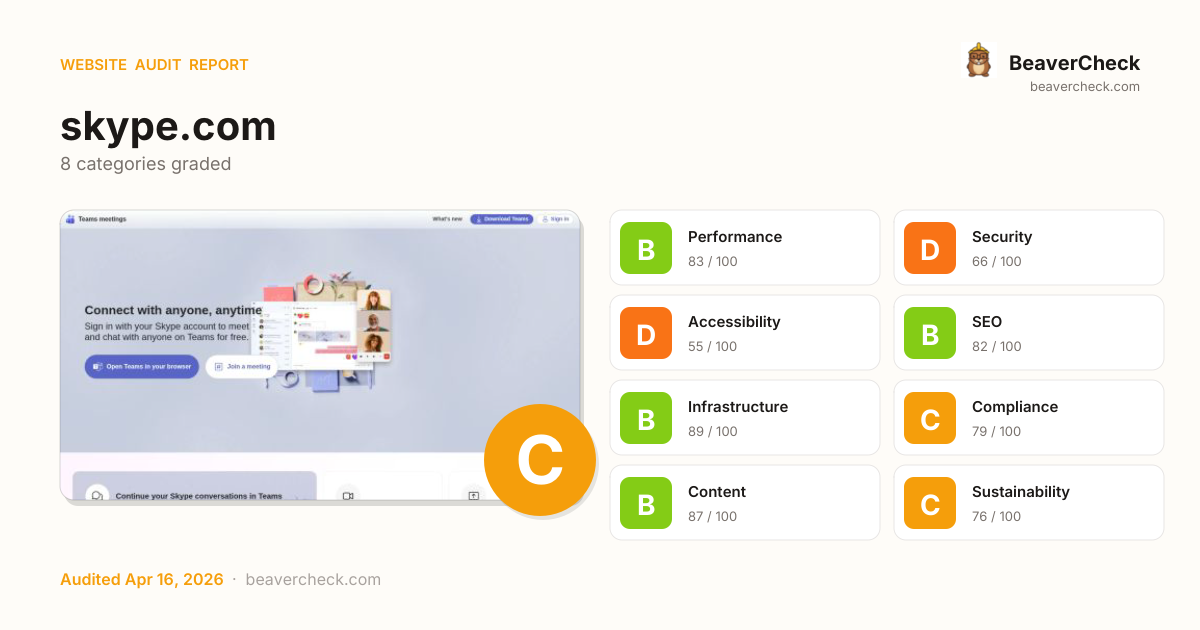
Score: 75 / 100
Based on 8 categories, 0 sections
Decent speed, but optimizing further could improve engagement.
Several missing protections leave your users and data exposed.
Several issues make your site difficult for assistive technology users.
Solid SEO basics — a few optimizations could boost rankings.
Solid infrastructure — fast server responses across the board.
Mostly compliant — a few items need attention.
Rich content metadata — your pages look great everywhere.
Reasonable footprint with room for optimization.
The overall score is a weighted average of individual category scores. Categories with more impact on user experience and security carry more weight.
Weights reflect general web best practices. Individual needs may differ.
Content-Security-Policy header is missing
Security gaps expose your site and users to attacks, eroding trust.
No Content-Security-Policy header found
Security gaps expose your site and users to attacks, eroding trust.
4 image-only link(s) without alt text
Accessibility issues exclude users with disabilities — up to 15% of your potential audience.
Soft 404: server returns HTTP 200 for non-existent pages
Accessibility issues exclude users with disabilities — up to 15% of your potential audience.
34 third-party resources (100% of weight)
Performance issues directly impact user engagement and conversion rates.
High impact, low effort — start here.
High impact, requires investment.
Small gains, minimal effort.
Nothing in this quadrant — good news.
Low impact, high effort — do last.
Nothing in this quadrant — good news.
[](https://beavercheck.com/results/aab94532-72f2-45a0-a369-4ab2ec2a6a6b)<a href="https://beavercheck.com/results/aab94532-72f2-45a0-a369-4ab2ec2a6a6b"><img src="https://beavercheck.com/badge?url=https%3A%2F%2Fskype.com" alt="BeaverCheck Score"></a>https://beavercheck.com/badge?url=https%3A%2F%2Fskype.comThis badge auto-updates with your latest scan result.
Your site performs reasonably well, but a few targeted fixes could meaningfully improve results. Your LCP of 6.8s exceeds Google's 2.5s 'Good' threshold and the 1 performance issue below directly contributes to it. Accessibility issues exclude users who rely on assistive technology — an estimated 15% of your potential audience. Addressing the critical issues below would have the most immediate impact on your user trust.
6 barrier(s) likely increasing bounce by ~24%.
Page takes 6.8s to load
+12% bounceUsers abandon at ~3s — you're 4.3s over the 2.5s threshold
Fix: Optimize render-blocking resources, preload the hero image, and compress images
No HSTS header
+1% bounceReturning visitors are briefly exposed to downgrade attacks on first request
Fix: Set Strict-Transport-Security: max-age=31536000; includeSubDomains
No Content-Security-Policy header
+1% bounceHigher XSS blast radius — one compromised script can exfiltrate the checkout form
Fix: Ship a reporting-only CSP first, then enforce once violations are clean
No structured data
+2% bounceNo rich-result eligibility in Google — lower SERP CTR vs competitors with stars and prices
Fix: Add JSON-LD for your page type (Product, Article, FAQPage, LocalBusiness, …)
Thin content
+3% bounceUnder 300 words — visitors bounce looking for substance, search engines rank competitors first
Fix: Add a substantive FAQ, product detail, or case-study section
No skip-to-content link
+1% bounceKeyboard and screen-reader users must tab through the entire header on every page
Fix: Add a visible-on-focus <a href="#main">Skip to content</a> as the first focusable element
Preliminary CRO audit — each barrier links to the tab with detailed analysis.
$600 investment → $5,097/month returns + USD 157,500 risk avoided
$600
6h · 5 findings
$5,097 /mo
~$61,166 / year
USD 157,500
if kept compliant
$100 — in quick wins — start here for the fastest payback
Figures combine localized regulatory fine ceilings, search/conversion value priced against local CPC, and bandwidth waste estimates. Results depend on implementation quality and audience composition. Not legal or financial advice.
6.0 developer hours at $100/hr
Based on United States rates ($100/hr)
Start here for the best return on investment
$13,126 / month at risk
~$157,507 / year if left unfixed
$157,500
+2 more
$0.54 /mo
6808.4 MB/mo × 0.080 USD/GB
Compliance figures represent the statutory maximum fine for the most severe triggered category, capped per regulation — not the sum of per-finding penalties. Based on published regulatory fine ranges. This is not legal advice.
Unique monthly visitors from your analytics
Purchases, signups, or key actions
Optional — for revenue estimation
more engaged visitors from reduced bounce
Fix 4 critical issues to capture this value
Based on Google/Deloitte research ("Milliseconds Make Millions") showing a ~7% bounce rate increase per additional second of LCP above the 2.5s "Good" threshold.
Your site's LCP: → estimated after fixes.
These are estimates based on industry research — actual results vary
Your data stays in your browser — nothing is sent to our servers
Thanks for your feedback!
We'll use a cached audit if available, or offer to scan.
Industry-standard audits powered by Google Lighthouse.
Key metrics that affect user experience.
First Contentful Paint First Contentful Paint — how long until the browser renders the first piece of content. Under 1.8s is good.
2.86 s
Largest Contentful Paint Largest Contentful Paint — how long until the largest visible element loads. Under 2.5s is good.
6.77 s
Total Blocking Time Total Blocking Time — total time the main thread was blocked, preventing user input. Under 200ms is good.
115 ms
Cumulative Layout Shift Cumulative Layout Shift — measures visual stability. How much the page layout shifts during loading. Under 0.1 is good.
0.000
Speed Index Speed Index — how quickly content is visually displayed during load. Under 3.4s is good.
2.86 s
Time to Interactive Time to Interactive — how long until the page is fully interactive and responds to user input. Under 3.8s is good.
7.84 s
Audit breakdown by category with detailed findings.
Remove large, duplicate JavaScript modules from bundles to reduce unnecessary bytes consumed by network activity.
Performance issues directly impact user engagement and conversion rates.
Polyfills and transforms enable older browsers to use new JavaScript features. However, many aren't necessary for modern browsers. Consider modifying your JavaScript build process to not transpile Baseline features, unless you know you must support older browsers. Learn why most sites can deploy ES6+ code without transpiling
Shipping ES5 transpiled code to modern browsers wastes bytes — every user with an evergreen browser pays for compatibility you don't need.
Most users today run browsers that natively support ES6+, async/await, optional chaining, and the rest of modern JavaScript. Transpiling to ES5 'just in case' adds 20-40% to your bundle for no benefit. Configure your build to target a modern browserslist, or ship a differential bundle pair (modern + legacy) with the module/nomodule pattern.
Source: Google web.dev / Lighthouse
3rd party code can significantly impact load performance. Reduce and defer loading of 3rd party code to prioritize your page's content.
Performance issues directly impact user engagement and conversion rates.
A long cache lifetime can speed up repeat visits to your page. Learn more about caching.
Performance issues directly impact user engagement and conversion rates.
Your first network request is the most important. Reduce its latency by avoiding redirects, ensuring a fast server response, and enabling text compression.
Performance issues directly impact user engagement and conversion rates.
Reducing the download time of images can improve the perceived load time of the page and LCP. Learn more about optimizing image size
Performance issues directly impact user engagement and conversion rates.
| URL | Resource Size | Est Savings | |
|---|---|---|---|
See what's new!
Read about new features and improvements in Teams
Updates div.gather-layout > main.gather-layout__main > div.gather-layout__main__inner > div.gather-whats-new-section | /evergreen-assets/gather/images/insider-blog/insider-blog... | 1.2 MiB | 1.0 MiB |
div.gather-bento-grid > div.gather-bento-grid__item > p > img.gather-bento-image div.gather-bento-grid > div.gather-bento-grid__item > p > img.gather-bento-image | /evergreen-assets/gather/images/bento/from_skype/continue... | 81.1 KiB | 59.2 KiB |
Continue your Skype conversations in Teams main.gather-layout__main > div.gather-layout__main__inner > div.gather-bento-grid > div.gather-bento-grid__item | /evergreen-assets/gather/images/bento/from_skype/continue... | 193.2 KiB | 38.0 KiB |
div.gather-hero__media > div.gather-hero__media__inner > picture#SKYPE-GATHER-HERO-VIDEO-PLACEHOLDER > img.gather-hero-placeholder-img div.gather-hero__media > div.gather-hero__media__inner > picture#SKYPE-GATHER-HERO-VIDEO-PLACEHOLDER > img.gather-hero-placeholder-img | /evergreen-assets/gather/videos/from_skype/hero-video-pla... | 24.3 KiB | 13.6 KiB |
header#GATHER_LAYOUT_HEADER > div.gather-layout__header__inner > a.gather-layout__header__title > img.gather-layout__header__title__image header#GATHER_LAYOUT_HEADER > div.gather-layout__header__inner > a.gather-layout__header__title > img.gather-layout__header__title__image | statics.teams.cdn.live.net/evergreen-assets/icons/Teams_Logo_v2025_80x80.png | 6.5 KiB | 6.2 KiB |
Optimize LCP by making the LCP image discoverable from the HTML immediately, and avoiding lazy-loading
Performance issues directly impact user engagement and conversion rates.
Avoid chaining critical requests by reducing the length of chains, reducing the download size of resources, or deferring the download of unnecessary resources to improve page load.
Performance issues directly impact user engagement and conversion rates.
These insights are also available in the Chrome DevTools Performance Panel - record a trace to view more detailed information.
Redirects introduce additional delays before the page can be loaded. Learn how to avoid page redirects.
Performance issues directly impact user engagement and conversion rates.
| URL | Time Spent |
|---|---|
| skype.com/ | 1.2 s |
| www.skype.com/ | 814 ms |
| teams.live.com/free?source=skype | 0.0 ms |
Time to Interactive is the amount of time it takes for the page to become fully interactive. Learn more about the Time to Interactive metric.
Performance issues directly impact user engagement and conversion rates.
The maximum potential First Input Delay that your users could experience is the duration of the longest task. Learn more about the Maximum Potential First Input Delay metric.
Performance issues directly impact user engagement and conversion rates.
Reduce unused JavaScript and defer loading scripts until they are required to decrease bytes consumed by network activity. Learn how to reduce unused JavaScript.
Multi-megabyte JavaScript bundles delay every interactive feature on the page.
This is the Lighthouse audit fired when too much JS is shipped relative to what executes. The fix isn't a config flag — it requires bundle analysis (webpack-bundle-analyzer, rollup-plugin-visualizer), splitting routes into chunks, lazy-loading off-screen components, and removing unused dependencies. Fundamentally different from minification: minifying reduces byte count, this reduces what's downloaded at all.
Source: Google web.dev / Lighthouse
| URL | Transfer Size | Est Savings |
|---|---|---|
| /teams-modular-packages/hashed-assets/688-aefeb25c1246ebc... | 32.2 KiB | 23.8 KiB |
Many navigations are performed by going back to a previous page, or forwards again. The back/forward cache (bfcache) can speed up these return navigations. Learn more about the bfcache
Performance issues directly impact user engagement and conversion rates.
| Failure reason | Failure type |
|---|---|
| The page has an unload handler in the main frame. | Actionable |
Minifying CSS files can reduce network payload sizes. Learn how to minify CSS.
Performance issues directly impact user engagement and conversion rates.
| URL | Transfer Size | Est Savings |
|---|---|---|
| /* ========== Variables. ========== */ :root { --gather-layout-inner-max-width: 2000px; … } … | 7.3 KiB | 2.5 KiB |
More information about the performance of your application. These numbers don't directly affect the Performance score.
These checks highlight opportunities to improve the accessibility of your web app. Automatic detection can only detect a subset of issues and does not guarantee the accessibility of your web app, so manual testing is also encouraged.
Deprecated APIs will eventually be removed from the browser. Learn more about deprecated APIs.
Performance issues directly impact user engagement and conversion rates.
| Deprecation / Warning | Source |
|---|---|
| Unload event listeners are deprecated and will be removed. |
These checks ensure that your page is following basic search engine optimization advice. There are many additional factors Lighthouse does not score here that may affect your search ranking, including performance on Core Web Vitals. Learn more about Google Search Essentials.
Industry-standard audits powered by Google Lighthouse. — Desktop
Key metrics that affect user experience. — Desktop
First Contentful Paint First Contentful Paint — how long until the browser renders the first piece of content. Under 1.8s is good.
1.01 s
Largest Contentful Paint Largest Contentful Paint — how long until the largest visible element loads. Under 2.5s is good.
1.85 s
Total Blocking Time Total Blocking Time — total time the main thread was blocked, preventing user input. Under 200ms is good.
5 ms
Cumulative Layout Shift Cumulative Layout Shift — measures visual stability. How much the page layout shifts during loading. Under 0.1 is good.
0.000
Speed Index Speed Index — how quickly content is visually displayed during load. Under 3.4s is good.
1.01 s
Time to Interactive Time to Interactive — how long until the page is fully interactive and responds to user input. Under 3.8s is good.
2.03 s
Audit breakdown by category with detailed findings.
Remove large, duplicate JavaScript modules from bundles to reduce unnecessary bytes consumed by network activity.
Performance issues directly impact user engagement and conversion rates.
Polyfills and transforms enable older browsers to use new JavaScript features. However, many aren't necessary for modern browsers. Consider modifying your JavaScript build process to not transpile Baseline features, unless you know you must support older browsers. Learn why most sites can deploy ES6+ code without transpiling
Shipping ES5 transpiled code to modern browsers wastes bytes — every user with an evergreen browser pays for compatibility you don't need.
Most users today run browsers that natively support ES6+, async/await, optional chaining, and the rest of modern JavaScript. Transpiling to ES5 'just in case' adds 20-40% to your bundle for no benefit. Configure your build to target a modern browserslist, or ship a differential bundle pair (modern + legacy) with the module/nomodule pattern.
Source: Google web.dev / Lighthouse
3rd party code can significantly impact load performance. Reduce and defer loading of 3rd party code to prioritize your page's content.
Performance issues directly impact user engagement and conversion rates.
A long cache lifetime can speed up repeat visits to your page. Learn more about caching.
Performance issues directly impact user engagement and conversion rates.
Your first network request is the most important. Reduce its latency by avoiding redirects, ensuring a fast server response, and enabling text compression.
Performance issues directly impact user engagement and conversion rates.
Reducing the download time of images can improve the perceived load time of the page and LCP. Learn more about optimizing image size
Performance issues directly impact user engagement and conversion rates.
| URL | Resource Size | Est Savings | |
|---|---|---|---|
See what's new!
Read about new features and improvements in Teams
Updates div.gather-layout > main.gather-layout__main > div.gather-layout__main__inner > div.gather-whats-new-section | /evergreen-assets/gather/images/insider-blog/insider-blog... | 1.2 MiB | 1.0 MiB |
div.gather-hero__media > div.gather-hero__media__inner > picture#SKYPE-GATHER-HERO-VIDEO-PLACEHOLDER > img.gather-hero-placeholder-img div.gather-hero__media > div.gather-hero__media__inner > picture#SKYPE-GATHER-HERO-VIDEO-PLACEHOLDER > img.gather-hero-placeholder-img | /evergreen-assets/gather/videos/from_skype/hero-video-pla... | 189.4 KiB | 168.6 KiB |
div.gather-bento-grid > div.gather-bento-grid__item > p.gather-hide-when-media-mobile > img.gather-bento-image div.gather-bento-grid > div.gather-bento-grid__item > p.gather-hide-when-media-mobile > img.gather-bento-image | /evergreen-assets/gather/images/bento/from_skype/web-coll... | 145.1 KiB | 139.4 KiB |
div.gather-bento-grid > div.gather-bento-grid__item > p > img.gather-bento-image div.gather-bento-grid > div.gather-bento-grid__item > p > img.gather-bento-image | /evergreen-assets/gather/images/bento/from_skype/continue... | 81.1 KiB | 57.6 KiB |
div.gather-bento-grid > div.gather-bento-grid__item > p.gather-hide-when-media-mobile > img.gather-bento-image div.gather-bento-grid > div.gather-bento-grid__item > p.gather-hide-when-media-mobile > img.gather-bento-image | /evergreen-assets/gather/images/bento/from_skype/share-me... | 79.7 KiB | 55.5 KiB |
div.gather-bento-grid > div.gather-bento-grid__item > p.gather-hide-when-media-mobile > img.gather-bento-image div.gather-bento-grid > div.gather-bento-grid__item > p.gather-hide-when-media-mobile > img.gather-bento-image | /evergreen-assets/gather/images/bento/from_skype/video-ca... | 57.5 KiB | 53.6 KiB |
div.gather-bento-grid > div.gather-bento-grid__item > p.gather-hide-when-media-mobile > img.gather-bento-image div.gather-bento-grid > div.gather-bento-grid__item > p.gather-hide-when-media-mobile > img.gather-bento-image | /evergreen-assets/gather/images/bento/from_skype/chat-the... | 48.6 KiB | 43.7 KiB |
Continue your Skype conversations in Teams main.gather-layout__main > div.gather-layout__main__inner > div.gather-bento-grid > div.gather-bento-grid__item | /evergreen-assets/gather/images/bento/from_skype/continue... | 193.2 KiB | 38.0 KiB |
div.gather-bento-grid > div.gather-bento-grid__item > p.gather-hide-when-media-mobile > img.gather-bento-image div.gather-bento-grid > div.gather-bento-grid__item > p.gather-hide-when-media-mobile > img.gather-bento-image | /evergreen-assets/gather/images/bento/from_skype/document... | 16.6 KiB | 10.9 KiB |
header#GATHER_LAYOUT_HEADER > div.gather-layout__header__inner > a.gather-layout__header__title > img.gather-layout__header__title__image header#GATHER_LAYOUT_HEADER > div.gather-layout__header__inner > a.gather-layout__header__title > img.gather-layout__header__title__image | statics.teams.cdn.live.net/evergreen-assets/icons/Teams_Logo_v2025_80x80.png | 6.5 KiB | 6.4 KiB |
Optimize LCP by making the LCP image discoverable from the HTML immediately, and avoiding lazy-loading
Performance issues directly impact user engagement and conversion rates.
Avoid chaining critical requests by reducing the length of chains, reducing the download size of resources, or deferring the download of unnecessary resources to improve page load.
Performance issues directly impact user engagement and conversion rates.
These insights are also available in the Chrome DevTools Performance Panel - record a trace to view more detailed information.
Reduce unused JavaScript and defer loading scripts until they are required to decrease bytes consumed by network activity. Learn how to reduce unused JavaScript.
Multi-megabyte JavaScript bundles delay every interactive feature on the page.
This is the Lighthouse audit fired when too much JS is shipped relative to what executes. The fix isn't a config flag — it requires bundle analysis (webpack-bundle-analyzer, rollup-plugin-visualizer), splitting routes into chunks, lazy-loading off-screen components, and removing unused dependencies. Fundamentally different from minification: minifying reduces byte count, this reduces what's downloaded at all.
Source: Google web.dev / Lighthouse
| URL | Transfer Size | Est Savings |
|---|---|---|
| /teams-modular-packages/hashed-assets/688-aefeb25c1246ebc... | 32.2 KiB | 23.8 KiB |
| /teams-modular-packages/hashed-assets/661-edceffffc912794... | 59.5 KiB | 20.1 KiB |
Many navigations are performed by going back to a previous page, or forwards again. The back/forward cache (bfcache) can speed up these return navigations. Learn more about the bfcache
Performance issues directly impact user engagement and conversion rates.
| Failure reason | Failure type |
|---|---|
| The page has an unload handler in the main frame. | Actionable |
Minifying CSS files can reduce network payload sizes. Learn how to minify CSS.
Performance issues directly impact user engagement and conversion rates.
| URL | Transfer Size | Est Savings |
|---|---|---|
| /* ========== Variables. ========== */ :root { --gather-layout-inner-max-width: 2000px; … } … | 7.3 KiB | 2.5 KiB |
More information about the performance of your application. These numbers don't directly affect the Performance score.
Redirects introduce additional delays before the page can be loaded. Learn how to avoid page redirects.
Performance issues directly impact user engagement and conversion rates.
| URL | Time Spent |
|---|---|
| skype.com/ | 543 ms |
| www.skype.com/ | 220 ms |
| teams.live.com/free?source=skype | 0.0 ms |
These checks highlight opportunities to improve the accessibility of your web app. Automatic detection can only detect a subset of issues and does not guarantee the accessibility of your web app, so manual testing is also encouraged.
Deprecated APIs will eventually be removed from the browser. Learn more about deprecated APIs.
Performance issues directly impact user engagement and conversion rates.
| Deprecation / Warning | Source |
|---|---|
| Unload event listeners are deprecated and will be removed. |
These checks ensure that your page is following basic search engine optimization advice. There are many additional factors Lighthouse does not score here that may affect your search ranking, including performance on Core Web Vitals. Learn more about Google Search Essentials.
Send Feedback