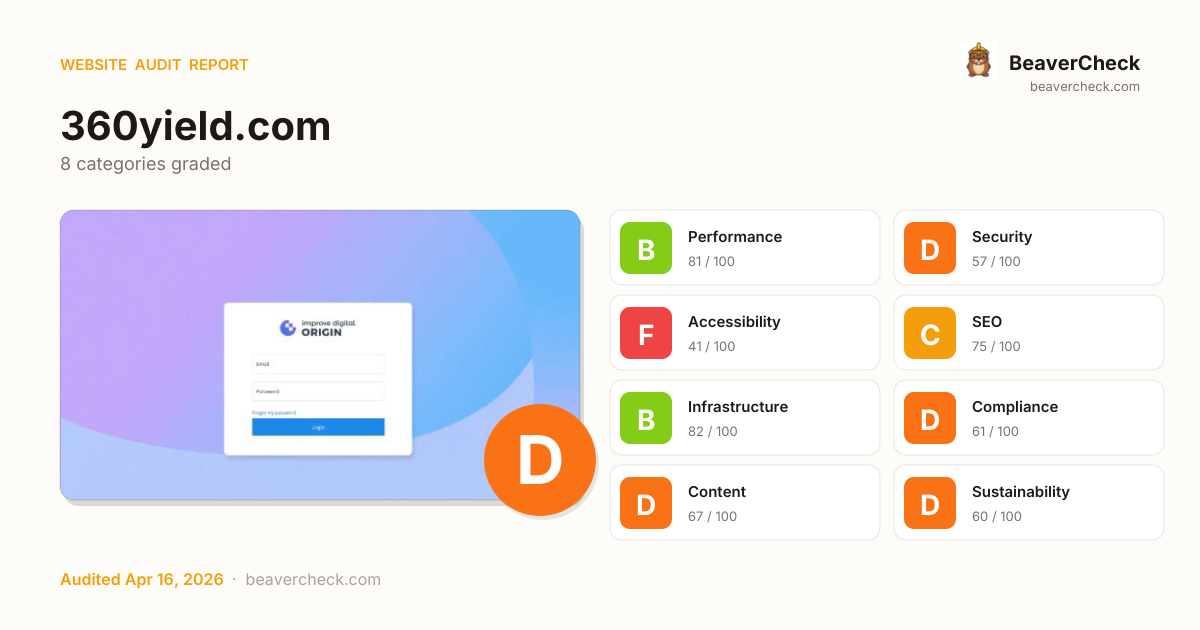
Mobile 375 × 812

Desktop 1440 × 900

Score: 66 / 100
Based on 8 categories, 0 sections
Decent speed, but optimizing further could improve engagement.
Several missing protections leave your users and data exposed.
Major barriers for users with disabilities — up to 15% of your audience.
Solid SEO basics — a few optimizations could boost rankings.
Good server performance with room for optimization.
Several regulatory requirements are not yet met.
Missing metadata means poor previews on social media and search.
Heavier than average — reducing page weight saves energy and bandwidth.
The overall score is a weighted average of individual category scores. Categories with more impact on user experience and security carry more weight.
Weights reflect general web best practices. Individual needs may differ.
Content-Security-Policy header is missing
Security gaps expose your site and users to attacks, eroding trust.
HSTS header is missing
Security gaps expose your site and users to attacks, eroding trust.
No Content-Security-Policy header found
Security gaps expose your site and users to attacks, eroding trust.
Page weighs 6.7 MB (6.0 MB transferred)
Performance issues directly impact user engagement and conversion rates.
1 button(s) with no accessible text
Accessibility issues exclude users with disabilities — up to 15% of your potential audience.
High impact, low effort — start here.
High impact, requires investment.
Small gains, minimal effort.
Nothing in this quadrant — good news.
Low impact, high effort — do last.
Nothing in this quadrant — good news.
[](https://beavercheck.com/results/ac5845ca-ef74-4606-8764-5c704167489e)<a href="https://beavercheck.com/results/ac5845ca-ef74-4606-8764-5c704167489e"><img src="https://beavercheck.com/badge?url=https%3A%2F%2F360yield.com" alt="BeaverCheck Score"></a>https://beavercheck.com/badge?url=https%3A%2F%2F360yield.comThis badge auto-updates with your latest scan result.
Your site has several issues that may be affecting user experience and business outcomes. The 1 performance issue below shapes how fast users perceive your page. Accessibility issues exclude users who rely on assistive technology — an estimated 15% of your potential audience. Addressing the critical issues below would have the most immediate impact on your user trust.
8 barrier(s) likely increasing bounce by ~19%.
No HSTS header
+1% bounceReturning visitors are briefly exposed to downgrade attacks on first request
Fix: Set Strict-Transport-Security: max-age=31536000; includeSubDomains
No Content-Security-Policy header
+1% bounceHigher XSS blast radius — one compromised script can exfiltrate the checkout form
Fix: Ship a reporting-only CSP first, then enforce once violations are clean
1 form field(s) without a label
+2% bounceScreen readers skip unlabeled fields; autofill can't identify them; checkout abandonment spikes
Fix: Associate every input with a visible <label for="…">; add autocomplete attributes
Viewport disables user zoom
+2% bounceVisitors with low vision can't read the page — and some jurisdictions treat this as a legal risk
Fix: Remove user-scalable=no; drop maximum-scale if it's below 2
No Open Graph tags
+2% bounceLinks shared on LinkedIn / Slack / Facebook show bare URLs — referral clicks drop
Fix: Add og:title, og:description, og:image, og:url to the page head
No structured data
+2% bounceNo rich-result eligibility in Google — lower SERP CTR vs competitors with stars and prices
Fix: Add JSON-LD for your page type (Product, Article, FAQPage, LocalBusiness, …)
Thin content
+3% bounceUnder 300 words — visitors bounce looking for substance, search engines rank competitors first
Fix: Add a substantive FAQ, product detail, or case-study section
No skip-to-content link
+1% bounceKeyboard and screen-reader users must tab through the entire header on every page
Fix: Add a visible-on-focus <a href="#main">Skip to content</a> as the first focusable element
Preliminary CRO audit — each barrier links to the tab with detailed analysis.
$500 investment → $1.50/month returns + USD 157,500 risk avoided
$500
5h · 5 findings
$1.50 /mo
~$18 / year
USD 157,500
if kept compliant
$150 — in quick wins — start here for the fastest payback
Figures combine localized regulatory fine ceilings, search/conversion value priced against local CPC, and bandwidth waste estimates. Results depend on implementation quality and audience composition. Not legal or financial advice.
5.0 developer hours at $100/hr
Based on United States rates ($100/hr)
Start here for the best return on investment
$13,126 / month at risk
~$157,518 / year if left unfixed
$157,500
+8 more
$1.50 /mo
18749.2 MB/mo × 0.080 USD/GB
Compliance figures represent the statutory maximum fine for the most severe triggered category, capped per regulation — not the sum of per-finding penalties. Based on published regulatory fine ranges. This is not legal advice.
Thanks for your feedback!
We'll use a cached audit if available, or offer to scan.
Industry-standard audits powered by Google Lighthouse.
Key metrics that affect user experience.
First Contentful Paint First Contentful Paint — how long until the browser renders the first piece of content. Under 1.8s is good.
34.76 s
Largest Contentful Paint Largest Contentful Paint — how long until the largest visible element loads. Under 2.5s is good.
0 ms
Total Blocking Time Total Blocking Time — total time the main thread was blocked, preventing user input. Under 200ms is good.
0 ms
Cumulative Layout Shift Cumulative Layout Shift — measures visual stability. How much the page layout shifts during loading. Under 0.1 is good.
0.000
Speed Index Speed Index — how quickly content is visually displayed during load. Under 3.4s is good.
34.76 s
Time to Interactive Time to Interactive — how long until the page is fully interactive and responds to user input. Under 3.8s is good.
0 ms
Audit breakdown by category with detailed findings.
Remove large, duplicate JavaScript modules from bundles to reduce unnecessary bytes consumed by network activity.
Performance issues directly impact user engagement and conversion rates.
Polyfills and transforms enable older browsers to use new JavaScript features. However, many aren't necessary for modern browsers. Consider modifying your JavaScript build process to not transpile Baseline features, unless you know you must support older browsers. Learn why most sites can deploy ES6+ code without transpiling
Shipping ES5 transpiled code to modern browsers wastes bytes — every user with an evergreen browser pays for compatibility you don't need.
Most users today run browsers that natively support ES6+, async/await, optional chaining, and the rest of modern JavaScript. Transpiling to ES5 'just in case' adds 20-40% to your bundle for no benefit. Configure your build to target a modern browserslist, or ship a differential bundle pair (modern + legacy) with the module/nomodule pattern.
Source: Google web.dev / Lighthouse
3rd party code can significantly impact load performance. Reduce and defer loading of 3rd party code to prioritize your page's content.
Performance issues directly impact user engagement and conversion rates.
A long cache lifetime can speed up repeat visits to your page. Learn more about caching.
Performance issues directly impact user engagement and conversion rates.
Your first network request is the most important. Reduce its latency by avoiding redirects, ensuring a fast server response, and enabling text compression.
Performance issues directly impact user engagement and conversion rates.
Requests are blocking the page's initial render, which may delay LCP. Deferring or inlining can move these network requests out of the critical path.
Performance issues directly impact user engagement and conversion rates.
These insights are also available in the Chrome DevTools Performance Panel - record a trace to view more detailed information.
Time to Interactive is the amount of time it takes for the page to become fully interactive. Learn more about the Time to Interactive metric.
Performance issues directly impact user engagement and conversion rates.
Redirects introduce additional delays before the page can be loaded. Learn how to avoid page redirects.
Performance issues directly impact user engagement and conversion rates.
The maximum potential First Input Delay that your users could experience is the duration of the longest task. Learn more about the Maximum Potential First Input Delay metric.
Performance issues directly impact user engagement and conversion rates.
Minifying CSS files can reduce network payload sizes. Learn how to minify CSS.
Performance issues directly impact user engagement and conversion rates.
Minifying JavaScript files can reduce payload sizes and script parse time. Learn how to minify JavaScript.
Performance issues directly impact user engagement and conversion rates.
Reduce unused rules from stylesheets and defer CSS not used for above-the-fold content to decrease bytes consumed by network activity. Learn how to reduce unused CSS.
Performance issues directly impact user engagement and conversion rates.
Reduce unused JavaScript and defer loading scripts until they are required to decrease bytes consumed by network activity. Learn how to reduce unused JavaScript.
Multi-megabyte JavaScript bundles delay every interactive feature on the page.
This is the Lighthouse audit fired when too much JS is shipped relative to what executes. The fix isn't a config flag — it requires bundle analysis (webpack-bundle-analyzer, rollup-plugin-visualizer), splitting routes into chunks, lazy-loading off-screen components, and removing unused dependencies. Fundamentally different from minification: minifying reduces byte count, this reduces what's downloaded at all.
Source: Google web.dev / Lighthouse
Lists the longest tasks on the main thread, useful for identifying worst contributors to input delay. Learn how to avoid long main-thread tasks
Performance issues directly impact user engagement and conversion rates.
Many navigations are performed by going back to a previous page, or forwards again. The back/forward cache (bfcache) can speed up these return navigations. Learn more about the bfcache
Performance issues directly impact user engagement and conversion rates.
| Failure reason | Failure type |
|---|---|
| The page has an unload handler in the main frame. | Actionable |
Large network payloads cost users real money and are highly correlated with long load times. Learn how to reduce payload sizes.
Performance issues directly impact user engagement and conversion rates.
More information about the performance of your application. These numbers don't directly affect the Performance score.
These checks highlight opportunities to improve the accessibility of your web app. Automatic detection can only detect a subset of issues and does not guarantee the accessibility of your web app, so manual testing is also encouraged.
If a page doesn't specify a `lang` attribute, a screen reader assumes that the page is in the default language that the user chose when setting up the screen reader. If the page isn't actually in the default language, then the screen reader might not announce the page's text correctly. Learn more about the `lang` attribute.
Performance issues directly impact user engagement and conversion rates.
| Failing Elements |
|---|
html html |
These are opportunities to improve the interpretation of your content by users in different locales.
Disabling zooming is problematic for users with low vision who rely on screen magnification to properly see the contents of a web page. Learn more about the viewport meta tag.
Performance issues directly impact user engagement and conversion rates.
| Failing Elements |
|---|
head > meta head > meta |
One main landmark helps screen reader users navigate a web page. Learn more about landmarks.
Performance issues directly impact user engagement and conversion rates.
| Failing Elements |
|---|
html html |
These items highlight common accessibility best practices.
Deprecated APIs will eventually be removed from the browser. Learn more about deprecated APIs.
Performance issues directly impact user engagement and conversion rates.
| Deprecation / Warning | Source |
|---|---|
| SharedStorage | ssp.improvedigital.com/compiled/js/ext-multi.js?vmaster-1825 line 6, col 89637 |
| Unload event listeners are deprecated and will be removed. |
Errors logged to the console indicate unresolved problems. They can come from network request failures and other browser concerns. Learn more about this errors in console diagnostic audit
Performance issues directly impact user engagement and conversion rates.
| Source | Description |
|---|---|
/maps/api/js?key=AIzaSyDlIrvrw-tjdtMgutn1VQ_VizItXx-1ujM&... line 1410, col 206 | Connecting to 'https://maps.googleapis.com/maps/api/mapsjs/gen_204?csp_test=true' violates the following Content Security Policy directive: "connect-src 'self' ws: https://*.google-analytics.com https://s3-eu-west-1.amazonaws.com". The action has been blocked. |
Failed to load resource: the server responded with a status of 404 () | |
www.google-analytics.com/analytics.js line 33, col 54 | Loading the script 'https://www.googletagmanager.com/gtag/js?id=G-J084TRT2WD&cx=c&_slc=1' violates the following Content Security Policy directive: "script-src 'self' 'unsafe-eval' 'unsafe-inline' https://*.googleapis.com https://js-agent.newrelic.com/nr-1044.min.js https://www.google.com https://www.gstatic.com https://*.google-analytics.com http://*.getclicky.com". Note that 'script-src-elem' was not explicitly set, so 'script-src' is used as a fallback. The action has been blocked. |
ssp.improvedigital.com/compiled/js/ext-multi.js?vmaster-1825 line 6, col 46095 | TypeError: Cannot read properties of null (reading '1')
at https://ssp.improvedigital.com/compiled/js/ext-multi.js?vmaster-1825:7:46096
at 16.../flowplayer (https://ssp.improvedigital.com/compiled/js/ext-multi.js?vmaster-1825:7:47236)
at j (https://ssp.improvedigital.com/compiled/js/ext-multi.js?vmaster-1825:7:6960)
at https://ssp.improvedigital.com/compiled/js/ext-multi.js?vmaster-1825:7:7011
at 19../engine/embed (https://ssp.improvedigital.com/compiled/js/ext-multi.js?vmaster-1825:7:63011)
at j (https://ssp.improvedigital.com/compiled/js/ext-multi.js?vmaster-1825:7:6960)
at a (https://ssp.improvedigital.com/compiled/js/ext-multi.js?vmaster-1825:7:7128)
at https://ssp.improvedigital.com/compiled/js/ext-multi.js?vmaster-1825:7:7145
at https://ssp.improvedigital.com/compiled/js/ext-multi.js?vmaster-1825:7:6675
at https://ssp.improvedigital.com/compiled/js/ext-multi.js?vmaster-1825:7:6681 |
Issues logged to the `Issues` panel in Chrome Devtools indicate unresolved problems. They can come from network request failures, insufficient security controls, and other browser concerns. Open up the Issues panel in Chrome DevTools for more details on each issue.
Performance issues directly impact user engagement and conversion rates.
| Issue type |
|---|
| Content security policy |
Source maps translate minified code to the original source code. This helps developers debug in production. In addition, Lighthouse is able to provide further insights. Consider deploying source maps to take advantage of these benefits. Learn more about source maps.
Performance issues directly impact user engagement and conversion rates.
These checks ensure that your page is following basic search engine optimization advice. There are many additional factors Lighthouse does not score here that may affect your search ranking, including performance on Core Web Vitals. Learn more about Google Search Essentials.
Meta descriptions may be included in search results to concisely summarize page content. Learn more about the meta description.
Performance issues directly impact user engagement and conversion rates.
Format your HTML in a way that enables crawlers to better understand your app’s content.
Industry-standard audits powered by Google Lighthouse. — Desktop
Key metrics that affect user experience. — Desktop
First Contentful Paint First Contentful Paint — how long until the browser renders the first piece of content. Under 1.8s is good.
6.26 s
Largest Contentful Paint Largest Contentful Paint — how long until the largest visible element loads. Under 2.5s is good.
6.61 s
Total Blocking Time Total Blocking Time — total time the main thread was blocked, preventing user input. Under 200ms is good.
110 ms
Cumulative Layout Shift Cumulative Layout Shift — measures visual stability. How much the page layout shifts during loading. Under 0.1 is good.
0.000
Speed Index Speed Index — how quickly content is visually displayed during load. Under 3.4s is good.
6.26 s
Time to Interactive Time to Interactive — how long until the page is fully interactive and responds to user input. Under 3.8s is good.
6.62 s
Audit breakdown by category with detailed findings.
Remove large, duplicate JavaScript modules from bundles to reduce unnecessary bytes consumed by network activity.
Performance issues directly impact user engagement and conversion rates.
Polyfills and transforms enable older browsers to use new JavaScript features. However, many aren't necessary for modern browsers. Consider modifying your JavaScript build process to not transpile Baseline features, unless you know you must support older browsers. Learn why most sites can deploy ES6+ code without transpiling
Shipping ES5 transpiled code to modern browsers wastes bytes — every user with an evergreen browser pays for compatibility you don't need.
Most users today run browsers that natively support ES6+, async/await, optional chaining, and the rest of modern JavaScript. Transpiling to ES5 'just in case' adds 20-40% to your bundle for no benefit. Configure your build to target a modern browserslist, or ship a differential bundle pair (modern + legacy) with the module/nomodule pattern.
Source: Google web.dev / Lighthouse
3rd party code can significantly impact load performance. Reduce and defer loading of 3rd party code to prioritize your page's content.
Performance issues directly impact user engagement and conversion rates.
A long cache lifetime can speed up repeat visits to your page. Learn more about caching.
Performance issues directly impact user engagement and conversion rates.
Your first network request is the most important. Reduce its latency by avoiding redirects, ensuring a fast server response, and enabling text compression.
Performance issues directly impact user engagement and conversion rates.
Consider setting font-display to swap or optional to ensure text is consistently visible. swap can be further optimized to mitigate layout shifts with font metric overrides.
Performance issues directly impact user engagement and conversion rates.
| URL | Est Savings |
|---|---|
| /s/opensans/v44/memvYaGs126MiZpBA-UvWbX2vVnXBbObj2OVTS-mu... | 55 ms |
Optimize LCP by making the LCP image discoverable from the HTML immediately, and avoiding lazy-loading
Performance issues directly impact user engagement and conversion rates.
Avoid chaining critical requests by reducing the length of chains, reducing the download size of resources, or deferring the download of unnecessary resources to improve page load.
Performance issues directly impact user engagement and conversion rates.
Requests are blocking the page's initial render, which may delay LCP. Deferring or inlining can move these network requests out of the critical path.
Performance issues directly impact user engagement and conversion rates.
These insights are also available in the Chrome DevTools Performance Panel - record a trace to view more detailed information.
Redirects introduce additional delays before the page can be loaded. Learn how to avoid page redirects.
Performance issues directly impact user engagement and conversion rates.
| URL | Time Spent |
|---|---|
| 360yield.com/ | 291 ms |
| ssp.improvedigital.com/ | 355 ms |
| ssp.improvedigital.com/login | 0.0 ms |
Time to Interactive is the amount of time it takes for the page to become fully interactive. Learn more about the Time to Interactive metric.
Performance issues directly impact user engagement and conversion rates.
The maximum potential First Input Delay that your users could experience is the duration of the longest task. Learn more about the Maximum Potential First Input Delay metric.
Performance issues directly impact user engagement and conversion rates.
Reduce unused rules from stylesheets and defer CSS not used for above-the-fold content to decrease bytes consumed by network activity. Learn how to reduce unused CSS.
Performance issues directly impact user engagement and conversion rates.
| URL | Transfer Size | Est Savings |
|---|---|---|
| ssp.improvedigital.com/bundles/platformui/ext/theme/phoenix/id-theme-all_03.css | 423.4 KiB | 422.8 KiB |
| ssp.improvedigital.com/bundles/platformui/ext/theme/phoenix/id-theme-all_02.css | 412.4 KiB | 408.0 KiB |
| ssp.improvedigital.com/bundles/platformui/ext/theme/phoenix/id-theme-all_04.css | 375.8 KiB | 375.7 KiB |
| ssp.improvedigital.com/bundles/platformui/ext/theme/phoenix/id-theme-all_01.css | 336.8 KiB | 333.0 KiB |
| /build/css/polaris.f25e11d7bd6b61d9df7e047b22dfb2b9.css?v... | 793.7 KiB | 34.2 KiB |
| ssp.improvedigital.com/bundles/platformui/app/ux/flowplayer/skin/functional.css | 33.8 KiB | 33.8 KiB |
| ssp.improvedigital.com/build/css/ui.422e69dc2af864c88b1aaa9d5e6ae0d2.css | 17.7 KiB | 17.6 KiB |
Reduce unused JavaScript and defer loading scripts until they are required to decrease bytes consumed by network activity. Learn how to reduce unused JavaScript.
Multi-megabyte JavaScript bundles delay every interactive feature on the page.
This is the Lighthouse audit fired when too much JS is shipped relative to what executes. The fix isn't a config flag — it requires bundle analysis (webpack-bundle-analyzer, rollup-plugin-visualizer), splitting routes into chunks, lazy-loading off-screen components, and removing unused dependencies. Fundamentally different from minification: minifying reduces byte count, this reduces what's downloaded at all.
Source: Google web.dev / Lighthouse
| URL | Transfer Size | Est Savings |
|---|---|---|
| ssp.improvedigital.com/compiled/js/ext-multi.js?vmaster-1825 | 3.0 MiB | 2.0 MiB |
| /maps/api/js?key=AIzaSyDlIrvrw-tjdtMgutn1VQ_VizItXx-1ujM&... | 173.0 KiB | 100.2 KiB |
| ssp.improvedigital.com/bundles/platformui/vendor/socket.io.2.0.1.js | 59.6 KiB | 46.9 KiB |
Many navigations are performed by going back to a previous page, or forwards again. The back/forward cache (bfcache) can speed up these return navigations. Learn more about the bfcache
Performance issues directly impact user engagement and conversion rates.
| Failure reason | Failure type |
|---|---|
| The page has an unload handler in the main frame. | Actionable |
Minifying JavaScript files can reduce payload sizes and script parse time. Learn how to minify JavaScript.
Performance issues directly impact user engagement and conversion rates.
| URL | Transfer Size | Est Savings |
|---|---|---|
| ssp.improvedigital.com/bundles/fosjsrouting/js/router.js | 12.1 KiB | 6.3 KiB |
Large network payloads cost users real money and are highly correlated with long load times. Learn how to reduce payload sizes.
Performance issues directly impact user engagement and conversion rates.
More information about the performance of your application. These numbers don't directly affect the Performance score.
These checks highlight opportunities to improve the accessibility of your web app. Automatic detection can only detect a subset of issues and does not guarantee the accessibility of your web app, so manual testing is also encouraged.
Low-contrast text is difficult or impossible for many users to read. Learn how to provide sufficient color contrast.
Performance issues directly impact user engagement and conversion rates.
| Failing Elements |
|---|
div#login__username-bodyEl > div#login__username-triggerWrap > div#login__username-inputWrap > input#login__username-inputEl div#login__username-bodyEl > div#login__username-triggerWrap > div#login__username-inputWrap > input#login__username-inputEl |
div#login__password-bodyEl > div#login__password-triggerWrap > div#login__password-inputWrap > input#login__password-inputEl div#login__password-bodyEl > div#login__password-triggerWrap > div#login__password-inputWrap > input#login__password-inputEl |
Login a#login_submit_form_btn > span#login_submit_form_btn-btnWrap > span#login_submit_form_btn-btnEl > span#login_submit_form_btn-btnInnerEl |
These are opportunities to improve the legibility of your content.
If a page doesn't specify a `lang` attribute, a screen reader assumes that the page is in the default language that the user chose when setting up the screen reader. If the page isn't actually in the default language, then the screen reader might not announce the page's text correctly. Learn more about the `lang` attribute.
Performance issues directly impact user engagement and conversion rates.
| Failing Elements |
|---|
html.x-viewport html.x-viewport |
These are opportunities to improve the interpretation of your content by users in different locales.
Disabling zooming is problematic for users with low vision who rely on screen magnification to properly see the contents of a web page. Learn more about the viewport meta tag.
Performance issues directly impact user engagement and conversion rates.
| Failing Elements |
|---|
head > meta head > meta |
One main landmark helps screen reader users navigate a web page. Learn more about landmarks.
Performance issues directly impact user engagement and conversion rates.
| Failing Elements |
|---|
html.x-viewport html.x-viewport |
These items highlight common accessibility best practices.
Deprecated APIs will eventually be removed from the browser. Learn more about deprecated APIs.
Performance issues directly impact user engagement and conversion rates.
| Deprecation / Warning | Source |
|---|---|
| SharedStorage | ssp.improvedigital.com/compiled/js/ext-multi.js?vmaster-1825 line 6, col 89637 |
| Unload event listeners are deprecated and will be removed. | |
| Synchronous XMLHttpRequest on the main thread is deprecated because of its detrimental effects to the end user's experience. For more help, check https://xhr.spec.whatwg.org/. |
Errors logged to the console indicate unresolved problems. They can come from network request failures and other browser concerns. Learn more about this errors in console diagnostic audit
Performance issues directly impact user engagement and conversion rates.
| Source | Description |
|---|---|
/maps/api/js?key=AIzaSyDlIrvrw-tjdtMgutn1VQ_VizItXx-1ujM&... line 1410, col 206 | Connecting to 'https://maps.googleapis.com/maps/api/mapsjs/gen_204?csp_test=true' violates the following Content Security Policy directive: "connect-src 'self' ws: https://*.google-analytics.com https://s3-eu-west-1.amazonaws.com". The action has been blocked. |
Failed to load resource: the server responded with a status of 404 () | |
www.google-analytics.com/analytics.js line 33, col 54 | Loading the script 'https://www.googletagmanager.com/gtag/js?id=G-J084TRT2WD&cx=c&_slc=1' violates the following Content Security Policy directive: "script-src 'self' 'unsafe-eval' 'unsafe-inline' https://*.googleapis.com https://js-agent.newrelic.com/nr-1044.min.js https://www.google.com https://www.gstatic.com https://*.google-analytics.com http://*.getclicky.com". Note that 'script-src-elem' was not explicitly set, so 'script-src' is used as a fallback. The action has been blocked. |
Issues logged to the `Issues` panel in Chrome Devtools indicate unresolved problems. They can come from network request failures, insufficient security controls, and other browser concerns. Open up the Issues panel in Chrome DevTools for more details on each issue.
Performance issues directly impact user engagement and conversion rates.
| Issue type |
|---|
| Content security policy |
Source maps translate minified code to the original source code. This helps developers debug in production. In addition, Lighthouse is able to provide further insights. Consider deploying source maps to take advantage of these benefits. Learn more about source maps.
Performance issues directly impact user engagement and conversion rates.
These checks ensure that your page is following basic search engine optimization advice. There are many additional factors Lighthouse does not score here that may affect your search ranking, including performance on Core Web Vitals. Learn more about Google Search Essentials.
Meta descriptions may be included in search results to concisely summarize page content. Learn more about the meta description.
Performance issues directly impact user engagement and conversion rates.
Format your HTML in a way that enables crawlers to better understand your app’s content.
Send Feedback