United States · Santa Clara Completed: Apr 16, 2026 17:16 UTC
Mobile 375 × 812

Desktop 1440 × 900

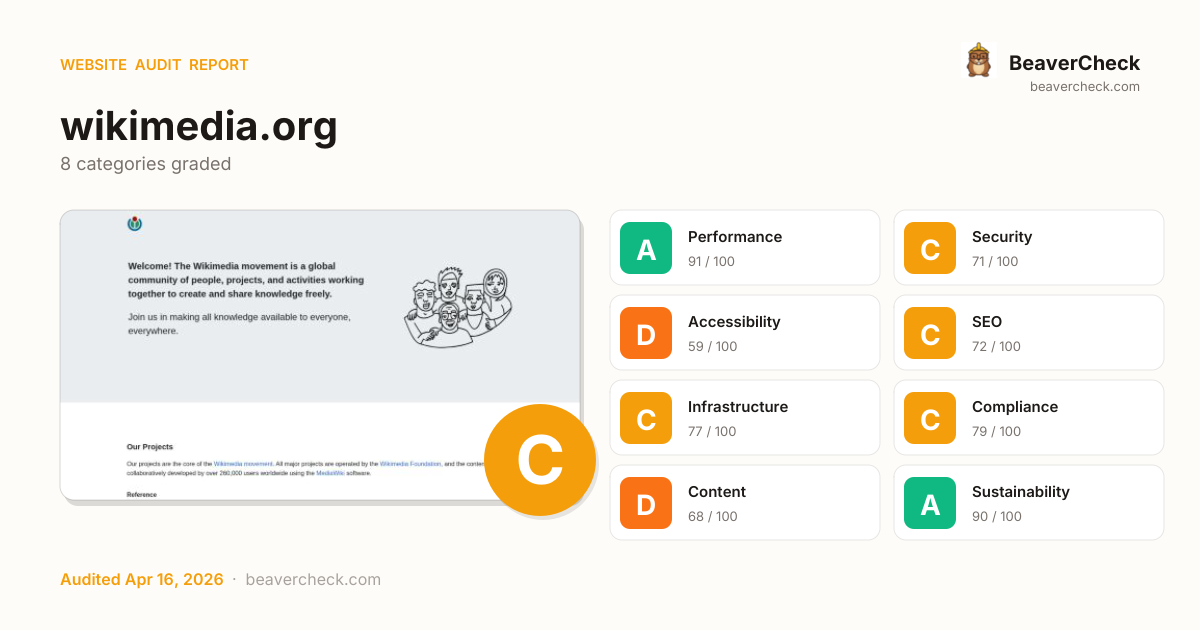
Score: 76 / 100
Based on 8 categories, 0 sections
Fast site — your users get a smooth experience.
Good foundation, but a few gaps could be exploited.
Several issues make your site difficult for assistive technology users.
Solid SEO basics — a few optimizations could boost rankings.
Good server performance with room for optimization.
Mostly compliant — a few items need attention.
Missing metadata means poor previews on social media and search.
Lean and efficient — low environmental impact per visit.
The overall score is a weighted average of individual category scores. Categories with more impact on user experience and security carry more weight.
Weights reflect general web best practices. Individual needs may differ.
Content-Security-Policy header is missing
Security gaps expose your site and users to attacks, eroding trust.
No Content-Security-Policy header found
Security gaps expose your site and users to attacks, eroding trust.
1 image(s) missing alt attribute
Accessibility issues exclude users with disabilities — up to 15% of your potential audience.
14 image-only link(s) without alt text
Accessibility issues exclude users with disabilities — up to 15% of your potential audience.
No <main> landmark found
Accessibility issues exclude users with disabilities — up to 15% of your potential audience.
High impact, low effort — start here.
High impact, requires investment.
Small gains, minimal effort.
Nothing in this quadrant — good news.
Low impact, high effort — do last.
Nothing in this quadrant — good news.
[](https://beavercheck.com/results/ba9b9880-b53d-4f5d-857f-8259a8a7ed32)<a href="https://beavercheck.com/results/ba9b9880-b53d-4f5d-857f-8259a8a7ed32"><img src="https://beavercheck.com/badge?url=https%3A%2F%2Fwikimedia.org" alt="BeaverCheck Score"></a>https://beavercheck.com/badge?url=https%3A%2F%2Fwikimedia.orgThis badge auto-updates with your latest scan result.
Your site performs reasonably well, but a few targeted fixes could meaningfully improve results. Accessibility issues exclude users who rely on assistive technology — an estimated 15% of your potential audience. Addressing the critical issues below would have the most immediate impact on your user trust.
6 barrier(s) likely increasing bounce by ~15%.
No Content-Security-Policy header
+1% bounceHigher XSS blast radius — one compromised script can exfiltrate the checkout form
Fix: Ship a reporting-only CSP first, then enforce once violations are clean
No Open Graph tags
+2% bounceLinks shared on LinkedIn / Slack / Facebook show bare URLs — referral clicks drop
Fix: Add og:title, og:description, og:image, og:url to the page head
No structured data
+2% bounceNo rich-result eligibility in Google — lower SERP CTR vs competitors with stars and prices
Fix: Add JSON-LD for your page type (Product, Article, FAQPage, LocalBusiness, …)
Thin content
+3% bounceUnder 300 words — visitors bounce looking for substance, search engines rank competitors first
Fix: Add a substantive FAQ, product detail, or case-study section
Content is hard to read
+2% bounceGraduate-level reading difficulty — limits the addressable audience for product or blog pages
Fix: Shorten sentences; replace jargon with plain language; target Flesch ease ≥60
No skip-to-content link
+1% bounceKeyboard and screen-reader users must tab through the entire header on every page
Fix: Add a visible-on-focus <a href="#main">Skip to content</a> as the first focusable element
Preliminary CRO audit — each barrier links to the tab with detailed analysis.
$550 investment → $0.06/month returns + USD 157,500 risk avoided
$550
6h · 5 findings
$0.06 /mo
~$0.68 / year
USD 157,500
if kept compliant
$100 — in quick wins — start here for the fastest payback
Figures combine localized regulatory fine ceilings, search/conversion value priced against local CPC, and bandwidth waste estimates. Results depend on implementation quality and audience composition. Not legal or financial advice.
5.5 developer hours at $100/hr
Based on United States rates ($100/hr)
Start here for the best return on investment
$13,125 / month at risk
~$157,501 / year if left unfixed
$157,500
+4 more
$0.06 /mo
705.2 MB/mo × 0.080 USD/GB
Compliance figures represent the statutory maximum fine for the most severe triggered category, capped per regulation — not the sum of per-finding penalties. Based on published regulatory fine ranges. This is not legal advice.
Unique monthly visitors from your analytics
Purchases, signups, or key actions
Optional — for revenue estimation
more engaged visitors from reduced bounce
Fix 5 critical issues to capture this value
Based on Google/Deloitte research ("Milliseconds Make Millions") showing a ~7% bounce rate increase per additional second of LCP above the 2.5s "Good" threshold.
Your site's LCP: → estimated after fixes.
These are estimates based on industry research — actual results vary
Your data stays in your browser — nothing is sent to our servers
Thanks for your feedback!
We'll use a cached audit if available, or offer to scan.
Industry-standard audits powered by Google Lighthouse.
Key metrics that affect user experience.
First Contentful Paint First Contentful Paint — how long until the browser renders the first piece of content. Under 1.8s is good.
1.58 s
Largest Contentful Paint Largest Contentful Paint — how long until the largest visible element loads. Under 2.5s is good.
2.12 s
Total Blocking Time Total Blocking Time — total time the main thread was blocked, preventing user input. Under 200ms is good.
0 ms
Cumulative Layout Shift Cumulative Layout Shift — measures visual stability. How much the page layout shifts during loading. Under 0.1 is good.
0.000
Speed Index Speed Index — how quickly content is visually displayed during load. Under 3.4s is good.
1.58 s
Time to Interactive Time to Interactive — how long until the page is fully interactive and responds to user input. Under 3.8s is good.
2.12 s
Audit breakdown by category with detailed findings.
Remove large, duplicate JavaScript modules from bundles to reduce unnecessary bytes consumed by network activity.
Performance issues directly impact user engagement and conversion rates.
Polyfills and transforms enable older browsers to use new JavaScript features. However, many aren't necessary for modern browsers. Consider modifying your JavaScript build process to not transpile Baseline features, unless you know you must support older browsers. Learn why most sites can deploy ES6+ code without transpiling
Shipping ES5 transpiled code to modern browsers wastes bytes — every user with an evergreen browser pays for compatibility you don't need.
Most users today run browsers that natively support ES6+, async/await, optional chaining, and the rest of modern JavaScript. Transpiling to ES5 'just in case' adds 20-40% to your bundle for no benefit. Configure your build to target a modern browserslist, or ship a differential bundle pair (modern + legacy) with the module/nomodule pattern.
Source: Google web.dev / Lighthouse
3rd party code can significantly impact load performance. Reduce and defer loading of 3rd party code to prioritize your page's content.
Performance issues directly impact user engagement and conversion rates.
Reducing the download time of images can improve the perceived load time of the page and LCP. Learn more about optimizing image size
Performance issues directly impact user engagement and conversion rates.
| URL | Resource Size | Est Savings | |
|---|---|---|---|
div.header > div.title > div.title-image-wrapper > img.title-image div.header > div.title > div.title-image-wrapper > img.title-image | www.wikimedia.org/portal/wikimedia.org/assets/img/wikimedia_logo.png | 59.4 KiB | 59.2 KiB |
Avoid chaining critical requests by reducing the length of chains, reducing the download size of resources, or deferring the download of unnecessary resources to improve page load.
Performance issues directly impact user engagement and conversion rates.
Your first network request is the most important. Reduce its latency by avoiding redirects, ensuring a fast server response, and enabling text compression.
Performance issues directly impact user engagement and conversion rates.
These insights are also available in the Chrome DevTools Performance Panel - record a trace to view more detailed information.
Set an explicit width and height on image elements to reduce layout shifts and improve CLS. Learn how to set image dimensions
Performance issues directly impact user engagement and conversion rates.
| URL | |
|---|---|
body.jsl10n-visible > div.donate-bar > div.donate > img.donate-image body.jsl10n-visible > div.donate-bar > div.donate > img.donate-image | www.wikimedia.org/portal/wikimedia.org/assets/img/puzzle-globe.svg |
More information about the performance of your application. These numbers don't directly affect the Performance score.
Redirects introduce additional delays before the page can be loaded. Learn how to avoid page redirects.
Performance issues directly impact user engagement and conversion rates.
| URL | Time Spent |
|---|---|
| wikimedia.org/ | 759 ms |
| www.wikimedia.org/ | 0.0 ms |
These checks highlight opportunities to improve the accessibility of your web app. Automatic detection can only detect a subset of issues and does not guarantee the accessibility of your web app, so manual testing is also encouraged.
Informative elements should aim for short, descriptive alternate text. Decorative elements can be ignored with an empty alt attribute. Learn more about the `alt` attribute.
Performance issues directly impact user engagement and conversion rates.
| Failing Elements |
|---|
body.jsl10n-visible > div.banner > div.welcome > img.welcome-image body.jsl10n-visible > div.banner > div.welcome > img.welcome-image |
These are opportunities to improve the semantics of the controls in your application. This may enhance the experience for users of assistive technology, like a screen reader.
One main landmark helps screen reader users navigate a web page. Learn more about landmarks.
Performance issues directly impact user engagement and conversion rates.
| Failing Elements |
|---|
html html |
These items highlight common accessibility best practices.
These checks ensure that your page is following basic search engine optimization advice. There are many additional factors Lighthouse does not score here that may affect your search ranking, including performance on Core Web Vitals. Learn more about Google Search Essentials.
Informative elements should aim for short, descriptive alternate text. Decorative elements can be ignored with an empty alt attribute. Learn more about the `alt` attribute.
Performance issues directly impact user engagement and conversion rates.
| Failing Elements |
|---|
body.jsl10n-visible > div.banner > div.welcome > img.welcome-image body.jsl10n-visible > div.banner > div.welcome > img.welcome-image |
Format your HTML in a way that enables crawlers to better understand your app’s content.
Industry-standard audits powered by Google Lighthouse. — Desktop
Key metrics that affect user experience. — Desktop
First Contentful Paint First Contentful Paint — how long until the browser renders the first piece of content. Under 1.8s is good.
436 ms
Largest Contentful Paint Largest Contentful Paint — how long until the largest visible element loads. Under 2.5s is good.
533 ms
Total Blocking Time Total Blocking Time — total time the main thread was blocked, preventing user input. Under 200ms is good.
0 ms
Cumulative Layout Shift Cumulative Layout Shift — measures visual stability. How much the page layout shifts during loading. Under 0.1 is good.
0.000
Speed Index Speed Index — how quickly content is visually displayed during load. Under 3.4s is good.
436 ms
Time to Interactive Time to Interactive — how long until the page is fully interactive and responds to user input. Under 3.8s is good.
533 ms
Audit breakdown by category with detailed findings.
Remove large, duplicate JavaScript modules from bundles to reduce unnecessary bytes consumed by network activity.
Performance issues directly impact user engagement and conversion rates.
Polyfills and transforms enable older browsers to use new JavaScript features. However, many aren't necessary for modern browsers. Consider modifying your JavaScript build process to not transpile Baseline features, unless you know you must support older browsers. Learn why most sites can deploy ES6+ code without transpiling
Shipping ES5 transpiled code to modern browsers wastes bytes — every user with an evergreen browser pays for compatibility you don't need.
Most users today run browsers that natively support ES6+, async/await, optional chaining, and the rest of modern JavaScript. Transpiling to ES5 'just in case' adds 20-40% to your bundle for no benefit. Configure your build to target a modern browserslist, or ship a differential bundle pair (modern + legacy) with the module/nomodule pattern.
Source: Google web.dev / Lighthouse
3rd party code can significantly impact load performance. Reduce and defer loading of 3rd party code to prioritize your page's content.
Performance issues directly impact user engagement and conversion rates.
Reducing the download time of images can improve the perceived load time of the page and LCP. Learn more about optimizing image size
Performance issues directly impact user engagement and conversion rates.
| URL | Resource Size | Est Savings | |
|---|---|---|---|
div.header > div.title > div.title-image-wrapper > img.title-image div.header > div.title > div.title-image-wrapper > img.title-image | www.wikimedia.org/portal/wikimedia.org/assets/img/wikimedia_logo.png | 59.4 KiB | 59.4 KiB |
Optimize LCP by making the LCP image discoverable from the HTML immediately, and avoiding lazy-loading
Performance issues directly impact user engagement and conversion rates.
Avoid chaining critical requests by reducing the length of chains, reducing the download size of resources, or deferring the download of unnecessary resources to improve page load.
Performance issues directly impact user engagement and conversion rates.
Your first network request is the most important. Reduce its latency by avoiding redirects, ensuring a fast server response, and enabling text compression.
Performance issues directly impact user engagement and conversion rates.
These insights are also available in the Chrome DevTools Performance Panel - record a trace to view more detailed information.
Set an explicit width and height on image elements to reduce layout shifts and improve CLS. Learn how to set image dimensions
Performance issues directly impact user engagement and conversion rates.
| URL | |
|---|---|
body.jsl10n-visible > div.donate-bar > div.donate > img.donate-image body.jsl10n-visible > div.donate-bar > div.donate > img.donate-image | www.wikimedia.org/portal/wikimedia.org/assets/img/puzzle-globe.svg |
More information about the performance of your application. These numbers don't directly affect the Performance score.
Redirects introduce additional delays before the page can be loaded. Learn how to avoid page redirects.
Performance issues directly impact user engagement and conversion rates.
| URL | Time Spent |
|---|---|
| wikimedia.org/ | 203 ms |
| www.wikimedia.org/ | 0.0 ms |
These checks highlight opportunities to improve the accessibility of your web app. Automatic detection can only detect a subset of issues and does not guarantee the accessibility of your web app, so manual testing is also encouraged.
Informative elements should aim for short, descriptive alternate text. Decorative elements can be ignored with an empty alt attribute. Learn more about the `alt` attribute.
Performance issues directly impact user engagement and conversion rates.
| Failing Elements |
|---|
body.jsl10n-visible > div.banner > div.welcome > img.welcome-image body.jsl10n-visible > div.banner > div.welcome > img.welcome-image |
These are opportunities to improve the semantics of the controls in your application. This may enhance the experience for users of assistive technology, like a screen reader.
One main landmark helps screen reader users navigate a web page. Learn more about landmarks.
Performance issues directly impact user engagement and conversion rates.
| Failing Elements |
|---|
html html |
These items highlight common accessibility best practices.
These checks ensure that your page is following basic search engine optimization advice. There are many additional factors Lighthouse does not score here that may affect your search ranking, including performance on Core Web Vitals. Learn more about Google Search Essentials.
Informative elements should aim for short, descriptive alternate text. Decorative elements can be ignored with an empty alt attribute. Learn more about the `alt` attribute.
Performance issues directly impact user engagement and conversion rates.
| Failing Elements |
|---|
body.jsl10n-visible > div.banner > div.welcome > img.welcome-image body.jsl10n-visible > div.banner > div.welcome > img.welcome-image |
Format your HTML in a way that enables crawlers to better understand your app’s content.
Send Feedback