

Audit overview
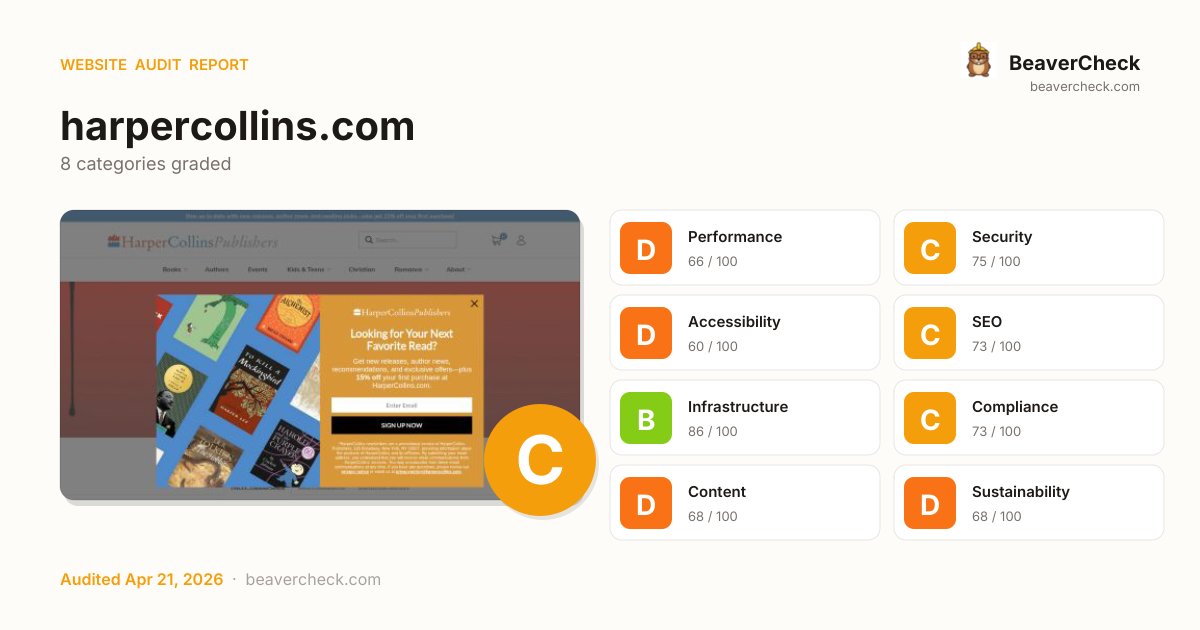
4 categories need attention: Performance, and 3 others.
Fix Priority Matrix
5 findingsQuick Wins
3High impact, low effort — start here.
Strategic
2High impact, requires investment.
Easy Improvements
0Small gains, minimal effort.
Nothing in this quadrant — good news.
Deprioritize
0Low impact, high effort — do last.
Nothing in this quadrant — good news.
Screenshots


Top Priorities (5)
Page weighs 14.5 MB (6.5 MB transferred)
Informational: total page weight (uncompressed) and bytes actually transferred over the wire.
No favicon or icon links detected
Without a favicon, your tab shows a blank icon and bookmarks look unbranded — amateur signal in every browser surface.
is missing width/height — may cause layout shift
Performance issues directly impact user engagement and conversion rates.
588 third-party resources (100% of weight)
Informational: third-party resource count and their share of page weight. High share caps perf gains from frontend optimization.
589 HTTP requests — consider bundling or reducing
High HTTP request count — bundling, sprite-ing, and HTTP/2 server push can reduce per-request overhead.
Business case
What fixing the audit's findings is worth -- and what ignoring them keeps costing.
Return on investment
$650 investment → $3,281/month returns + USD 157,500 risk avoided
Figures combine localized regulatory fine ceilings, search/conversion value priced against local CPC, and bandwidth waste estimates. Results depend on implementation quality and audience composition. Not legal or financial advice.
Conversion barriers
7 barrier(s) likely increasing bounce by ~28%.
- Page takes 23.7s to loadUsers abandon at ~3s — you're 21.2s over the 2.5s threshold→ Optimize render-blocking resources, preload the hero image, and compress images
- Page feels frozen for 5.2sClicks on the primary CTA are ignored while JavaScript runs→ Break up long tasks; defer non-critical JavaScript to post-hydration
- HSTS is enabled but max-age is short (7889238s)First-visit protection is in place, but browsers forget the policy sooner than recommended→ Raise Strict-Transport-Security max-age to at least 31536000 (1 year)
- No Open Graph tagsLinks shared on LinkedIn / Slack / Facebook show bare URLs — referral clicks drop→ Add og:title, og:description, og:image, og:url to the page head
- No structured dataNo rich-result eligibility in Google — lower SERP CTR vs competitors with stars and prices→ Add JSON-LD for your page type (Product, Article, FAQPage, LocalBusiness, …)
Preliminary CRO audit — each barrier links to the tab with detailed analysis.
Remediation cost
Start here for the best return on investment
Cost by category
Cost by effort level
Adjust assumptions
Team composition
Multiplier applied to dev hours to reflect QA, design, and PM overhead. Use Dev only for solo work; Full team for projects with formal review processes.
Rates reflect fully-loaded developer cost including overhead
Warning:Cost of inaction
Compliance Risk
$157,500
- No privacy policy link detectedCCPA/CPRA: USD 2,500 – USD 7,500
- Trackers detected but no cookie policy foundCCPA/CPRA: USD 2,500 – USD 7,500
- Trackers detected but no privacy policy foundCCPA/CPRA: USD 2,500 – USD 7,500
Bounce-Rate Cost
$3,279 /mo
+28.3pp bounce · ~2,827 lost visitors/mo
CPC: USD 1.16
Bandwidth Waste
$1.64 /mo
20473.5 MB/mo × 0.080 USD/GB
- Optimize transfer: save ~2.0 MB per page loadSaves $1.64/mo
Compliance figures represent the statutory maximum fine for the most severe triggered category, capped per regulation — not the sum of per-finding penalties. Based on published regulatory fine ranges. This is not legal advice.
Unique monthly visitors from your analytics
Purchases, signups, or key actions
Optional — for revenue estimation
more engaged visitors from reduced bounce
Fix 2 critical issues to capture this value
How this is calculated
Based on Google/Deloitte research ("Milliseconds Make Millions") showing a ~7% bounce rate increase per additional second of LCP above the 2.5s "Good" threshold.
Your site's LCP: → estimated after fixes.
These are estimates based on industry research — actual results vary
Your data stays in your browser — nothing is sent to our servers
Lighthouse
Mobile
First Contentful Paint First Contentful Paint — how long until the browser renders the first piece of content. Under 1.8s is good.
11.83 s
Largest Contentful Paint Largest Contentful Paint — how long until the largest visible element loads. Under 2.5s is good.
23.67 s
Total Blocking Time Total Blocking Time — total time the main thread was blocked, preventing user input. Under 200ms is good.
5.19 s
Cumulative Layout Shift Cumulative Layout Shift — measures visual stability. How much the page layout shifts during loading. Under 0.1 is good.
0.030
Speed Index Speed Index — how quickly content is visually displayed during load. Under 3.4s is good.
14.88 s
Time to Interactive Time to Interactive — how long until the page is fully interactive and responds to user input. Under 3.8s is good.
33.52 s
Desktop
First Contentful Paint First Contentful Paint — how long until the browser renders the first piece of content. Under 1.8s is good.
951 ms
Largest Contentful Paint Largest Contentful Paint — how long until the largest visible element loads. Under 2.5s is good.
2.91 s
Total Blocking Time Total Blocking Time — total time the main thread was blocked, preventing user input. Under 200ms is good.
258 ms
Cumulative Layout Shift Cumulative Layout Shift — measures visual stability. How much the page layout shifts during loading. Under 0.1 is good.
0.072
Speed Index Speed Index — how quickly content is visually displayed during load. Under 3.4s is good.
8.32 s
Time to Interactive Time to Interactive — how long until the page is fully interactive and responds to user input. Under 3.8s is good.
7.12 s
Categories
8Performance
Page weighs 14.5 MB (6.5 MB transferred)
Security
All checks pass
Accessibility
No favicon or icon links detected
SEO
All checks pass
Infrastructure
All checks pass
Compliance
All checks pass
Content
All checks pass
Sustainability
All checks pass
How you compare
Where this site stands against peers running the same stack.
Top 10% of AngularJS sites score 91+ on Performance; you're at 66 — closing this gap is the highest-leverage improvement.
Technology stack
AngularJS, with Cloudflare CDN
Stack Architecture
 Shopify
  AngularJS
  Cloudflare Turnstile Google Search Console HSTS
  HTTP/3 Proofpoint Cloudflare
 All Detected Technologies (8)
Cloudflare is a web-infrastructure and website-security company, providing content-delivery-network services, DDoS mitigation, Internet security, and distributed domain-name-server services.
AngularJS is a JavaScript-based open-source web application framework led by the Angular Team at Google.
Turnstile is Cloudflare's smart CAPTCHA alternative.
HTTP Strict Transport Security (HSTS) informs browsers that the site should only be accessed using HTTPS.
HTTP/3 is the third major version of the Hypertext Transfer Protocol used to exchange information on the World Wide Web.
Observations (3)
Shopify storefront detected
Shopify handles hosting, SSL, and CDN automatically. Performance optimizations focus on theme code, app scripts, and image optimization. Check the Performance tab for third-party script impact.
No build tool detected
A framework (AngularJS) was detected but no bundler was identified. The build tool may not be detectable from output patterns, or the site may use the framework's built-in bundler.
Complex technology stack detected
8 technologies identified. A complex stack increases maintenance burden and attack surface. Consider whether all components are actively needed.
Show your score
Drop this badge on your README, marketing site, or status page. It auto-updates every time the audit re-runs and links back to this report.

This badge auto-updates with your latest scan result.
[](https://beavercheck.com/sites/harpercollins.com)<a href="https://beavercheck.com/sites/harpercollins.com"><img src="https://beavercheck.com/badge?url=https%3A%2F%2Fharpercollins.com" alt="BeaverCheck Score"></a>https://beavercheck.com/badge?url=https%3A%2F%2Fharpercollins.comExport & share
Download the audit, share with your team, or grab a fix plan ready to copy into your tracker.
Copies markdown to clipboard
Fix Plan
Three-week roadmap to ship the audit's findings, with one-click copy targets for your tracker.
Three-week fix plan
2 sprints · 6h total → projected C (77)
Sprint 1: Quick Wins
+5Highest ROI — low effort, high impact
- · Page weighs 14.5 MB (6.5 MB transferred)
- · No favicon or icon links detected
- · 588 third-party resources (100% of weight)
Sprint 2: Core Fixes
+1Medium effort, high structural impact
- · is missing width/height — may cause layout shift
- · 589 HTTP requests — consider bundling or reducing