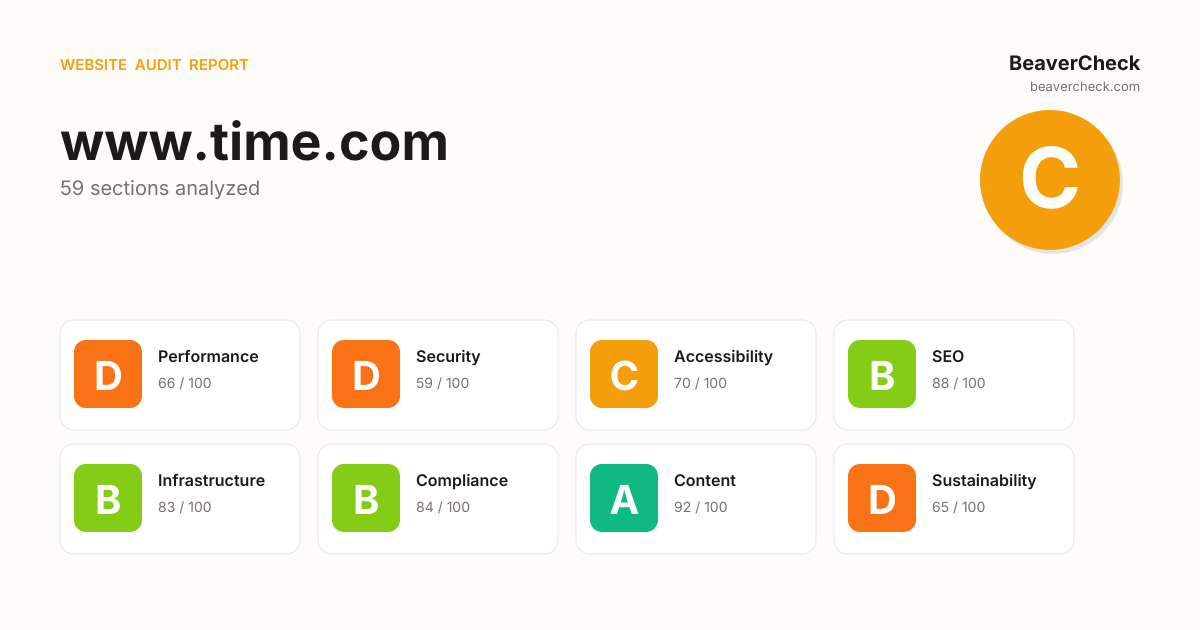
Audit overview
3 categories need attention: Performance, and 2 others.
Fix Priority Matrix
5 findingsQuick Wins
2High impact, low effort — start here.
Strategic
3High impact, requires investment.
Easy Improvements
0Small gains, minimal effort.
Nothing in this quadrant — good news.
Deprioritize
0Low impact, high effort — do last.
Nothing in this quadrant — good news.
Screenshots


Top Priorities (5)
Content-Security-Policy header is missing
Without a CSP, a single XSS bug can exfiltrate everything your users type — including credentials.
HSTS header is missing
Without HSTS, a network attacker can downgrade the very first connection to HTTP and steal the user's session.
No Content-Security-Policy header found
Without a CSP, a single XSS bug can exfiltrate everything users type — credentials, payment data, session tokens.
Page weighs 21.1 MB (4.4 MB transferred)
Informational: total page weight (uncompressed) and bytes actually transferred over the wire.
1 control(s) without accessible label
Form controls without labels — assistive tech announces 'edit text' with no context; users can't complete forms.
Business case
What fixing the audit's findings is worth -- and what ignoring them keeps costing.
Return on investment
€616 investment → €11,534/month returns + EUR 20,500,000 risk avoided
Figures combine localized regulatory fine ceilings, search/conversion value priced against local CPC, and bandwidth waste estimates. Results depend on implementation quality and audience composition. Not legal or financial advice.
Conversion barriers
7 barrier(s) likely increasing bounce by ~28%.
- Page takes 12.2s to loadUsers abandon at ~3s — you're 9.7s over the 2.5s threshold→ Optimize render-blocking resources, preload the hero image, and compress images
- Page feels frozen for 13.8sClicks on the primary CTA are ignored while JavaScript runs→ Break up long tasks; defer non-critical JavaScript to post-hydration
- No HSTS headerReturning visitors are briefly exposed to downgrade attacks on first request→ Set Strict-Transport-Security: max-age=31536000; includeSubDomains
- No Content-Security-Policy headerHigher XSS blast radius — one compromised script can exfiltrate the checkout form→ Ship a reporting-only CSP first, then enforce once violations are clean
- 1 form field(s) without a labelScreen readers skip unlabeled fields; autofill can't identify them; checkout abandonment spikes→ Associate every input with a visible <label for="…">; add autocomplete attributes
Preliminary CRO audit — each barrier links to the tab with detailed analysis.
Remediation cost
Start here for the best return on investment
Cost by category
Cost by effort level
Adjust assumptions
Team composition
Multiplier applied to dev hours to reflect QA, design, and PM overhead. Use Dev only for solo work; Full team for projects with formal review processes.
Rates reflect fully-loaded developer cost including overhead
Warning:Cost of inaction
Compliance Risk
€20.500.000
- Privacy Policy not detectedGDPR: EUR 10.000 – EUR 20.000.000
- 1 of 3 <nav> elements are unlabeledEAA: EUR 1.000 – EUR 500.000
- Heading level skipped: H1 → H3 (missing H2)EAA: EUR 1.000 – EUR 500.000
Bounce-Rate Cost
€9.083 /mo
+28.0pp bounce · ~2,803 lost visitors/mo
CPC: EUR 3.24
Bandwidth Waste
€1,02 /mo
13789.4 MB/mo × 0.074 EUR/GB
- Optimize transfer: save ~1.4 MB per page loadSaves €1,02/mo
Compliance figures represent the statutory maximum fine for the most severe triggered category, capped per regulation — not the sum of per-finding penalties. Based on published regulatory fine ranges. This is not legal advice.
Unique monthly visitors from your analytics
Purchases, signups, or key actions
Optional — for revenue estimation
more engaged visitors from reduced bounce
Fix 5 critical issues to capture this value
How this is calculated
Based on Google/Deloitte research ("Milliseconds Make Millions") showing a ~7% bounce rate increase per additional second of LCP above the 2.5s "Good" threshold.
Your site's LCP: → estimated after fixes.
These are estimates based on industry research — actual results vary
Your data stays in your browser — nothing is sent to our servers
Lighthouse
Mobile
First Contentful Paint First Contentful Paint — how long until the browser renders the first piece of content. Under 1.8s is good.
2.32 s
Largest Contentful Paint Largest Contentful Paint — how long until the largest visible element loads. Under 2.5s is good.
12.23 s
Total Blocking Time Total Blocking Time — total time the main thread was blocked, preventing user input. Under 200ms is good.
13.84 s
Cumulative Layout Shift Cumulative Layout Shift — measures visual stability. How much the page layout shifts during loading. Under 0.1 is good.
0.000
Speed Index Speed Index — how quickly content is visually displayed during load. Under 3.4s is good.
9.00 s
Time to Interactive Time to Interactive — how long until the page is fully interactive and responds to user input. Under 3.8s is good.
31.50 s
Desktop
First Contentful Paint First Contentful Paint — how long until the browser renders the first piece of content. Under 1.8s is good.
650 ms
Largest Contentful Paint Largest Contentful Paint — how long until the largest visible element loads. Under 2.5s is good.
1.42 s
Total Blocking Time Total Blocking Time — total time the main thread was blocked, preventing user input. Under 200ms is good.
2.26 s
Cumulative Layout Shift Cumulative Layout Shift — measures visual stability. How much the page layout shifts during loading. Under 0.1 is good.
0.000
Speed Index Speed Index — how quickly content is visually displayed during load. Under 3.4s is good.
2.10 s
Time to Interactive Time to Interactive — how long until the page is fully interactive and responds to user input. Under 3.8s is good.
6.49 s
Categories
8Performance
Page weighs 21.1 MB (4.4 MB transferred)
Security
Content-Security-Policy header is missing
Accessibility
1 control(s) without accessible label
SEO
All checks pass
Infrastructure
All checks pass
Compliance
All checks pass
Content
All checks pass
Sustainability
All checks pass
How you compare
Where this site stands against peers running the same stack.
Technology stack
Contentstack, on GraphQL, hosted on Next.js, with Fastly CDN
Stack Architecture
 Amazon Advertising
  DoubleClick Floodlight
  DoubleVerify
  Google Analytics
  Google Publisher Tag
  Google Tag Manager
  Integral Ad Science
  Media.net
  Microsoft Clarity
  Nativo
  Parse.ly
  Prebid 9.45.0
 Contentstack
  Apollo 3.14.0
 Goober
  Open Graph
  Priority Hints
  React
React  Tailwind CSS
  Varnish
  Webpack
  core-js 3.44.0
 reCAPTCHA
  GraphQL
  Turbopack
  Fastly
  Next.js 16.2.0 Next.js App Router
 All Detected Technologies (28)
Next.js is a React framework for developing single page Javascript applications.
The Next.js App Router is a new paradigm for building applications using React's latest features.
GraphQL is a query language for APIs and a runtime for fulfilling those queries with your existing data.
Turbopack is an incremental bundler for JavaScript and TypeScript, written in Rust and integrated into the Next.js framework for optimized build performance.
Contentstack is a headless CMS software designed to help businesses deliver personalised content experiences to audiences via multiple channels.
Apollo is a fully-featured caching GraphQL client with integrations for React, Angular, and more.
Goober is a minified CSS-in-JS styling solution.
Open Graph is a protocol that is used to integrate any web page into the social graph.
Priority Hints exposes a mechanism for developers to signal a relative priority for browsers to consider when fetching resources.
React is an open-source JavaScript library for building user interfaces or UI components.
Varnish is a reverse caching proxy.
Webpack is an open-source JavaScript module bundler.
core-js is a modular standard library for JavaScript, with polyfills for cutting-edge ECMAScript features.
reCAPTCHA is a free service from Google that helps protect websites from spam and abuse.
Amazon Advertising (formerly AMS or Amazon Marketing Services) is a service that works in a similar way to pay-per-click ads on Google.
DoubleVerify is a software platform for digital media measurement, data, and analytics.
Google Analytics is a free web analytics service that tracks and reports website traffic.
Google Publisher Tag (GPT) is an ad tagging library for Google Ad Manager which is used to dynamically build ad requests.
Google Tag Manager is a tag management system (TMS) that allows you to quickly and easily update measurement codes and related code fragments collectively known as tags on your website or mobile app.
Integral Ad Science is an American publicly owned technology company that analyses the value of digital advertising placements.
Media.net is an advertising company focused on providing monetization products to digital publishers.
Microsoft's Clarity is a analytics tool which provides website usage statistics, session recording, and heatmaps.
Nativo is an advertising technology provider.
Prebid is an open-source header bidding wrapper. It forms the core of our Nucleus ad platform, helping maximize revenue and performance for publishers.
Observations (2)
No build tool detected
A framework (Apollo) was detected but no bundler was identified. The build tool may not be detectable from output patterns, or the site may use the framework's built-in bundler.
Complex technology stack detected
28 technologies identified. A complex stack increases maintenance burden and attack surface. Consider whether all components are actively needed.
Show your score
Drop this badge on your README, marketing site, or status page. It auto-updates every time the audit re-runs and links back to this report.
This badge auto-updates with your latest scan result.
[](https://beavercheck.com/sites/time.com)<a href="https://beavercheck.com/sites/time.com"><img src="https://beavercheck.com/badge?url=https%3A%2F%2Fwww.time.com" alt="BeaverCheck Score"></a>https://beavercheck.com/badge?url=https%3A%2F%2Fwww.time.comExport & share
Download the audit, share with your team, or grab a fix plan ready to copy into your tracker.
Copies markdown to clipboard
Fix Plan
Three-week roadmap to ship the audit's findings, with one-click copy targets for your tracker.
Three-week fix plan
2 sprints · 7h total → projected B (81)
Sprint 1: Quick Wins
+5Highest ROI — low effort, high impact
- · Page weighs 21.1 MB (4.4 MB transferred)
- · HSTS header is missing
Sprint 2: Core Fixes
+5Medium effort, high structural impact
- · 1 control(s) without accessible label
- · Content-Security-Policy header is missing
- · No Content-Security-Policy header found