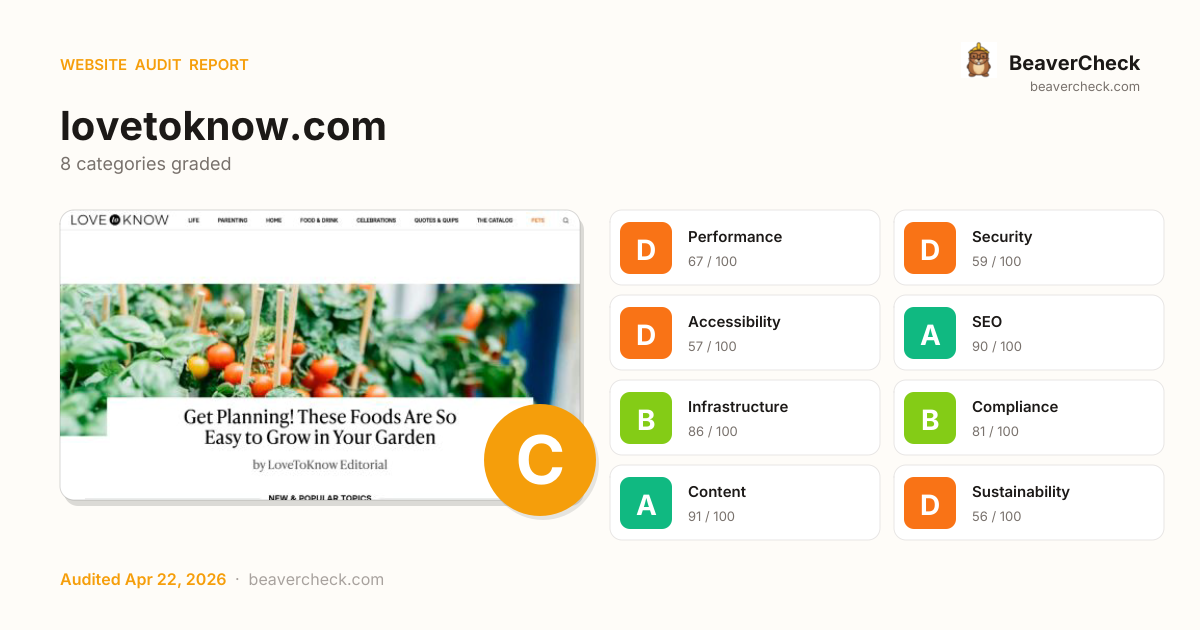
Mobile 375 × 812

Desktop 1440 × 900

Score: 70 / 100
Based on 8 categories, 0 sections
Room to improve — your 24.0s load time is above Google's 2.5s 'Good' threshold.
Several missing protections leave your users and data exposed.
Several issues make your site difficult for assistive technology users.
Well-optimized for search — your content is discoverable.
Solid infrastructure — fast server responses across the board.
Mostly compliant — a few items need attention.
Rich content metadata — your pages look great everywhere.
Heavier than average — reducing page weight saves energy and bandwidth.
The overall score is a weighted average of individual category scores. Categories with more impact on user experience and security carry more weight.
Weights reflect general web best practices. Individual needs may differ.
Content-Security-Policy header is missing
Security gaps expose your site and users to attacks, eroding trust.
HSTS header is missing
Security gaps expose your site and users to attacks, eroding trust.
No Content-Security-Policy header found
Security gaps expose your site and users to attacks, eroding trust.
Page weighs 17.4 MB (5.0 MB transferred)
Performance issues directly impact user engagement and conversion rates.
2 image(s) missing alt attribute
Accessibility issues exclude users with disabilities — up to 15% of your potential audience.
High impact, low effort — start here.
High impact, requires investment.
Small gains, minimal effort.
Nothing in this quadrant — good news.
Low impact, high effort — do last.
Nothing in this quadrant — good news.
[](https://beavercheck.com/results/c093e0d4-bcbb-45a2-a33f-6cfc7e52e896)<a href="https://beavercheck.com/results/c093e0d4-bcbb-45a2-a33f-6cfc7e52e896"><img src="https://beavercheck.com/badge?url=https%3A%2F%2Flovetoknow.com" alt="BeaverCheck Score"></a>https://beavercheck.com/badge?url=https%3A%2F%2Flovetoknow.comThis badge auto-updates with your latest scan result.
Your site performs reasonably well, but a few targeted fixes could meaningfully improve results. Your LCP of 24.0s exceeds Google's 2.5s 'Good' threshold and the 1 performance issue below directly contributes to it. Accessibility issues exclude users who rely on assistive technology — an estimated 15% of your potential audience. Addressing the critical issues below would have the most immediate impact on your user trust.
6 barrier(s) likely increasing bounce by ~26%.
Page takes 24.0s to load
+12% bounceUsers abandon at ~3s — you're 21.5s over the 2.5s threshold
Fix: Optimize render-blocking resources, preload the hero image, and compress images
Page feels frozen for 11.2s
+5% bounceClicks on the primary CTA are ignored while JavaScript runs
Fix: Break up long tasks; defer non-critical JavaScript to post-hydration
No HSTS header
+1% bounceReturning visitors are briefly exposed to downgrade attacks on first request
Fix: Set Strict-Transport-Security: max-age=31536000; includeSubDomains
No Content-Security-Policy header
+1% bounceHigher XSS blast radius — one compromised script can exfiltrate the checkout form
Fix: Ship a reporting-only CSP first, then enforce once violations are clean
No skip-to-content link
+1% bounceKeyboard and screen-reader users must tab through the entire header on every page
Fix: Add a visible-on-focus <a href="#main">Skip to content</a> as the first focusable element
1 broken link(s) on the page
+2% bounceClicks land on 404s — trust drops and the session often ends
Fix: Fix or remove the broken destinations surfaced on the Content tab
Preliminary CRO audit — each barrier links to the tab with detailed analysis.
$500 investment → $1.26/month returns + USD 157,500 risk avoided
$500
5h · 5 findings
$1.26 /mo
~$15 / year
USD 157,500
if kept compliant
$150 — in quick wins — start here for the fastest payback
Figures combine localized regulatory fine ceilings, search/conversion value priced against local CPC, and bandwidth waste estimates. Results depend on implementation quality and audience composition. Not legal or financial advice.
5.0 developer hours at $100/hr
Based on United States rates ($100/hr)
Start here for the best return on investment
$13,126 / month at risk
~$157,515 / year if left unfixed
$157,500
+8 more
$1.26 /mo
15689.6 MB/mo × 0.080 USD/GB
Compliance figures represent the statutory maximum fine for the most severe triggered category, capped per regulation — not the sum of per-finding penalties. Based on published regulatory fine ranges. This is not legal advice.
Unique monthly visitors from your analytics
Purchases, signups, or key actions
Optional — for revenue estimation
more engaged visitors from reduced bounce
Fix 5 critical issues to capture this value
Based on Google/Deloitte research ("Milliseconds Make Millions") showing a ~7% bounce rate increase per additional second of LCP above the 2.5s "Good" threshold.
Your site's LCP: → estimated after fixes.
These are estimates based on industry research — actual results vary
Your data stays in your browser — nothing is sent to our servers
Thanks for your feedback!
We'll use a cached audit if available, or offer to scan.
Industry-standard audits powered by Google Lighthouse.
Key metrics that affect user experience.
First Contentful Paint First Contentful Paint — how long until the browser renders the first piece of content. Under 1.8s is good.
9.12 s
Largest Contentful Paint Largest Contentful Paint — how long until the largest visible element loads. Under 2.5s is good.
24.03 s
Total Blocking Time Total Blocking Time — total time the main thread was blocked, preventing user input. Under 200ms is good.
11.21 s
Cumulative Layout Shift Cumulative Layout Shift — measures visual stability. How much the page layout shifts during loading. Under 0.1 is good.
0.004
Speed Index Speed Index — how quickly content is visually displayed during load. Under 3.4s is good.
15.31 s
Time to Interactive Time to Interactive — how long until the page is fully interactive and responds to user input. Under 3.8s is good.
48.38 s
Audit breakdown by category with detailed findings.
Remove large, duplicate JavaScript modules from bundles to reduce unnecessary bytes consumed by network activity.
Performance issues directly impact user engagement and conversion rates.
Polyfills and transforms enable older browsers to use new JavaScript features. However, many aren't necessary for modern browsers. Consider modifying your JavaScript build process to not transpile Baseline features, unless you know you must support older browsers. Learn why most sites can deploy ES6+ code without transpiling
Shipping ES5 transpiled code to modern browsers wastes bytes — every user with an evergreen browser pays for compatibility you don't need.
Most users today run browsers that natively support ES6+, async/await, optional chaining, and the rest of modern JavaScript. Transpiling to ES5 'just in case' adds 20-40% to your bundle for no benefit. Configure your build to target a modern browserslist, or ship a differential bundle pair (modern + legacy) with the module/nomodule pattern.
Source: Google web.dev / Lighthouse
3rd party code can significantly impact load performance. Reduce and defer loading of 3rd party code to prioritize your page's content.
Performance issues directly impact user engagement and conversion rates.
A long cache lifetime can speed up repeat visits to your page. Learn more about caching.
Performance issues directly impact user engagement and conversion rates.
Your first network request is the most important. Reduce its latency by avoiding redirects, ensuring a fast server response, and enabling text compression.
Performance issues directly impact user engagement and conversion rates.
A forced reflow occurs when JavaScript queries geometric properties (such as offsetWidth) after styles have been invalidated by a change to the DOM state. This can result in poor performance. Learn more about forced reflows and possible mitigations.
Performance issues directly impact user engagement and conversion rates.
Optimize LCP by making the LCP image discoverable from the HTML immediately, and avoiding lazy-loading
Performance issues directly impact user engagement and conversion rates.
Avoid chaining critical requests by reducing the length of chains, reducing the download size of resources, or deferring the download of unnecessary resources to improve page load.
Performance issues directly impact user engagement and conversion rates.
Consider setting font-display to swap or optional to ensure text is consistently visible. swap can be further optimized to mitigate layout shifts with font metric overrides.
Performance issues directly impact user engagement and conversion rates.
Reducing the download time of images can improve the perceived load time of the page and LCP. Learn more about optimizing image size
Performance issues directly impact user engagement and conversion rates.
| URL | Resource Size | Est Savings | |
|---|---|---|---|
5 Lessons My Cabbage Patch Kids Taught Me About Being a Mom figure.image > figure > picture > img | /www/images/std-sm/360089-423x282-Cabbage-Patch-Kids_2211... | 38.1 KiB | 34.5 KiB |
Do You Have Any of These Most Common Heirlooms? figure.image > figure > picture > img | /home/antiques-collectibles/images/std-sm/360667-423x282-... | 31.6 KiB | 26.8 KiB |
We're Shelling Out Our Favorite Taco Sides figure.image > figure > picture > img | cf.ltkcdn.net/cooking/images/std-sm/332005-423x282-carnitas-taco-1349480436.webp | 29.5 KiB | 24.7 KiB |
How Much Is That 2-Dollar Bill Really Worth? figure.image > figure > picture > img | /antiques/images/std-sm/263408-423x272-determine-2-dollar... | 27.2 KiB | 23.5 KiB |
Send Flowers & Save With These Tips figure.image > figure > picture > img | cf.ltkcdn.net/www/images/std-sm/359081-423x282-florist-working_2143226701.webp | 23.5 KiB | 19.9 KiB |
Test Your Knowledge With These April Trivia Questions figure.image > figure > picture > img | /www/images/std-sm/356243-423x282-women-freinds-outdoors_... | 19.9 KiB | 16.3 KiB |
These Veggies Will Grow the Fastest in Your Garden figure.image > figure > picture > img | /garden/images/std-sm/261775-423x272-fastest-growing-frui... | 20.2 KiB | 15.3 KiB |
Family Bonding 101: Small Ways to Grow Closer figure.image > figure > picture > img | /family/images/std-sm/267011-423x272-simple-ideas-spendin... | 19.1 KiB | 14.2 KiB |
Perfect Pregnancy Date Ideas figure.image > figure > picture > img | cf.ltkcdn.net/www/images/std-sm/354456-423x282-pregdate1-531929776.webp | 17.1 KiB | 13.9 KiB |
Easy Ways to Bring Some Spring to Your Home Decor figure.image > figure > picture > img | /home/design-decor/images/std-sm/360426-423x282-spring-ki... | 16.4 KiB | 13.4 KiB |
These Analog Bag Ideas Will Help You Cut Screen Time figure.image > figure > picture > img | /www/images/std-sm/361164-423x282-woman_putting_yarn_in_b... | 15.0 KiB | 12.2 KiB |
HTTP/2 and HTTP/3 offer many benefits over HTTP/1.1, such as multiplexing. Learn more about using modern HTTP.
Performance issues directly impact user engagement and conversion rates.
These insights are also available in the Chrome DevTools Performance Panel - record a trace to view more detailed information.
Time to Interactive is the amount of time it takes for the page to become fully interactive. Learn more about the Time to Interactive metric.
Performance issues directly impact user engagement and conversion rates.
The maximum potential First Input Delay that your users could experience is the duration of the longest task. Learn more about the Maximum Potential First Input Delay metric.
Performance issues directly impact user engagement and conversion rates.
Redirects introduce additional delays before the page can be loaded. Learn how to avoid page redirects.
Performance issues directly impact user engagement and conversion rates.
| URL | Time Spent |
|---|---|
| lovetoknow.com/ | 949 ms |
| www.lovetoknow.com/ | 0.0 ms |
Reduce unused JavaScript and defer loading scripts until they are required to decrease bytes consumed by network activity. Learn how to reduce unused JavaScript.
Multi-megabyte JavaScript bundles delay every interactive feature on the page.
This is the Lighthouse audit fired when too much JS is shipped relative to what executes. The fix isn't a config flag — it requires bundle analysis (webpack-bundle-analyzer, rollup-plugin-visualizer), splitting routes into chunks, lazy-loading off-screen components, and removing unused dependencies. Fundamentally different from minification: minifying reduces byte count, this reduces what's downloaded at all.
Source: Google web.dev / Lighthouse
Consider reducing the time spent parsing, compiling, and executing JS. You may find delivering smaller JS payloads helps with this. Learn how to reduce Javascript execution time.
Performance issues directly impact user engagement and conversion rates.
Consider reducing the time spent parsing, compiling and executing JS. You may find delivering smaller JS payloads helps with this. Learn how to minimize main-thread work
Performance issues directly impact user engagement and conversion rates.
| Category | Time Spent |
|---|---|
| Script Evaluation | 20.7 s |
| Other | 4.0 s |
| Script Parsing & Compilation | 2.1 s |
| Style & Layout | 967 ms |
| Garbage Collection | 635 ms |
| Parse HTML & CSS | 244 ms |
| Rendering | 206 ms |
Many navigations are performed by going back to a previous page, or forwards again. The back/forward cache (bfcache) can speed up these return navigations. Learn more about the bfcache
Performance issues directly impact user engagement and conversion rates.
| Failure reason | Failure type |
|---|---|
| The page has an unload handler in the main frame. | Actionable |
| The page did not finish loading before navigating away. | Not actionable |
Minifying JavaScript files can reduce payload sizes and script parse time. Learn how to minify JavaScript.
Performance issues directly impact user engagement and conversion rates.
| URL | Transfer Size | Est Savings |
|---|---|---|
| launchpad.privacymanager.io/latest/launchpad.bundle.js | 40.3 KiB | 12.7 KiB |
Reduce unused rules from stylesheets and defer CSS not used for above-the-fold content to decrease bytes consumed by network activity. Learn how to reduce unused CSS.
Performance issues directly impact user engagement and conversion rates.
| URL | Transfer Size | Est Savings |
|---|---|---|
| @charset "UTF-8";.buy-button-container{display:flex;flex-direction:column; … } … | 51.8 KiB | 40.4 KiB |
| span.PIN_1776897686080_embed_grid { width: 100%; max-width: 257px; min-width: 140px; … } … | 12.0 KiB | 12.0 KiB |
Large network payloads cost users real money and are highly correlated with long load times. Learn how to reduce payload sizes.
Performance issues directly impact user engagement and conversion rates.
More information about the performance of your application. These numbers don't directly affect the Performance score.
These checks highlight opportunities to improve the accessibility of your web app. Automatic detection can only detect a subset of issues and does not guarantee the accessibility of your web app, so manual testing is also encouraged.
Properly ordered headings that do not skip levels convey the semantic structure of the page, making it easier to navigate and understand when using assistive technologies. Learn more about heading order.
Performance issues directly impact user engagement and conversion rates.
| Failing Elements |
|---|
by LoveToKnow Editorial a.hero-link > section.hero-outer-mobile > div > h3 |
These are opportunities to improve keyboard navigation in your application.
Image natural dimensions should be proportional to the display size and the pixel ratio to maximize image clarity. Learn how to provide responsive images.
Performance issues directly impact user engagement and conversion rates.
| URL | Displayed size | Actual size | Expected size | |
|---|---|---|---|---|
div#IL_SR_AD_CONTAINER > div#IL_SW_HTML_CONT > div#IL_SW_INNER > img.IL_BASE div#IL_SR_AD_CONTAINER > div#IL_SW_HTML_CONT > div#IL_SW_INNER > img.IL_BASE | resources.infolinks.com/static/brands/ChipChick_320x50.jpg | 320 x 50 | 320 x 50 | 480 x 75 |
Deprecated APIs will eventually be removed from the browser. Learn more about deprecated APIs.
Performance issues directly impact user engagement and conversion rates.
| Deprecation / Warning | Source |
|---|---|
| Unload event listeners are deprecated and will be removed. | code.jquery.com/jquery-2.2.0.min.js line 2, col 6066 |
| Synchronous XMLHttpRequest on the main thread is deprecated because of its detrimental effects to the end user's experience. For more help, check https://xhr.spec.whatwg.org/. | cf.ltkcdn.net/2018.185.354/js/ltk.js line 22, col 34 |
| AttributionReporting | |
| Topics | /prebid/9.30.0.js?fork=1&v=bf6611fc0393cee6578a23c9bb5689... line 15, col 33305 |
| SharedStorage | /pagead/managed/js/activeview/current/ufs_web_display.js line 252, col 234 |
Errors logged to the console indicate unresolved problems. They can come from network request failures and other browser concerns. Learn more about this errors in console diagnostic audit
Performance issues directly impact user engagement and conversion rates.
| Source | Description |
|---|---|
/lovetoknow-1r2kdxaraW/lovetoknow.com/prebid-wrapper.js line 1, col 70360 | %cCW display: inline-block; color: #fff; font-size: 9px; background: #61B321; padding: 1px 4px; border-radius: 0; margin-right: 1px; Missing a base prebid mapping for base ".htlad-LTK_Desktop_In_Content" |
/lovetoknow-1r2kdxaraW/lovetoknow.com/prebid-wrapper.js line 1, col 70360 | %cCW display: inline-block; color: #fff; font-size: 9px; background: #61B321; padding: 1px 4px; border-radius: 0; margin-right: 1px; Missing a base prebid mapping for base ".htlad-LTK_Top_Leaderboard" |
Access to fetch at 'https://api.rlcdn.com/api/identity/envelope?pid=1258' from origin 'https://www.lovetoknow.com' has been blocked by CORS policy: No 'Access-Control-Allow-Origin' header is present on the requested resource. | |
Access to XMLHttpRequest at 'https://api.viglink.com/api/ping' from origin 'https://www.lovetoknow.com' has been blocked by CORS policy: No 'Access-Control-Allow-Origin' header is present on the requested resource. | |
Failed to load resource: net::ERR_FAILED | |
Failed to load resource: the server responded with a status of 400 () | |
cmp.inmobi.com/tcfv2/60/cmp2.js?referer=lovetoknow.com line 1, col 551273 | MspaFooterHTMLId not found, inserting text into footer |
These checks ensure that your page is following basic search engine optimization advice. There are many additional factors Lighthouse does not score here that may affect your search ranking, including performance on Core Web Vitals. Learn more about Google Search Essentials.
Industry-standard audits powered by Google Lighthouse. — Desktop
Key metrics that affect user experience. — Desktop
First Contentful Paint First Contentful Paint — how long until the browser renders the first piece of content. Under 1.8s is good.
1.14 s
Largest Contentful Paint Largest Contentful Paint — how long until the largest visible element loads. Under 2.5s is good.
1.28 s
Total Blocking Time Total Blocking Time — total time the main thread was blocked, preventing user input. Under 200ms is good.
1.79 s
Cumulative Layout Shift Cumulative Layout Shift — measures visual stability. How much the page layout shifts during loading. Under 0.1 is good.
0.001
Speed Index Speed Index — how quickly content is visually displayed during load. Under 3.4s is good.
4.14 s
Time to Interactive Time to Interactive — how long until the page is fully interactive and responds to user input. Under 3.8s is good.
16.05 s
Audit breakdown by category with detailed findings.
Remove large, duplicate JavaScript modules from bundles to reduce unnecessary bytes consumed by network activity.
Performance issues directly impact user engagement and conversion rates.
Polyfills and transforms enable older browsers to use new JavaScript features. However, many aren't necessary for modern browsers. Consider modifying your JavaScript build process to not transpile Baseline features, unless you know you must support older browsers. Learn why most sites can deploy ES6+ code without transpiling
Shipping ES5 transpiled code to modern browsers wastes bytes — every user with an evergreen browser pays for compatibility you don't need.
Most users today run browsers that natively support ES6+, async/await, optional chaining, and the rest of modern JavaScript. Transpiling to ES5 'just in case' adds 20-40% to your bundle for no benefit. Configure your build to target a modern browserslist, or ship a differential bundle pair (modern + legacy) with the module/nomodule pattern.
Source: Google web.dev / Lighthouse
3rd party code can significantly impact load performance. Reduce and defer loading of 3rd party code to prioritize your page's content.
Performance issues directly impact user engagement and conversion rates.
Your first network request is the most important. Reduce its latency by avoiding redirects, ensuring a fast server response, and enabling text compression.
Performance issues directly impact user engagement and conversion rates.
A forced reflow occurs when JavaScript queries geometric properties (such as offsetWidth) after styles have been invalidated by a change to the DOM state. This can result in poor performance. Learn more about forced reflows and possible mitigations.
Performance issues directly impact user engagement and conversion rates.
Reducing the download time of images can improve the perceived load time of the page and LCP. Learn more about optimizing image size
Performance issues directly impact user engagement and conversion rates.
| URL | Resource Size | Est Savings | |
|---|---|---|---|
5 Lessons My Cabbage Patch Kids Taught Me About Being a Mom figure.image > figure > picture > img | /www/images/std-sm/360089-423x282-Cabbage-Patch-Kids_2211... | 38.1 KiB | 30.9 KiB |
Do You Have Any of These Most Common Heirlooms? figure.image > figure > picture > img | /home/antiques-collectibles/images/std-sm/360667-423x282-... | 31.6 KiB | 28.1 KiB |
We're Shelling Out Our Favorite Taco Sides figure.image > figure > picture > img | cf.ltkcdn.net/cooking/images/std-sm/332005-423x282-carnitas-taco-1349480436.webp | 29.5 KiB | 26.0 KiB |
How Much Is That 2-Dollar Bill Really Worth? figure.image > figure > picture > img | /antiques/images/std-sm/263408-423x272-determine-2-dollar... | 27.2 KiB | 19.7 KiB |
Here's How to Use Up Your Leftover Frosting figure.image > figure > picture > img | cf.ltkcdn.net/www/images/std-sm/353623-423x282-cake-frosting-1301620927.webp | 25.0 KiB | 17.8 KiB |
April Quotes to Welcome Spring figure.image > figure > picture > img | /family/images/std-sm/316887-423x282-woman-in-garden-spri... | 24.5 KiB | 17.3 KiB |
These Veggies Will Grow the Fastest in Your Garden figure.image > figure > picture > img | /garden/images/std-sm/261775-423x272-fastest-growing-frui... | 20.2 KiB | 16.6 KiB |
Send Flowers & Save With These Tips figure.image > figure > picture > img | cf.ltkcdn.net/www/images/std-sm/359081-423x282-florist-working_2143226701.webp | 23.5 KiB | 16.3 KiB |
Family Bonding 101: Small Ways to Grow Closer figure.image > figure > picture > img | /family/images/std-sm/267011-423x272-simple-ideas-spendin... | 19.1 KiB | 15.5 KiB |
Get Planning! These Foods Are So Easy to Grow in Your Garden figure.image > figure > picture > img | cf.ltkcdn.net/garden/images/hero-lg/261761-1536x461-growing-tomatoes.webp | 60.4 KiB | 13.7 KiB |
Test Your Knowledge With These April Trivia Questions figure.image > figure > picture > img | /www/images/std-sm/356243-423x282-women-freinds-outdoors_... | 19.9 KiB | 12.7 KiB |
Easy Ways to Encourage Good Luck in Your Life figure.image > figure > picture > img | cf.ltkcdn.net/www/images/std-sm/360408-423x282-happy-woman_2476751475.webp | 14.9 KiB | 12.2 KiB |
These Silly Spring Jokes Bring All the Smiles figure.image > figure > picture > img | cf.ltkcdn.net/kids/images/std-sm/304407-423x282-spring-jokes-kids.webp | 19.3 KiB | 12.2 KiB |
Optimize LCP by making the LCP image discoverable from the HTML immediately, and avoiding lazy-loading
Performance issues directly impact user engagement and conversion rates.
Avoid chaining critical requests by reducing the length of chains, reducing the download size of resources, or deferring the download of unnecessary resources to improve page load.
Performance issues directly impact user engagement and conversion rates.
A long cache lifetime can speed up repeat visits to your page. Learn more about caching.
Performance issues directly impact user engagement and conversion rates.
Consider setting font-display to swap or optional to ensure text is consistently visible. swap can be further optimized to mitigate layout shifts with font metric overrides.
Performance issues directly impact user engagement and conversion rates.
HTTP/2 and HTTP/3 offer many benefits over HTTP/1.1, such as multiplexing. Learn more about using modern HTTP.
Performance issues directly impact user engagement and conversion rates.
These insights are also available in the Chrome DevTools Performance Panel - record a trace to view more detailed information.
Time to Interactive is the amount of time it takes for the page to become fully interactive. Learn more about the Time to Interactive metric.
Performance issues directly impact user engagement and conversion rates.
Redirects introduce additional delays before the page can be loaded. Learn how to avoid page redirects.
Performance issues directly impact user engagement and conversion rates.
| URL | Time Spent |
|---|---|
| lovetoknow.com/ | 397 ms |
| www.lovetoknow.com/ | 0.0 ms |
The maximum potential First Input Delay that your users could experience is the duration of the longest task. Learn more about the Maximum Potential First Input Delay metric.
Performance issues directly impact user engagement and conversion rates.
Consider reducing the time spent parsing, compiling, and executing JS. You may find delivering smaller JS payloads helps with this. Learn how to reduce Javascript execution time.
Performance issues directly impact user engagement and conversion rates.
Consider reducing the time spent parsing, compiling and executing JS. You may find delivering smaller JS payloads helps with this. Learn how to minimize main-thread work
Performance issues directly impact user engagement and conversion rates.
| Category | Time Spent |
|---|---|
| Script Evaluation | 12.3 s |
| Other | 1.9 s |
| Script Parsing & Compilation | 664 ms |
| Garbage Collection | 303 ms |
| Style & Layout | 244 ms |
| Rendering | 110 ms |
| Parse HTML & CSS | 92 ms |
Many navigations are performed by going back to a previous page, or forwards again. The back/forward cache (bfcache) can speed up these return navigations. Learn more about the bfcache
Performance issues directly impact user engagement and conversion rates.
| Failure reason | Failure type |
|---|---|
| The page has an unload handler in the main frame. | Actionable |
Minifying JavaScript files can reduce payload sizes and script parse time. Learn how to minify JavaScript.
Performance issues directly impact user engagement and conversion rates.
| URL | Transfer Size | Est Savings |
|---|---|---|
| launchpad.privacymanager.io/latest/launchpad.bundle.js | 40.3 KiB | 12.7 KiB |
Reduce unused rules from stylesheets and defer CSS not used for above-the-fold content to decrease bytes consumed by network activity. Learn how to reduce unused CSS.
Performance issues directly impact user engagement and conversion rates.
| URL | Transfer Size | Est Savings |
|---|---|---|
| @charset "UTF-8";.buy-button-container{display:flex;flex-direction:column; … } … | 51.8 KiB | 41.0 KiB |
| span.PIN_1776897725765_embed_grid { width: 100%; max-width: 257px; min-width: 140px; … } … | 12.0 KiB | 12.0 KiB |
Reduce unused JavaScript and defer loading scripts until they are required to decrease bytes consumed by network activity. Learn how to reduce unused JavaScript.
Multi-megabyte JavaScript bundles delay every interactive feature on the page.
This is the Lighthouse audit fired when too much JS is shipped relative to what executes. The fix isn't a config flag — it requires bundle analysis (webpack-bundle-analyzer, rollup-plugin-visualizer), splitting routes into chunks, lazy-loading off-screen components, and removing unused dependencies. Fundamentally different from minification: minifying reduces byte count, this reduces what's downloaded at all.
Source: Google web.dev / Lighthouse
Large network payloads cost users real money and are highly correlated with long load times. Learn how to reduce payload sizes.
Performance issues directly impact user engagement and conversion rates.
More information about the performance of your application. These numbers don't directly affect the Performance score.
These checks highlight opportunities to improve the accessibility of your web app. Automatic detection can only detect a subset of issues and does not guarantee the accessibility of your web app, so manual testing is also encouraged.
Low-contrast text is difficult or impossible for many users to read. Learn how to provide sufficient color contrast.
Performance issues directly impact user engagement and conversion rates.
| Failing Elements |
|---|
PETS nav#nav2 > ol.supernav-verticals > li.supernav-vertical > a |
These are opportunities to improve the legibility of your content.
Properly ordered headings that do not skip levels convey the semantic structure of the page, making it easier to navigate and understand when using assistive technologies. Learn more about heading order.
Performance issues directly impact user engagement and conversion rates.
| Failing Elements |
|---|
by LoveToKnow Editorial section.hero > div.hero-inner > div > h3 |
These are opportunities to improve keyboard navigation in your application.
Deprecated APIs will eventually be removed from the browser. Learn more about deprecated APIs.
Performance issues directly impact user engagement and conversion rates.
| Deprecation / Warning | Source |
|---|---|
| Unload event listeners are deprecated and will be removed. | code.jquery.com/jquery-2.2.0.min.js line 2, col 6066 |
| Synchronous XMLHttpRequest on the main thread is deprecated because of its detrimental effects to the end user's experience. For more help, check https://xhr.spec.whatwg.org/. | cf.ltkcdn.net/2018.185.354/js/ltk.js line 22, col 34 |
| AttributionReporting | |
| Topics | /prebid/9.30.0.js?fork=1&v=bf6611fc0393cee6578a23c9bb5689... line 15, col 33305 |
| SharedStorage | /pagead/managed/js/activeview/current/ufs_web_display.js line 252, col 234 |
Errors logged to the console indicate unresolved problems. They can come from network request failures and other browser concerns. Learn more about this errors in console diagnostic audit
Performance issues directly impact user engagement and conversion rates.
| Source | Description |
|---|---|
/lovetoknow-1r2kdxaraW/lovetoknow.com/prebid-wrapper.js line 1, col 70360 | %cCW display: inline-block; color: #fff; font-size: 9px; background: #61B321; padding: 1px 4px; border-radius: 0; margin-right: 1px; Missing a base prebid mapping for base ".htlad-LTK_Adhesion" |
/lovetoknow-1r2kdxaraW/lovetoknow.com/prebid-wrapper.js line 1, col 70360 | %cCW display: inline-block; color: #fff; font-size: 9px; background: #61B321; padding: 1px 4px; border-radius: 0; margin-right: 1px; Missing a base prebid mapping for base ".htlad-LTK_Mobile_In_Content" |
Access to fetch at 'https://api.rlcdn.com/api/identity/envelope?pid=1258' from origin 'https://www.lovetoknow.com' has been blocked by CORS policy: No 'Access-Control-Allow-Origin' header is present on the requested resource. | |
Access to XMLHttpRequest at 'https://api.viglink.com/api/ping' from origin 'https://www.lovetoknow.com' has been blocked by CORS policy: No 'Access-Control-Allow-Origin' header is present on the requested resource. | |
Failed to load resource: net::ERR_FAILED | |
Failed to load resource: the server responded with a status of 400 () | |
cmp.inmobi.com/tcfv2/60/cmp2.js?referer=lovetoknow.com line 1, col 551273 | MspaFooterHTMLId not found, inserting text into footer |
Uncaught TypeError: Cannot read properties of null (reading 'postMessage') |
These checks ensure that your page is following basic search engine optimization advice. There are many additional factors Lighthouse does not score here that may affect your search ranking, including performance on Core Web Vitals. Learn more about Google Search Essentials.
Send Feedback