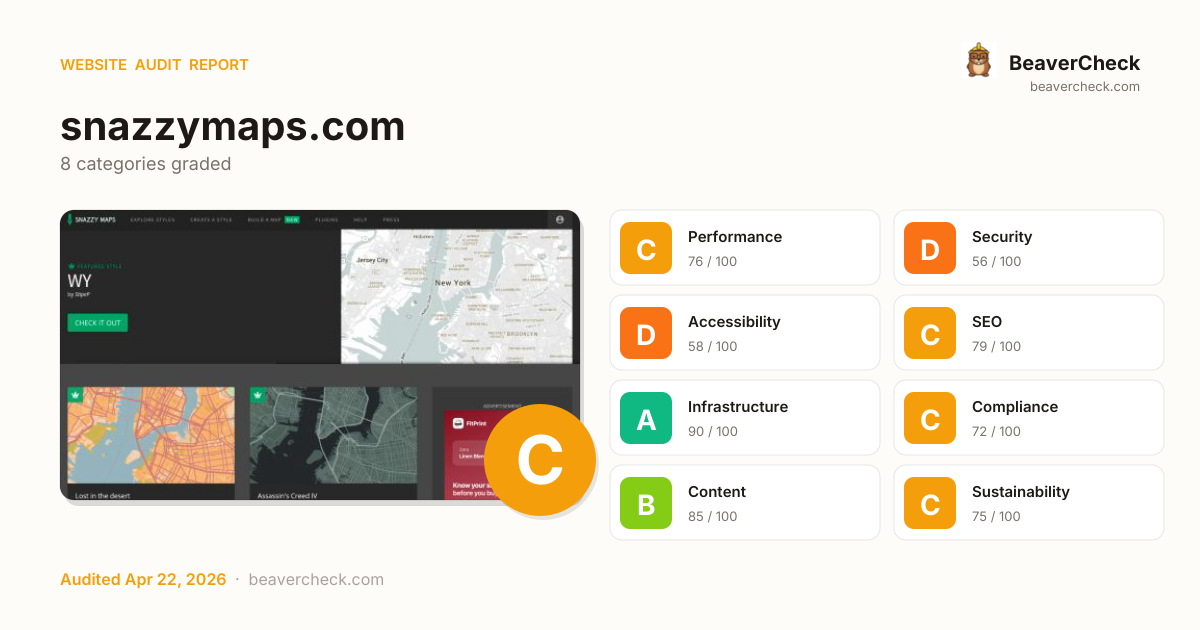
Mobile 375 × 812

Desktop 1440 × 900

Score: 70 / 100
Based on 8 categories, 0 sections
Decent speed, but optimizing further could improve engagement.
Several missing protections leave your users and data exposed.
Several issues make your site difficult for assistive technology users.
Solid SEO basics — a few optimizations could boost rankings.
Solid infrastructure — fast server responses across the board.
Mostly compliant — a few items need attention.
Rich content metadata — your pages look great everywhere.
Reasonable footprint with room for optimization.
The overall score is a weighted average of individual category scores. Categories with more impact on user experience and security carry more weight.
Weights reflect general web best practices. Individual needs may differ.
Content-Security-Policy header is missing
Security gaps expose your site and users to attacks, eroding trust.
Cookie '.AspNetCore.Mvc.CookieTempDataProvider' is missing the Secure flag
Security gaps expose your site and users to attacks, eroding trust.
No Content-Security-Policy header found
Security gaps expose your site and users to attacks, eroding trust.
1 link(s) with no accessible text
Accessibility issues exclude users with disabilities — up to 15% of your potential audience.
10 image-in-link without alt text
Accessibility issues exclude users with disabilities — up to 15% of your potential audience.
High impact, low effort — start here.
High impact, requires investment.
Small gains, minimal effort.
Nothing in this quadrant — good news.
Low impact, high effort — do last.
Nothing in this quadrant — good news.
[](https://beavercheck.com/results/cad1cc4b-4b71-4afb-96be-f575ee9b4d42)<a href="https://beavercheck.com/results/cad1cc4b-4b71-4afb-96be-f575ee9b4d42"><img src="https://beavercheck.com/badge?url=https%3A%2F%2Fsnazzymaps.com" alt="BeaverCheck Score"></a>https://beavercheck.com/badge?url=https%3A%2F%2Fsnazzymaps.comThis badge auto-updates with your latest scan result.
Your site performs reasonably well, but a few targeted fixes could meaningfully improve results. The 3 security gaps leave your users exposed — modern browsers increasingly warn visitors about insecure sites. Addressing the critical issues below would have the most immediate impact on your user trust.
9 barrier(s) likely increasing bounce by ~32%.
Page takes 4.1s to load
+12% bounceUsers abandon at ~3s — you're 1.6s over the 2.5s threshold
Fix: Optimize render-blocking resources, preload the hero image, and compress images
Page feels frozen for 798ms
+5% bounceClicks on the primary CTA are ignored while JavaScript runs
Fix: Break up long tasks; defer non-critical JavaScript to post-hydration
No HSTS header
+1% bounceReturning visitors are briefly exposed to downgrade attacks on first request
Fix: Set Strict-Transport-Security: max-age=31536000; includeSubDomains
No Content-Security-Policy header
+1% bounceHigher XSS blast radius — one compromised script can exfiltrate the checkout form
Fix: Ship a reporting-only CSP first, then enforce once violations are clean
No structured data
+2% bounceNo rich-result eligibility in Google — lower SERP CTR vs competitors with stars and prices
Fix: Add JSON-LD for your page type (Product, Article, FAQPage, LocalBusiness, …)
Thin content
+3% bounceUnder 300 words — visitors bounce looking for substance, search engines rank competitors first
Fix: Add a substantive FAQ, product detail, or case-study section
Content is hard to read
+2% bounceGraduate-level reading difficulty — limits the addressable audience for product or blog pages
Fix: Shorten sentences; replace jargon with plain language; target Flesch ease ≥60
No skip-to-content link
+1% bounceKeyboard and screen-reader users must tab through the entire header on every page
Fix: Add a visible-on-focus <a href="#main">Skip to content</a> as the first focusable element
2 broken link(s) on the page
+3% bounceClicks land on 404s — trust drops and the session often ends
Fix: Fix or remove the broken destinations surfaced on the Content tab
Preliminary CRO audit — each barrier links to the tab with detailed analysis.
$450 investment → $3,079/month returns + USD 157,500 risk avoided
$450
4h · 5 findings
$3,079 /mo
~$36,952 / year
USD 157,500
if kept compliant
$150 — in quick wins — start here for the fastest payback
Figures combine localized regulatory fine ceilings, search/conversion value priced against local CPC, and bandwidth waste estimates. Results depend on implementation quality and audience composition. Not legal or financial advice.
4.5 developer hours at $100/hr
Based on United States rates ($100/hr)
Start here for the best return on investment
$13,125 / month at risk
~$157,505 / year if left unfixed
$157,500
+8 more
$0.43 /mo
5393.9 MB/mo × 0.080 USD/GB
Compliance figures represent the statutory maximum fine for the most severe triggered category, capped per regulation — not the sum of per-finding penalties. Based on published regulatory fine ranges. This is not legal advice.
Unique monthly visitors from your analytics
Purchases, signups, or key actions
Optional — for revenue estimation
more engaged visitors from reduced bounce
Fix 5 critical issues to capture this value
Based on Google/Deloitte research ("Milliseconds Make Millions") showing a ~7% bounce rate increase per additional second of LCP above the 2.5s "Good" threshold.
Your site's LCP: → estimated after fixes.
These are estimates based on industry research — actual results vary
Your data stays in your browser — nothing is sent to our servers
Thanks for your feedback!
We'll use a cached audit if available, or offer to scan.
Industry-standard audits powered by Google Lighthouse.
Key metrics that affect user experience.
First Contentful Paint First Contentful Paint — how long until the browser renders the first piece of content. Under 1.8s is good.
3.61 s
Largest Contentful Paint Largest Contentful Paint — how long until the largest visible element loads. Under 2.5s is good.
4.14 s
Total Blocking Time Total Blocking Time — total time the main thread was blocked, preventing user input. Under 200ms is good.
798 ms
Cumulative Layout Shift Cumulative Layout Shift — measures visual stability. How much the page layout shifts during loading. Under 0.1 is good.
0.000
Speed Index Speed Index — how quickly content is visually displayed during load. Under 3.4s is good.
5.34 s
Time to Interactive Time to Interactive — how long until the page is fully interactive and responds to user input. Under 3.8s is good.
12.33 s
Audit breakdown by category with detailed findings.
Remove large, duplicate JavaScript modules from bundles to reduce unnecessary bytes consumed by network activity.
Performance issues directly impact user engagement and conversion rates.
Polyfills and transforms enable older browsers to use new JavaScript features. However, many aren't necessary for modern browsers. Consider modifying your JavaScript build process to not transpile Baseline features, unless you know you must support older browsers. Learn why most sites can deploy ES6+ code without transpiling
Shipping ES5 transpiled code to modern browsers wastes bytes — every user with an evergreen browser pays for compatibility you don't need.
Most users today run browsers that natively support ES6+, async/await, optional chaining, and the rest of modern JavaScript. Transpiling to ES5 'just in case' adds 20-40% to your bundle for no benefit. Configure your build to target a modern browserslist, or ship a differential bundle pair (modern + legacy) with the module/nomodule pattern.
Source: Google web.dev / Lighthouse
3rd party code can significantly impact load performance. Reduce and defer loading of 3rd party code to prioritize your page's content.
Performance issues directly impact user engagement and conversion rates.
A long cache lifetime can speed up repeat visits to your page. Learn more about caching.
Performance issues directly impact user engagement and conversion rates.
Consider setting font-display to swap or optional to ensure text is consistently visible. swap can be further optimized to mitigate layout shifts with font metric overrides.
Performance issues directly impact user engagement and conversion rates.
A forced reflow occurs when JavaScript queries geometric properties (such as offsetWidth) after styles have been invalidated by a change to the DOM state. This can result in poor performance. Learn more about forced reflows and possible mitigations.
Performance issues directly impact user engagement and conversion rates.
Reducing the download time of images can improve the perceived load time of the page and LCP. Learn more about optimizing image size
Performance issues directly impact user engagement and conversion rates.
| URL | Resource Size | Est Savings | |
|---|---|---|---|
FitPrint - Know your size before you buy div.container-gas > div.gas-medium-rectangle > a > img | snazzymaps.com/images/fitprint-ad-v2.png | 80.7 KiB | 65.3 KiB |
div.col-xs-12 > a.preview-wrapper > span.preview-image > img div.col-xs-12 > a.preview-wrapper > span.preview-image > img | snazzy-maps-cdn.azureedge.net/assets/93-lost-in-the-desert.png?v=20170626082912 | 79.8 KiB | 45.6 KiB |
div.col-xs-12 > a.preview-wrapper > span.preview-image > img div.col-xs-12 > a.preview-wrapper > span.preview-image > img | /assets/72543-assassins-creed-iv.png?v=20170626083519 | 73.0 KiB | 38.8 KiB |
div.preview-wrapper > a.preview-details > span.preview-image > img div.preview-wrapper > a.preview-details > span.preview-image > img | snazzy-maps-cdn.azureedge.net/assets/1243-xxxxxxxxxxx.png?v=20220106114208 | 58.3 KiB | 21.7 KiB |
div.preview-wrapper > a.preview-details > span.preview-image > img div.preview-wrapper > a.preview-details > span.preview-image > img | snazzy-maps-cdn.azureedge.net/assets/639924-t22.png?v=20251031092957 | 57.1 KiB | 20.5 KiB |
div.preview-wrapper > a.preview-details > span.preview-image > img div.preview-wrapper > a.preview-details > span.preview-image > img | snazzy-maps-cdn.azureedge.net/assets/637212-bp-event-map-1.png?v=20250520031647 | 54.0 KiB | 17.4 KiB |
div.preview-wrapper > a.preview-details > span.preview-image > img div.preview-wrapper > a.preview-details > span.preview-image > img | snazzy-maps-cdn.azureedge.net/assets/8097-wy.png?v=20170626083314 | 48.1 KiB | 13.9 KiB |
div.preview-wrapper > a.preview-details > span.preview-image > img div.preview-wrapper > a.preview-details > span.preview-image > img | snazzy-maps-cdn.azureedge.net/assets/661677-kane-map-style.png?v=20251014025143 | 49.6 KiB | 13.0 KiB |
div.preview-wrapper > a.preview-details > span.preview-image > img div.preview-wrapper > a.preview-details > span.preview-image > img | /assets/151-ultra-light-with-labels.png?v=20170626083737 | 43.8 KiB | 9.6 KiB |
Optimize LCP by making the LCP image discoverable from the HTML immediately, and avoiding lazy-loading
Performance issues directly impact user engagement and conversion rates.
HTTP/2 and HTTP/3 offer many benefits over HTTP/1.1, such as multiplexing. Learn more about using modern HTTP.
Performance issues directly impact user engagement and conversion rates.
Avoid chaining critical requests by reducing the length of chains, reducing the download size of resources, or deferring the download of unnecessary resources to improve page load.
Performance issues directly impact user engagement and conversion rates.
Requests are blocking the page's initial render, which may delay LCP. Deferring or inlining can move these network requests out of the critical path.
Performance issues directly impact user engagement and conversion rates.
| URL | Transfer Size | Duration |
|---|---|---|
| snazzymaps.com/js/Home/Index.js | 1.3 KiB | 957 ms |
| snazzymaps.com/build/shared.min.js?v=uU6A0IKMPXbtj64Ygyu6MtQR9m3eDloR6EuBfxqrIzo | 44.3 KiB | 2.2 s |
| snazzymaps.com/build/site.min.css?v=YyHxJ7OEg1CalW1K4HrIuRfR6BEK7koGKb_Fnc6ABj0 | 50.1 KiB | 1.6 s |
| snazzymaps.com/js/Shared/adsense.js | 504 B | 957 ms |
| ajax.googleapis.com/ajax/libs/jquery/2.2.3/jquery.min.js | 30.0 KiB | 1.8 s |
| fonts.googleapis.com/css?family=Source+Sans+Pro:300,400,500,700 | 846 B | 151 ms |
| fonts.googleapis.com/css?family=Open+Sans:400italic,400,300,700 | 2.4 KiB | 757 ms |
These insights are also available in the Chrome DevTools Performance Panel - record a trace to view more detailed information.
Time to Interactive is the amount of time it takes for the page to become fully interactive. Learn more about the Time to Interactive metric.
Performance issues directly impact user engagement and conversion rates.
The maximum potential First Input Delay that your users could experience is the duration of the longest task. Learn more about the Maximum Potential First Input Delay metric.
Performance issues directly impact user engagement and conversion rates.
Reduce unused JavaScript and defer loading scripts until they are required to decrease bytes consumed by network activity. Learn how to reduce unused JavaScript.
Multi-megabyte JavaScript bundles delay every interactive feature on the page.
This is the Lighthouse audit fired when too much JS is shipped relative to what executes. The fix isn't a config flag — it requires bundle analysis (webpack-bundle-analyzer, rollup-plugin-visualizer), splitting routes into chunks, lazy-loading off-screen components, and removing unused dependencies. Fundamentally different from minification: minifying reduces byte count, this reduces what's downloaded at all.
Source: Google web.dev / Lighthouse
| URL | Transfer Size | Est Savings |
|---|---|---|
| /pagead/managed/js/adsense/m202604210101/show_ads_impl_fy... | 177.1 KiB | 109.7 KiB |
| www.googletagmanager.com/gtag/js?id=G-3NM24LZVTH&cx=c&_slc=1 | 150.5 KiB | 61.4 KiB |
| /pagead/managed/js/adsense/m202604210101/reactive_library... | 64.5 KiB | 51.6 KiB |
| snazzymaps.com/build/shared.min.js?v=uU6A0IKMPXbtj64Ygyu6MtQR9m3eDloR6EuBfxqrIzo | 44.0 KiB | 32.2 KiB |
| pagead2.googlesyndication.com/pagead/js/adsbygoogle.js | 54.4 KiB | 20.3 KiB |
Consider reducing the time spent parsing, compiling, and executing JS. You may find delivering smaller JS payloads helps with this. Learn how to reduce Javascript execution time.
Performance issues directly impact user engagement and conversion rates.
| URL | Total CPU Time | Script Evaluation | Script Parse |
|---|---|---|---|
| /pagead/managed/js/adsense/m202604210101/show_ads_impl_fy... | 2.0 s | 1.4 s | 73 ms |
| snazzymaps.com/ | 1.1 s | 46 ms | 3.2 ms |
| Unattributable | 573 ms | 11 ms | 0.0 ms |
| www.googletagmanager.com/gtag/js?id=G-3NM24LZVTH&cx=c&_slc=1 | 389 ms | 306 ms | 70 ms |
| pagead2.googlesyndication.com/pagead/js/adsbygoogle.js | 163 ms | 131 ms | 31 ms |
| /pagead/managed/js/adsense/m202604210101/reactive_library... | 153 ms | 122 ms | 27 ms |
| www.google-analytics.com/analytics.js | 109 ms | 76 ms | 8.3 ms |
| snazzymaps.com/build/shared.min.js?v=uU6A0IKMPXbtj64Ygyu6MtQR9m3eDloR6EuBfxqrIzo | 93 ms | 46 ms | 18 ms |
| ajax.googleapis.com/ajax/libs/jquery/2.2.3/jquery.min.js | 85 ms | 68 ms | 11 ms |
| ep2.adtrafficquality.google/sodar/sodar2.js | 70 ms | 57 ms | 8.6 ms |
Consider reducing the time spent parsing, compiling and executing JS. You may find delivering smaller JS payloads helps with this. Learn how to minimize main-thread work
Performance issues directly impact user engagement and conversion rates.
| Category | Time Spent |
|---|---|
| Script Evaluation | 2.2 s |
| Style & Layout | 1.1 s |
| Other | 880 ms |
| Script Parsing & Compilation | 252 ms |
| Rendering | 155 ms |
| Parse HTML & CSS | 62 ms |
| Garbage Collection | 39 ms |
Reduce unused rules from stylesheets and defer CSS not used for above-the-fold content to decrease bytes consumed by network activity. Learn how to reduce unused CSS.
Performance issues directly impact user engagement and conversion rates.
| URL | Transfer Size | Est Savings |
|---|---|---|
| snazzymaps.com/build/site.min.css?v=YyHxJ7OEg1CalW1K4HrIuRfR6BEK7koGKb_Fnc6ABj0 | 49.7 KiB | 46.7 KiB |
Set an explicit width and height on image elements to reduce layout shifts and improve CLS. Learn how to set image dimensions
Performance issues directly impact user engagement and conversion rates.
| URL | |
|---|---|
Snazzy Maps div.navbar-header > a.navbar-brand > span.brand-text > img | snazzymaps.com/images/logo-text.svg |
Snazzy Maps div.navbar-header > a.navbar-brand > span.brand-icon > img | snazzymaps.com/images/logo-icon.svg |
More information about the performance of your application. These numbers don't directly affect the Performance score.
These checks highlight opportunities to improve the accessibility of your web app. Automatic detection can only detect a subset of issues and does not guarantee the accessibility of your web app, so manual testing is also encouraged.
When a button doesn't have an accessible name, screen readers announce it as "button", making it unusable for users who rely on screen readers. Learn how to make buttons more accessible.
Performance issues directly impact user engagement and conversion rates.
| Failing Elements |
|---|
header.navbar > div.container-fluid > div.navbar-header > button.navbar-toggle header.navbar > div.container-fluid > div.navbar-header > button.navbar-toggle |
Informative elements should aim for short, descriptive alternate text. Decorative elements can be ignored with an empty alt attribute. Learn more about the `alt` attribute.
Performance issues directly impact user engagement and conversion rates.
| Failing Elements |
|---|
div.row > div.col-md-7 > div#map-8097 > img div.row > div.col-md-7 > div#map-8097 > img |
div.col-xs-12 > a.preview-wrapper > span.preview-image > img div.col-xs-12 > a.preview-wrapper > span.preview-image > img |
div.preview-wrapper > a.preview-details > span.preview-image > img div.preview-wrapper > a.preview-details > span.preview-image > img |
Link text (and alternate text for images, when used as links) that is discernible, unique, and focusable improves the navigation experience for screen reader users. Learn how to make links accessible.
Performance issues directly impact user engagement and conversion rates.
| Failing Elements |
|---|
div.row > div.col-md-4 > div.container-brand > a.brand div.row > div.col-md-4 > div.container-brand > a.brand |
These are opportunities to improve the semantics of the controls in your application. This may enhance the experience for users of assistive technology, like a screen reader.
Low-contrast text is difficult or impossible for many users to read. Learn how to provide sufficient color contrast.
Performance issues directly impact user engagement and conversion rates.
| Failing Elements |
|---|
CHECK IT OUT div.featured-main-content > div.row > div.visible-xs > a.btn |
WY div.preview-wrapper > a.preview-details > span.preview-info > span.preview-title |
EXPLORE MORE section.content-padded-y-lg > div.container-fluid > div.clearfix > a.btn |
EXPLORE MORE section.section-sub > div.container-fluid > div.clearfix > a.btn |
Snazzy Maps is a repository of different styles for Google Maps aimed towards w… div.row > div.col-md-4 > div.container-desc > p |
All styles are licensed under creative commons and are completely free to use. div.row > div.col-md-4 > div.container-desc > p |
Read more about us or leave us some feedback. div.row > div.col-md-4 > div.container-desc > p |
Created by Adam Krogh. div.row > div.col-md-4 > div.container-desc > p |
These are opportunities to improve the legibility of your content.
Properly ordered headings that do not skip levels convey the semantic structure of the page, making it easier to navigate and understand when using assistive technologies. Learn more about heading order.
Performance issues directly impact user engagement and conversion rates.
| Failing Elements |
|---|
Tags div.row > div.col-md-8 > div.tags > h4.no-margin-top |
These are opportunities to improve keyboard navigation in your application.
Image display dimensions should match natural aspect ratio. Learn more about image aspect ratio.
Performance issues directly impact user engagement and conversion rates.
| URL | Aspect Ratio (Displayed) | Aspect Ratio (Actual) | |
|---|---|---|---|
div.preview-wrapper > a.preview-details > span.preview-image > img div.preview-wrapper > a.preview-details > span.preview-image > img | snazzy-maps-cdn.azureedge.net/assets/1243-xxxxxxxxxxx.png?v=20220106114208 | 600 x 350 (1.71) | 600 x 375 (1.60) |
div.preview-wrapper > a.preview-details > span.preview-image > img div.preview-wrapper > a.preview-details > span.preview-image > img | snazzy-maps-cdn.azureedge.net/assets/661677-kane-map-style.png?v=20251014025143 | 600 x 350 (1.71) | 600 x 375 (1.60) |
div.preview-wrapper > a.preview-details > span.preview-image > img div.preview-wrapper > a.preview-details > span.preview-image > img | snazzy-maps-cdn.azureedge.net/assets/639924-t22.png?v=20251031092957 | 600 x 350 (1.71) | 600 x 375 (1.60) |
div.preview-wrapper > a.preview-details > span.preview-image > img div.preview-wrapper > a.preview-details > span.preview-image > img | snazzy-maps-cdn.azureedge.net/assets/637212-bp-event-map-1.png?v=20250520031647 | 600 x 350 (1.71) | 600 x 375 (1.60) |
div.preview-wrapper > a.preview-details > span.preview-image > img div.preview-wrapper > a.preview-details > span.preview-image > img | /assets/636571-mars-analog-atlas.png?v=20250516063525 | 600 x 350 (1.71) | 600 x 375 (1.60) |
Errors logged to the console indicate unresolved problems. They can come from network request failures and other browser concerns. Learn more about this errors in console diagnostic audit
Performance issues directly impact user engagement and conversion rates.
| Source | Description |
|---|---|
pagead2.googlesyndication.com/pagead/js/adsbygoogle.js line 161, col 323 | Uncaught TagError: adsbygoogle.push() error: No slot size for availableWidth=0 |
These checks ensure that your page is following basic search engine optimization advice. There are many additional factors Lighthouse does not score here that may affect your search ranking, including performance on Core Web Vitals. Learn more about Google Search Essentials.
Informative elements should aim for short, descriptive alternate text. Decorative elements can be ignored with an empty alt attribute. Learn more about the `alt` attribute.
Performance issues directly impact user engagement and conversion rates.
| Failing Elements |
|---|
div.row > div.col-md-7 > div#map-8097 > img div.row > div.col-md-7 > div#map-8097 > img |
div.col-xs-12 > a.preview-wrapper > span.preview-image > img div.col-xs-12 > a.preview-wrapper > span.preview-image > img |
div.preview-wrapper > a.preview-details > span.preview-image > img div.preview-wrapper > a.preview-details > span.preview-image > img |
Format your HTML in a way that enables crawlers to better understand your app’s content.
Industry-standard audits powered by Google Lighthouse. — Desktop
Key metrics that affect user experience. — Desktop
First Contentful Paint First Contentful Paint — how long until the browser renders the first piece of content. Under 1.8s is good.
1.79 s
Largest Contentful Paint Largest Contentful Paint — how long until the largest visible element loads. Under 2.5s is good.
1.88 s
Total Blocking Time Total Blocking Time — total time the main thread was blocked, preventing user input. Under 200ms is good.
23 ms
Cumulative Layout Shift Cumulative Layout Shift — measures visual stability. How much the page layout shifts during loading. Under 0.1 is good.
0.011
Speed Index Speed Index — how quickly content is visually displayed during load. Under 3.4s is good.
2.65 s
Time to Interactive Time to Interactive — how long until the page is fully interactive and responds to user input. Under 3.8s is good.
3.59 s
Audit breakdown by category with detailed findings.
Remove large, duplicate JavaScript modules from bundles to reduce unnecessary bytes consumed by network activity.
Performance issues directly impact user engagement and conversion rates.
Polyfills and transforms enable older browsers to use new JavaScript features. However, many aren't necessary for modern browsers. Consider modifying your JavaScript build process to not transpile Baseline features, unless you know you must support older browsers. Learn why most sites can deploy ES6+ code without transpiling
Shipping ES5 transpiled code to modern browsers wastes bytes — every user with an evergreen browser pays for compatibility you don't need.
Most users today run browsers that natively support ES6+, async/await, optional chaining, and the rest of modern JavaScript. Transpiling to ES5 'just in case' adds 20-40% to your bundle for no benefit. Configure your build to target a modern browserslist, or ship a differential bundle pair (modern + legacy) with the module/nomodule pattern.
Source: Google web.dev / Lighthouse
3rd party code can significantly impact load performance. Reduce and defer loading of 3rd party code to prioritize your page's content.
Performance issues directly impact user engagement and conversion rates.
A long cache lifetime can speed up repeat visits to your page. Learn more about caching.
Performance issues directly impact user engagement and conversion rates.
Consider setting font-display to swap or optional to ensure text is consistently visible. swap can be further optimized to mitigate layout shifts with font metric overrides.
Performance issues directly impact user engagement and conversion rates.
A forced reflow occurs when JavaScript queries geometric properties (such as offsetWidth) after styles have been invalidated by a change to the DOM state. This can result in poor performance. Learn more about forced reflows and possible mitigations.
Performance issues directly impact user engagement and conversion rates.
Optimize LCP by making the LCP image discoverable from the HTML immediately, and avoiding lazy-loading
Performance issues directly impact user engagement and conversion rates.
HTTP/2 and HTTP/3 offer many benefits over HTTP/1.1, such as multiplexing. Learn more about using modern HTTP.
Performance issues directly impact user engagement and conversion rates.
Avoid chaining critical requests by reducing the length of chains, reducing the download size of resources, or deferring the download of unnecessary resources to improve page load.
Performance issues directly impact user engagement and conversion rates.
Requests are blocking the page's initial render, which may delay LCP. Deferring or inlining can move these network requests out of the critical path.
Performance issues directly impact user engagement and conversion rates.
| URL | Transfer Size | Duration |
|---|---|---|
| snazzymaps.com/js/Home/Index.js | 1.3 KiB | 632 ms |
| snazzymaps.com/build/shared.min.js?v=uU6A0IKMPXbtj64Ygyu6MtQR9m3eDloR6EuBfxqrIzo | 44.3 KiB | 1.1 s |
| snazzymaps.com/build/site.min.css?v=YyHxJ7OEg1CalW1K4HrIuRfR6BEK7koGKb_Fnc6ABj0 | 50.1 KiB | 632 ms |
| snazzymaps.com/js/Shared/adsense.js | 504 B | 632 ms |
| ajax.googleapis.com/ajax/libs/jquery/2.2.3/jquery.min.js | 30.0 KiB | 372 ms |
| fonts.googleapis.com/css?family=Source+Sans+Pro:300,400,500,700 | 869 B | |
| fonts.googleapis.com/css?family=Open+Sans:400italic,400,300,700 | 2.4 KiB | 209 ms |
Reducing the download time of images can improve the perceived load time of the page and LCP. Learn more about optimizing image size
Performance issues directly impact user engagement and conversion rates.
| URL | Resource Size | Est Savings | |
|---|---|---|---|
FitPrint - Know your size before you buy div.container-gas > div.gas-medium-rectangle > a > img | snazzymaps.com/images/fitprint-ad-v2.png | 80.7 KiB | 75.7 KiB |
CREATE A STYLE div.navbar-left > ul.nav > li > a | /189815/5900093/FY26Q1_DC_AcrobatDC_AcrobatStudio_GH_EN_A... | 59.1 KiB | 48.5 KiB |
div.col-xs-12 > a.preview-wrapper > span.preview-image > img div.col-xs-12 > a.preview-wrapper > span.preview-image > img | snazzy-maps-cdn.azureedge.net/assets/93-lost-in-the-desert.png?v=20170626082912 | 79.8 KiB | 45.6 KiB |
div.col-xs-12 > a.preview-wrapper > span.preview-image > img div.col-xs-12 > a.preview-wrapper > span.preview-image > img | /assets/72543-assassins-creed-iv.png?v=20170626083519 | 73.0 KiB | 38.8 KiB |
div.preview-wrapper > a.preview-details > span.preview-image > img div.preview-wrapper > a.preview-details > span.preview-image > img | snazzy-maps-cdn.azureedge.net/assets/1243-xxxxxxxxxxx.png?v=20220106114208 | 58.3 KiB | 24.1 KiB |
div.preview-wrapper > a.preview-details > span.preview-image > img div.preview-wrapper > a.preview-details > span.preview-image > img | snazzy-maps-cdn.azureedge.net/assets/639924-t22.png?v=20251031092957 | 57.1 KiB | 22.9 KiB |
div.preview-wrapper > a.preview-details > span.preview-image > img div.preview-wrapper > a.preview-details > span.preview-image > img | snazzy-maps-cdn.azureedge.net/assets/637212-bp-event-map-1.png?v=20250520031647 | 54.0 KiB | 19.8 KiB |
div.preview-wrapper > a.preview-details > span.preview-image > img div.preview-wrapper > a.preview-details > span.preview-image > img | snazzy-maps-cdn.azureedge.net/assets/661677-kane-map-style.png?v=20251014025143 | 49.6 KiB | 15.4 KiB |
div.preview-wrapper > a.preview-details > span.preview-image > img div.preview-wrapper > a.preview-details > span.preview-image > img | snazzy-maps-cdn.azureedge.net/assets/8097-wy.png?v=20170626083314 | 48.1 KiB | 13.9 KiB |
div.preview-wrapper > a.preview-details > span.preview-image > img div.preview-wrapper > a.preview-details > span.preview-image > img | /assets/151-ultra-light-with-labels.png?v=20170626083737 | 43.8 KiB | 9.6 KiB |
4439909 9286 div.preview-wrapper > a.preview-details > span.preview-info > span.preview-stats | secure.flashtalking.com/oba/icon/consumer-privacy-logo.png | 5.8 KiB | 5.8 KiB |
These insights are also available in the Chrome DevTools Performance Panel - record a trace to view more detailed information.
Time to Interactive is the amount of time it takes for the page to become fully interactive. Learn more about the Time to Interactive metric.
Performance issues directly impact user engagement and conversion rates.
Reduce unused rules from stylesheets and defer CSS not used for above-the-fold content to decrease bytes consumed by network activity. Learn how to reduce unused CSS.
Performance issues directly impact user engagement and conversion rates.
| URL | Transfer Size | Est Savings |
|---|---|---|
| snazzymaps.com/build/site.min.css?v=YyHxJ7OEg1CalW1K4HrIuRfR6BEK7koGKb_Fnc6ABj0 | 49.8 KiB | 45.6 KiB |
Reduce unused JavaScript and defer loading scripts until they are required to decrease bytes consumed by network activity. Learn how to reduce unused JavaScript.
Multi-megabyte JavaScript bundles delay every interactive feature on the page.
This is the Lighthouse audit fired when too much JS is shipped relative to what executes. The fix isn't a config flag — it requires bundle analysis (webpack-bundle-analyzer, rollup-plugin-visualizer), splitting routes into chunks, lazy-loading off-screen components, and removing unused dependencies. Fundamentally different from minification: minifying reduces byte count, this reduces what's downloaded at all.
Source: Google web.dev / Lighthouse
| URL | Transfer Size | Est Savings |
|---|---|---|
| /pagead/managed/js/adsense/m202604200101/show_ads_impl_fy... | 177.5 KiB | 108.0 KiB |
| www.googletagmanager.com/gtag/js?id=G-3NM24LZVTH&cx=c&_slc=1 | 150.5 KiB | 62.2 KiB |
| /pagead/managed/js/adsense/m202604200101/reactive_library... | 64.4 KiB | 44.2 KiB |
| snazzymaps.com/build/shared.min.js?v=uU6A0IKMPXbtj64Ygyu6MtQR9m3eDloR6EuBfxqrIzo | 44.0 KiB | 32.2 KiB |
Many navigations are performed by going back to a previous page, or forwards again. The back/forward cache (bfcache) can speed up these return navigations. Learn more about the bfcache
Performance issues directly impact user engagement and conversion rates.
| Failure reason | Failure type |
|---|---|
| The page has an unload handler in a sub frame. | Actionable |
Set an explicit width and height on image elements to reduce layout shifts and improve CLS. Learn how to set image dimensions
Performance issues directly impact user engagement and conversion rates.
| URL | |
|---|---|
Snazzy Maps div.navbar-header > a.navbar-brand > span.brand-text > img | snazzymaps.com/images/logo-text.svg |
li.user-account > div.user-settings-wrapper > button.user-links-toggle > img li.user-account > div.user-settings-wrapper > button.user-links-toggle > img | snazzymaps.com/Images/icon-account-circle.svg |
Snazzy Maps div.navbar-header > a.navbar-brand > span.brand-icon > img | snazzymaps.com/images/logo-icon.svg |
More information about the performance of your application. These numbers don't directly affect the Performance score.
These checks highlight opportunities to improve the accessibility of your web app. Automatic detection can only detect a subset of issues and does not guarantee the accessibility of your web app, so manual testing is also encouraged.
When a button doesn't have an accessible name, screen readers announce it as "button", making it unusable for users who rely on screen readers. Learn how to make buttons more accessible.
Performance issues directly impact user engagement and conversion rates.
| Failing Elements |
|---|
ul.nav > li.user-account > div.user-settings-wrapper > button.user-links-toggle ul.nav > li.user-account > div.user-settings-wrapper > button.user-links-toggle |
Informative elements should aim for short, descriptive alternate text. Decorative elements can be ignored with an empty alt attribute. Learn more about the `alt` attribute.
Performance issues directly impact user engagement and conversion rates.
| Failing Elements |
|---|
li.user-account > div.user-settings-wrapper > button.user-links-toggle > img li.user-account > div.user-settings-wrapper > button.user-links-toggle > img |
div.row > div.col-md-7 > div#map-8097 > img div.row > div.col-md-7 > div#map-8097 > img |
div.col-xs-12 > a.preview-wrapper > span.preview-image > img div.col-xs-12 > a.preview-wrapper > span.preview-image > img |
div.preview-wrapper > a.preview-details > span.preview-image > img div.preview-wrapper > a.preview-details > span.preview-image > img |
Link text (and alternate text for images, when used as links) that is discernible, unique, and focusable improves the navigation experience for screen reader users. Learn how to make links accessible.
Performance issues directly impact user engagement and conversion rates.
| Failing Elements |
|---|
div.row > div.col-md-4 > div.container-brand > a.brand div.row > div.col-md-4 > div.container-brand > a.brand |
These are opportunities to improve the semantics of the controls in your application. This may enhance the experience for users of assistive technology, like a screen reader.
Low-contrast text is difficult or impossible for many users to read. Learn how to provide sufficient color contrast.
Performance issues directly impact user engagement and conversion rates.
| Failing Elements |
|---|
NEW ul.nav > li > a > span.label-new |
CHECK IT OUT div.row > div.col-md-5 > div.content-vertcenter > a.btn |
EXPLORE MORE section.content-padded-y-lg > div.container-fluid > div.clearfix > a.btn |
Kane Map Style div.preview-wrapper > a.preview-details > span.preview-info > span.preview-title |
T22 div.preview-wrapper > a.preview-details > span.preview-info > span.preview-title |
BP Event Map 1 div.preview-wrapper > a.preview-details > span.preview-info > span.preview-title |
Mars Analog Atlas div.preview-wrapper > a.preview-details > span.preview-info > span.preview-title |
Snazzy Maps is a repository of different styles for Google Maps aimed towards w… div.row > div.col-md-4 > div.container-desc > p |
All styles are licensed under creative commons and are completely free to use. div.row > div.col-md-4 > div.container-desc > p |
Read more about us or leave us some feedback. div.row > div.col-md-4 > div.container-desc > p |
Created by Adam Krogh. div.row > div.col-md-4 > div.container-desc > p |
Tags div.row > div.col-md-8 > div.tags > h4.no-margin-top |
Colors div.row > div.col-md-8 > div.colors > h4.no-margin-top |
These are opportunities to improve the legibility of your content.
Properly ordered headings that do not skip levels convey the semantic structure of the page, making it easier to navigate and understand when using assistive technologies. Learn more about heading order.
Performance issues directly impact user engagement and conversion rates.
| Failing Elements |
|---|
Tags div.row > div.col-md-8 > div.tags > h4.no-margin-top |
These are opportunities to improve keyboard navigation in your application.
Image display dimensions should match natural aspect ratio. Learn more about image aspect ratio.
Performance issues directly impact user engagement and conversion rates.
| URL | Aspect Ratio (Displayed) | Aspect Ratio (Actual) | |
|---|---|---|---|
div.preview-wrapper > a.preview-details > span.preview-image > img div.preview-wrapper > a.preview-details > span.preview-image > img | snazzy-maps-cdn.azureedge.net/assets/1243-xxxxxxxxxxx.png?v=20220106114208 | 600 x 350 (1.71) | 600 x 375 (1.60) |
div.preview-wrapper > a.preview-details > span.preview-image > img div.preview-wrapper > a.preview-details > span.preview-image > img | snazzy-maps-cdn.azureedge.net/assets/661677-kane-map-style.png?v=20251014025143 | 600 x 350 (1.71) | 600 x 375 (1.60) |
div.preview-wrapper > a.preview-details > span.preview-image > img div.preview-wrapper > a.preview-details > span.preview-image > img | snazzy-maps-cdn.azureedge.net/assets/639924-t22.png?v=20251031092957 | 600 x 350 (1.71) | 600 x 375 (1.60) |
div.preview-wrapper > a.preview-details > span.preview-image > img div.preview-wrapper > a.preview-details > span.preview-image > img | snazzy-maps-cdn.azureedge.net/assets/637212-bp-event-map-1.png?v=20250520031647 | 600 x 350 (1.71) | 600 x 375 (1.60) |
div.preview-wrapper > a.preview-details > span.preview-image > img div.preview-wrapper > a.preview-details > span.preview-image > img | /assets/636571-mars-analog-atlas.png?v=20250516063525 | 600 x 350 (1.71) | 600 x 375 (1.60) |
These checks ensure that your page is following basic search engine optimization advice. There are many additional factors Lighthouse does not score here that may affect your search ranking, including performance on Core Web Vitals. Learn more about Google Search Essentials.
Informative elements should aim for short, descriptive alternate text. Decorative elements can be ignored with an empty alt attribute. Learn more about the `alt` attribute.
Performance issues directly impact user engagement and conversion rates.
| Failing Elements |
|---|
li.user-account > div.user-settings-wrapper > button.user-links-toggle > img li.user-account > div.user-settings-wrapper > button.user-links-toggle > img |
div.row > div.col-md-7 > div#map-8097 > img div.row > div.col-md-7 > div#map-8097 > img |
div.col-xs-12 > a.preview-wrapper > span.preview-image > img div.col-xs-12 > a.preview-wrapper > span.preview-image > img |
div.preview-wrapper > a.preview-details > span.preview-image > img div.preview-wrapper > a.preview-details > span.preview-image > img |
Format your HTML in a way that enables crawlers to better understand your app’s content.
Send Feedback