Spain · Madrid Completed: Apr 7, 2026 20:04 UTC
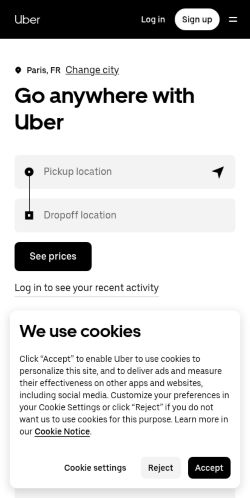
Mobile 375 × 812
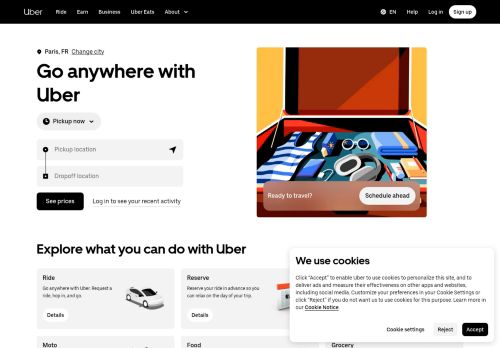
Desktop 1440 × 900
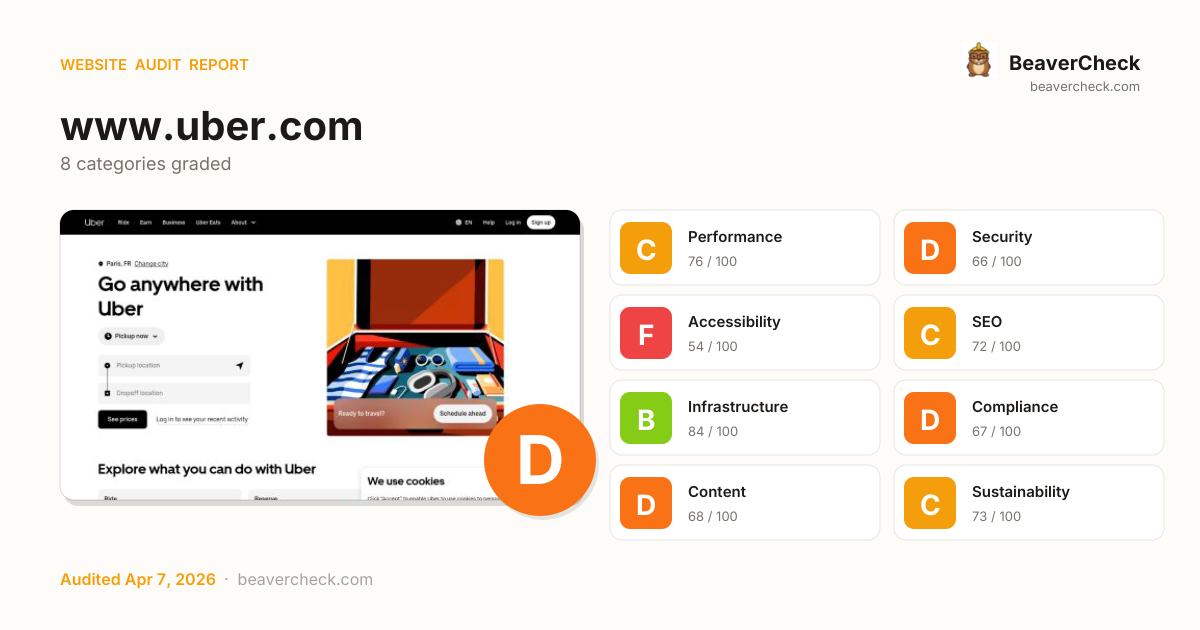
Score: 69 / 100
Based on 8 categories, 0 sections
The overall score is a weighted average of individual category scores. Categories with more impact on user experience and security carry more weight.
Weights reflect general web best practices. Individual needs may differ.
Content-Security-Policy header is missing
No Content-Security-Policy header found
No <main> landmark found
Cookie 'jwt-session' has no SameSite attribute
Cookie 'marketing_vistor_id' has no SameSite attribute
[](https://beavercheck.com/results/cff9bcc6-a055-acbc-d3db-333d02de6047)<a href="https://beavercheck.com/results/cff9bcc6-a055-acbc-d3db-333d02de6047"><img src="https://beavercheck.com/badge?url=https%3A%2F%2Fwww.uber.com" alt="BeaverCheck Score"></a>https://beavercheck.com/badge?url=https%3A%2F%2Fwww.uber.comThis badge auto-updates with your latest scan result.
Thanks for your feedback!
Industry-standard audits powered by Google Lighthouse.
Key metrics that affect user experience.
First Contentful Paint First Contentful Paint — how long until the browser renders the first piece of content. Under 1.8s is good.
7.70 s
Largest Contentful Paint Largest Contentful Paint — how long until the largest visible element loads. Under 2.5s is good.
13.96 s
Total Blocking Time Total Blocking Time — total time the main thread was blocked, preventing user input. Under 200ms is good.
1.33 s
Cumulative Layout Shift Cumulative Layout Shift — measures visual stability. How much the page layout shifts during loading. Under 0.1 is good.
0.001
Speed Index Speed Index — how quickly content is visually displayed during load. Under 3.4s is good.
7.70 s
Time to Interactive Time to Interactive — how long until the page is fully interactive and responds to user input. Under 3.8s is good.
14.29 s
Audit breakdown by category with detailed findings.
Remove large, duplicate JavaScript modules from bundles to reduce unnecessary bytes consumed by network activity.
Polyfills and transforms enable older browsers to use new JavaScript features. However, many aren't necessary for modern browsers. Consider modifying your JavaScript build process to not transpile Baseline features, unless you know you must support older browsers. Learn why most sites can deploy ES6+ code without transpiling
3rd party code can significantly impact load performance. Reduce and defer loading of 3rd party code to prioritize your page's content.
A long cache lifetime can speed up repeat visits to your page. Learn more about caching.
Your first network request is the most important. Reduce its latency by avoiding redirects, ensuring a fast server response, and enabling text compression.
Reducing the download time of images can improve the perceived load time of the page and LCP. Learn more about optimizing image size
| URL | Resource Size | Est Savings | |
|---|---|---|---|
div.css-eleJdh > div > picture > img.css-ZwMiT div.css-eleJdh > div > picture > img.css-ZwMiT | /image-proc/crop/resizecrop/udam/format=auto/width=1104/h... | 866.2 KiB | 800.2 KiB |
| d1a3f4spazzrp4.cloudfront.net/car-types/haloProductImages/v1.1/ParisMoto.png | 71.1 KiB | 50.0 KiB | |
div.css-eleJdh > div > picture > img.css-ZwMiT div.css-eleJdh > div > picture > img.css-ZwMiT | /image-proc/crop/resizecrop/udam/format=auto/width=1104/h... | 68.0 KiB | 45.3 KiB |
Each subpart has specific improvement strategies. Ideally, most of the LCP time should be spent on loading the resources, not within delays.
Avoid chaining critical requests by reducing the length of chains, reducing the download size of resources, or deferring the download of unnecessary resources to improve page load.
These insights are also available in the Chrome DevTools Performance Panel - record a trace to view more detailed information.
The maximum potential First Input Delay that your users could experience is the duration of the longest task. Learn more about the Maximum Potential First Input Delay metric.
Redirects introduce additional delays before the page can be loaded. Learn how to avoid page redirects.
| URL | Time Spent |
|---|---|
| www.uber.com/ | 836 ms |
| www.uber.com/fr/en/ | 0.0 ms |
Keep the server response time for the main document short because all other requests depend on it. Learn more about the Time to First Byte metric.
| URL | Time Spent |
|---|---|
| www.uber.com/fr/en/ | 754 ms |
Time to Interactive is the amount of time it takes for the page to become fully interactive. Learn more about the Time to Interactive metric.
Reduce unused JavaScript and defer loading scripts until they are required to decrease bytes consumed by network activity. Learn how to reduce unused JavaScript.
| URL | Transfer Size | Est Savings |
|---|---|---|
| www.uber.com/_static/client-main-af165af41dd15219.js | 388.2 KiB | 235.1 KiB |
| www.uber.com/_static/client-8708-353544d5ef8de5b9.js | 279.8 KiB | 218.7 KiB |
| www.uber.com/_static/client-vendor-61e4c4f1e391a01d.js | 174.8 KiB | 77.9 KiB |
| accounts.google.com/gsi/client | 92.7 KiB | 77.2 KiB |
| www.uber.com/_static/client-450-bfe15bf1cd6fa2b9.js | 94.6 KiB | 51.5 KiB |
| www.uber.com/_static/client-5122-56789282ad38667f.js | 35.9 KiB | 25.2 KiB |
| www.uber.com/_static/client-6557-009cc196b55e3405.js | 43.0 KiB | 23.1 KiB |
| www.uber.com/_static/client-3265-65fce3dcb4176869.js | 29.6 KiB | 20.7 KiB |
| tags.tiqcdn.com/utag/uber/main/prod/utag.js | 35.8 KiB | 20.3 KiB |
Consider reducing the time spent parsing, compiling, and executing JS. You may find delivering smaller JS payloads helps with this. Learn how to reduce Javascript execution time.
| URL | Total CPU Time | Script Evaluation | Script Parse |
|---|---|---|---|
| www.uber.com/_static/client-vendor-61e4c4f1e391a01d.js | 5.4 s | 4.9 s | 4.2 ms |
| www.uber.com/fr/en/ | 1.3 s | 35 ms | 9.8 ms |
| Unattributable | 847 ms | 16 ms | 0.0 ms |
| www.uber.com/_static/client-main-af165af41dd15219.js | 614 ms | 554 ms | 4.7 ms |
| tags.tiqcdn.com/utag/uber/main/prod/utag.js | 128 ms | 97 ms | 17 ms |
Consider reducing the time spent parsing, compiling and executing JS. You may find delivering smaller JS payloads helps with this. Learn how to minimize main-thread work
| Category | Time Spent |
|---|---|
| Script Evaluation | 5.6 s |
| Other | 1.2 s |
| Style & Layout | 746 ms |
| Rendering | 393 ms |
| Garbage Collection | 196 ms |
| Parse HTML & CSS | 128 ms |
| Script Parsing & Compilation | 71 ms |
Many navigations are performed by going back to a previous page, or forwards again. The back/forward cache (bfcache) can speed up these return navigations. Learn more about the bfcache
| Failure reason | Failure type |
|---|---|
| Pages with cache-control:no-store header cannot enter back/forward cache. | Actionable |
| Pages whose main resource has cache-control:no-store cannot enter back/forward cache. | Not actionable |
| Back/forward cache is disabled because some JavaScript network request received resource with Cache-Control: no-store header. | Not actionable |
Reduce unused rules from stylesheets and defer CSS not used for above-the-fold content to decrease bytes consumed by network activity. Learn how to reduce unused CSS.
| URL | Transfer Size | Est Savings |
|---|---|---|
| .css-bzyevI{background-color:#ffffff;min-height:100%;} … | 18.9 KiB | 11.6 KiB |
Large network payloads cost users real money and are highly correlated with long load times. Learn how to reduce payload sizes.
More information about the performance of your application. These numbers don't directly affect the Performance score.
These checks highlight opportunities to improve the accessibility of your web app. Automatic detection can only detect a subset of issues and does not guarantee the accessibility of your web app, so manual testing is also encouraged.
ARIA dialog elements without accessible names may prevent screen readers users from discerning the purpose of these elements. Learn how to make ARIA dialog elements more accessible.
| Failing Elements |
|---|
We use cookies
Click “Accept” to enable Uber to use cookies to personalize thi… body > div#privacy-cookie-banners-root |
These are opportunities to improve the usage of ARIA in your application which may enhance the experience for users of assistive technology, like a screen reader.
Low-contrast text is difficult or impossible for many users to read. Learn how to provide sufficient color contrast.
| Failing Elements |
|---|
Date div.css-cvpIEi > div.css-cYTjpz > label > p.css-hljex |
Time div.css-cvpIEi > div.css-cYTjpz > label > p.css-hljex |
These are opportunities to improve the legibility of your content.
Link text (and alternate text for images, when used as links) that is discernible, unique, and focusable improves the navigation experience for screen reader users. Learn how to make links accessible.
| Failing Elements |
|---|
Details div.css-hSgrkT > ul.css-jHESeg > li.css-fDiKdE > a.css-iwCxLf |
Details div.css-hSgrkT > ul.css-jHESeg > li.css-fDiKdE > a.css-iwCxLf |
Details div.css-hSgrkT > ul.css-jHESeg > li.css-fDiKdE > a.css-iwCxLf |
These are opportunities to improve the semantics of the controls in your application. This may enhance the experience for users of assistive technology, like a screen reader.
Screen readers have a specific way of announcing lists. Ensuring proper list structure aids screen reader output. Learn more about proper list structure.
| Failing Elements |
|---|
Log in
Sign up nav.css-EuaFB > div.css-jpTJNR > div.css-bjVkCt > ul.css-jaByka |
Screen readers require list items (`<li>`) to be contained within a parent `<ul>`, `<ol>` or `<menu>` to be announced properly. Learn more about proper list structure.
| Failing Elements |
|---|
Log in div.css-bjVkCt > ul.css-jaByka > div.logged-out-style-wrapper > li.css-iJiqqk |
Sign up div.css-bjVkCt > ul.css-jaByka > div.logged-out-style-wrapper > li.css-dmqvLf |
These are opportunities to improve the experience of reading tabular or list data using assistive technology, like a screen reader.
Touch targets with sufficient size and spacing help users who may have difficulty targeting small controls to activate the targets. Learn more about touch targets.
| Failing Elements |
|---|
Visit Help Center div.css-bVFrLX > div.css-rjIkq > div > a.css-iBZTkJ |
These items highlight common accessibility best practices.
Visible text labels that do not match the accessible name can result in a confusing experience for screen reader users. Learn more about accessible names.
| Failing Elements |
|---|
Change city div.css-dgZOOc > div.css-bYqxpw > div.css-gjrQew > button.css-hVaYbi |
Visit Help Center div.css-bVFrLX > div.css-rjIkq > div > a.css-iBZTkJ |
Deprecated APIs will eventually be removed from the browser. Learn more about deprecated APIs.
| Deprecation / Warning | Source |
|---|---|
| SharedStorage |
Source maps translate minified code to the original source code. This helps developers debug in production. In addition, Lighthouse is able to provide further insights. Consider deploying source maps to take advantage of these benefits. Learn more about source maps.
These checks ensure that your page is following basic search engine optimization advice. There are many additional factors Lighthouse does not score here that may affect your search ranking, including performance on Core Web Vitals. Learn more about Google Search Essentials.
Industry-standard audits powered by Google Lighthouse. — Desktop
Key metrics that affect user experience. — Desktop
First Contentful Paint First Contentful Paint — how long until the browser renders the first piece of content. Under 1.8s is good.
1.41 s
Largest Contentful Paint Largest Contentful Paint — how long until the largest visible element loads. Under 2.5s is good.
2.70 s
Total Blocking Time Total Blocking Time — total time the main thread was blocked, preventing user input. Under 200ms is good.
416 ms
Cumulative Layout Shift Cumulative Layout Shift — measures visual stability. How much the page layout shifts during loading. Under 0.1 is good.
0.069
Speed Index Speed Index — how quickly content is visually displayed during load. Under 3.4s is good.
2.11 s
Time to Interactive Time to Interactive — how long until the page is fully interactive and responds to user input. Under 3.8s is good.
2.83 s
Audit breakdown by category with detailed findings.
Remove large, duplicate JavaScript modules from bundles to reduce unnecessary bytes consumed by network activity.
Polyfills and transforms enable older browsers to use new JavaScript features. However, many aren't necessary for modern browsers. Consider modifying your JavaScript build process to not transpile Baseline features, unless you know you must support older browsers. Learn why most sites can deploy ES6+ code without transpiling
3rd party code can significantly impact load performance. Reduce and defer loading of 3rd party code to prioritize your page's content.
A long cache lifetime can speed up repeat visits to your page. Learn more about caching.
Your first network request is the most important. Reduce its latency by avoiding redirects, ensuring a fast server response, and enabling text compression.
Reducing the download time of images can improve the perceived load time of the page and LCP. Learn more about optimizing image size
| URL | Resource Size | Est Savings | |
|---|---|---|---|
div.css-eleJdh > div > picture > img.css-ZwMiT div.css-eleJdh > div > picture > img.css-ZwMiT | /image-proc/crop/resizecrop/udam/format=auto/width=576/he... | 318.4 KiB | 267.7 KiB |
div.css-eAlKuC > div > picture > img.css-ZwMiT div.css-eAlKuC > div > picture > img.css-ZwMiT | /image-proc/crop/resizecrop/udam/format=auto/width=1152/h... | 86.3 KiB | 84.9 KiB |
div.css-eAlKuC > div > picture > img.css-ZwMiT div.css-eAlKuC > div > picture > img.css-ZwMiT | /image-proc/crop/resizecrop/udam/format=auto/width=1152/h... | 85.9 KiB | 84.4 KiB |
Moto ul.css-jHESeg > li.css-dcPJSH > a.css-iwCxLf > img.css-kLZafC | d1a3f4spazzrp4.cloudfront.net/car-types/haloProductImages/v1.1/ParisMoto.png | 71.1 KiB | 68.5 KiB |
| /image-proc/crop/resizecrop/udam/format=auto/width=672/he... | 69.6 KiB | 37.1 KiB | |
Reserve ul.css-jHESeg > li.css-dcPJSH > a.css-iwCxLf > img.css-kLZafC | mobile-content.uber.com/uber_reserve/reserve_clock.png | 18.8 KiB | 16.4 KiB |
div.css-gkDhYm > div.css-fWWTaa > picture > img.css-ZwMiT div.css-gkDhYm > div.css-fWWTaa > picture > img.css-ZwMiT | /image-proc/crop/resizecrop/udam/format=auto/width=672/he... | 26.7 KiB | 14.2 KiB |
Intercity ul.css-jHESeg > li.css-dcPJSH > a.css-iwCxLf > img.css-kLZafC | mobile-content.uber.com/launch-experience/intercity.png | 15.0 KiB | 13.1 KiB |
Food ul.css-jHESeg > li.css-dcPJSH > a.css-iwCxLf > img.css-kLZafC | d4p17acsd5wyj.cloudfront.net/shortcuts/restaurants.png | 9.2 KiB | 6.6 KiB |
Each subpart has specific improvement strategies. Ideally, most of the LCP time should be spent on loading the resources, not within delays.
Optimize LCP by making the LCP image discoverable from the HTML immediately, and avoiding lazy-loading
Avoid chaining critical requests by reducing the length of chains, reducing the download size of resources, or deferring the download of unnecessary resources to improve page load.
These insights are also available in the Chrome DevTools Performance Panel - record a trace to view more detailed information.
Redirects introduce additional delays before the page can be loaded. Learn how to avoid page redirects.
| URL | Time Spent |
|---|---|
| www.uber.com/ | 280 ms |
| www.uber.com/fr/en/ | 0.0 ms |
The maximum potential First Input Delay that your users could experience is the duration of the longest task. Learn more about the Maximum Potential First Input Delay metric.
Time to Interactive is the amount of time it takes for the page to become fully interactive. Learn more about the Time to Interactive metric.
Reduce unused JavaScript and defer loading scripts until they are required to decrease bytes consumed by network activity. Learn how to reduce unused JavaScript.
| URL | Transfer Size | Est Savings |
|---|---|---|
| www.uber.com/_static/client-main-af165af41dd15219.js | 388.2 KiB | 234.3 KiB |
| www.uber.com/_static/client-8708-353544d5ef8de5b9.js | 279.8 KiB | 218.7 KiB |
| accounts.google.com/gsi/client | 92.7 KiB | 78.3 KiB |
| www.uber.com/_static/client-vendor-61e4c4f1e391a01d.js | 174.8 KiB | 77.7 KiB |
| www.uber.com/_static/client-450-bfe15bf1cd6fa2b9.js | 94.6 KiB | 51.5 KiB |
| www.uber.com/_static/client-5122-56789282ad38667f.js | 35.9 KiB | 25.2 KiB |
| www.uber.com/_static/client-6557-009cc196b55e3405.js | 43.0 KiB | 23.1 KiB |
| www.uber.com/_static/client-3265-65fce3dcb4176869.js | 29.6 KiB | 20.7 KiB |
| tags.tiqcdn.com/utag/uber/main/prod/utag.js | 35.7 KiB | 20.3 KiB |
Consider reducing the time spent parsing, compiling, and executing JS. You may find delivering smaller JS payloads helps with this. Learn how to reduce Javascript execution time.
| URL | Total CPU Time | Script Evaluation | Script Parse |
|---|---|---|---|
| www.uber.com/_static/client-vendor-61e4c4f1e391a01d.js | 1.9 s | 1.7 s | 1.4 ms |
| www.uber.com/fr/en/ | 294 ms | 8.8 ms | 2.4 ms |
| Unattributable | 264 ms | 4.4 ms | 0.0 ms |
| www.uber.com/_static/client-main-af165af41dd15219.js | 180 ms | 166 ms | 1.0 ms |
Consider reducing the time spent parsing, compiling and executing JS. You may find delivering smaller JS payloads helps with this. Learn how to minimize main-thread work
| Category | Time Spent |
|---|---|
| Script Evaluation | 1.9 s |
| Other | 422 ms |
| Style & Layout | 150 ms |
| Garbage Collection | 89 ms |
| Rendering | 86 ms |
| Script Parsing & Compilation | 34 ms |
| Parse HTML & CSS | 30 ms |
Many navigations are performed by going back to a previous page, or forwards again. The back/forward cache (bfcache) can speed up these return navigations. Learn more about the bfcache
| Failure reason | Failure type |
|---|---|
| Pages with cache-control:no-store header cannot enter back/forward cache. | Actionable |
| Pages whose main resource has cache-control:no-store cannot enter back/forward cache. | Not actionable |
| Back/forward cache is disabled because some JavaScript network request received resource with Cache-Control: no-store header. | Not actionable |
Reduce unused rules from stylesheets and defer CSS not used for above-the-fold content to decrease bytes consumed by network activity. Learn how to reduce unused CSS.
| URL | Transfer Size | Est Savings |
|---|---|---|
| .css-bzyevI{background-color:#ffffff;min-height:100%;} … | 19.3 KiB | 10.0 KiB |
More information about the performance of your application. These numbers don't directly affect the Performance score.
These checks highlight opportunities to improve the accessibility of your web app. Automatic detection can only detect a subset of issues and does not guarantee the accessibility of your web app, so manual testing is also encouraged.
ARIA dialog elements without accessible names may prevent screen readers users from discerning the purpose of these elements. Learn how to make ARIA dialog elements more accessible.
| Failing Elements |
|---|
We use cookies
Click “Accept” to enable Uber to use cookies to personalize thi… body > div#privacy-cookie-banners-root |
These are opportunities to improve the usage of ARIA in your application which may enhance the experience for users of assistive technology, like a screen reader.
Screen readers have a specific way of announcing lists. Ensuring proper list structure aids screen reader output. Learn more about proper list structure.
| Failing Elements |
|---|
EN
Help
Log in
Sign up nav.css-EuaFB > div.css-jpTJNR > div.css-hWkSKL > ul.css-eOLFUs |
Screen readers require list items (`<li>`) to be contained within a parent `<ul>`, `<ol>` or `<menu>` to be announced properly. Learn more about proper list structure.
| Failing Elements |
|---|
Log in div.css-hWkSKL > ul.css-eOLFUs > div.logged-out-style-wrapper > li.css-iJiqqk |
Sign up div.css-hWkSKL > ul.css-eOLFUs > div.logged-out-style-wrapper > li.css-dmqvLf |
These are opportunities to improve the experience of reading tabular or list data using assistive technology, like a screen reader.
Visible text labels that do not match the accessible name can result in a confusing experience for screen reader users. Learn more about accessible names.
| Failing Elements |
|---|
EN div.css-hWkSKL > ul.css-eOLFUs > li.css-iJiqqk > button.css-lWgfA |
Change city div.css-cbdYOH > div.css-bYqxpw > div.css-gjrQew > button.css-hVaYbi |
Download the Uber app
Scan to download div.css-dYcOXC > div.css-PKJb > div.css-faZdHr > a.css-ecIvZh |
Download the Driver app
Scan to download div.css-dYcOXC > div.css-PKJb > div.css-faZdHr > a.css-ecIvZh |
Visit Help Center div.css-bVFrLX > div.css-rjIkq > div > a.css-iBZTkJ |
Deprecated APIs will eventually be removed from the browser. Learn more about deprecated APIs.
| Deprecation / Warning | Source |
|---|---|
| SharedStorage |
Source maps translate minified code to the original source code. This helps developers debug in production. In addition, Lighthouse is able to provide further insights. Consider deploying source maps to take advantage of these benefits. Learn more about source maps.
These checks ensure that your page is following basic search engine optimization advice. There are many additional factors Lighthouse does not score here that may affect your search ranking, including performance on Core Web Vitals. Learn more about Google Search Essentials.
Send Feedback