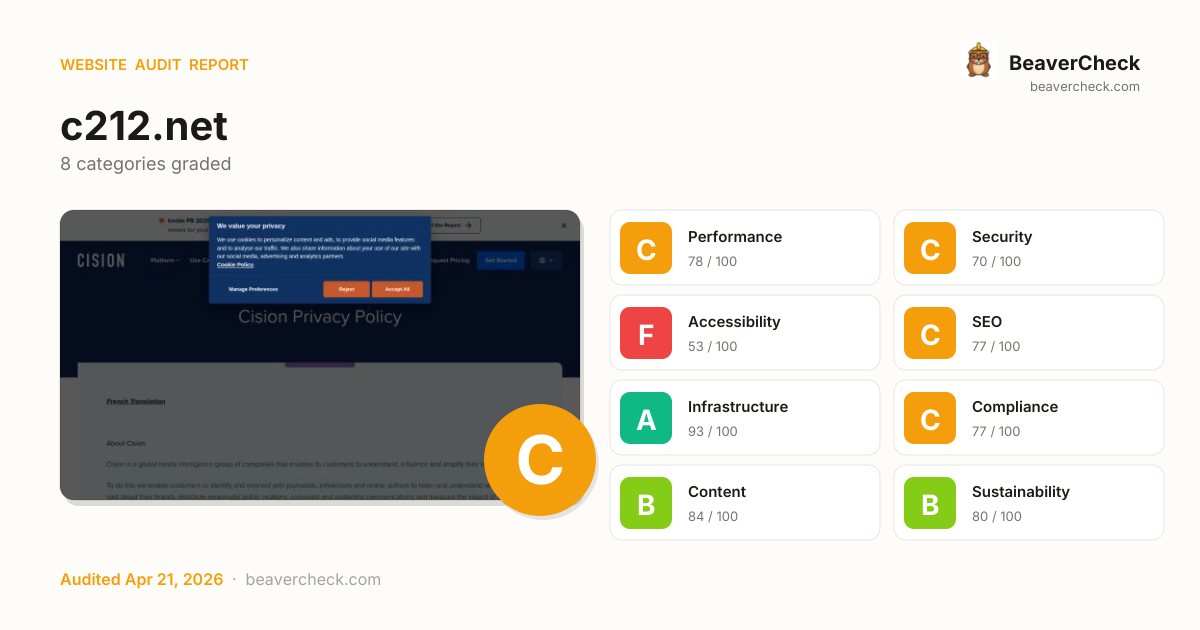
Skip to content
Audit Complete

Results for https://c212.net

Visit site
Spain Spain · Madrid Completed: Apr 21, 2026 21:43 UTC
Download Markdown Report

Mobile 375 × 812

Screenshot of the audited page (Mobile 375×812)

Desktop 1440 × 900

Screenshot of the audited page (Desktop 1440×900)
C74

Site Health

Score: 74 / 100

Based on 8 categories, 0 sections

Decent speed, but optimizing further could improve engagement.

Good foundation, but a few gaps could be exploited.

Several issues make your site difficult for assistive technology users.

Solid SEO basics — a few optimizations could boost rankings.

Solid infrastructure — fast server responses across the board.

Mostly compliant — a few items need attention.

Good content signals with minor gaps.

Reasonable footprint with room for optimization.

How is this calculated?

The overall score is a weighted average of individual category scores. Categories with more impact on user experience and security carry more weight.

Performance 25%Security 25%Accessibility 15%SEO 10%Infrastructure 10%Compliance 8%Content 5%Sustainability 2%

Weights reflect general web best practices. Individual needs may differ.

How the composite score is calculated

How you compare

Adobe Experience Manager · 111 peers
You 74
·
Avg 72
At average
0 50 100
Better than 65% of Adobe Experience Manager sites See full Adobe Experience Manager benchmark →
Adobe Fonts · 141 peers
You 74
·
Avg 73
At average
0 50 100
Better than 54% of Adobe Fonts sites See full Adobe Fonts benchmark →

Top Priorities (5)

1

No <main> landmark found

Accessibility issues exclude users with disabilities — up to 15% of your potential audience.

Accessibility › Landmark Structure
2

101 HTTP requests — consider bundling or reducing

Performance issues directly impact user engagement and conversion rates.

Performance › Page Weight Budget
3

99 third-party resources (100% of weight)

Performance issues directly impact user engagement and conversion rates.

Performance › Page Weight Inventory
4

Cookie 'INGRESSCOOKIE' has no SameSite attribute

Security gaps expose your site and users to attacks, eroding trust.

Security › Cookie Security
5

Cookie '__cf_bm' has no SameSite attribute

Security gaps expose your site and users to attacks, eroding trust.

Security › Cookie Security
View fix priority matrix

Fix Priority Matrix

5 findings

Quick Wins

2

High impact, low effort — start here.

Strategic

3

High impact, requires investment.

Easy Improvements

0

Small gains, minimal effort.

Nothing in this quadrant — good news.

Deprioritize

0

Low impact, high effort — do last.

Nothing in this quadrant — good news.

← Low effort High effort →
BeaverCheck badge
Embed this badge
[![BeaverCheck](https://beavercheck.com/badge?url=https%3A%2F%2Fc212.net)](https://beavercheck.com/results/d0b9b7de-18c3-4764-8cdb-e40518729bd3)
<a href="https://beavercheck.com/results/d0b9b7de-18c3-4764-8cdb-e40518729bd3"><img src="https://beavercheck.com/badge?url=https%3A%2F%2Fc212.net" alt="BeaverCheck Score"></a>
https://beavercheck.com/badge?url=https%3A%2F%2Fc212.net

This badge auto-updates with your latest scan result.

What fixing these means

Your site performs reasonably well, but a few targeted fixes could meaningfully improve results. Your LCP of 5.6s exceeds Google's 2.5s 'Good' threshold and the 2 performance issues below directly contribute to it. Accessibility issues exclude users who rely on assistive technology — an estimated 15% of your potential audience. Addressing the critical issues below would have the most immediate impact on your audience reach.

1 accessibility issue excludes users who rely on assistive technology.
Your LCP is 5.6s — fixing the 2 performance criticals could bring it under Google's 2.5s 'Good' threshold.
2 security gaps detected — browsers may warn visitors about your site.

Conversion Barriers

2 critical 5 warning

7 barrier(s) likely increasing bounce by ~31%.

Speed (2)

Page takes 5.6s to load

+12% bounce

Users abandon at ~3s — you're 3.1s over the 2.5s threshold

Fix: Optimize render-blocking resources, preload the hero image, and compress images

Page feels frozen for 1.1s

+5% bounce

Clicks on the primary CTA are ignored while JavaScript runs

Fix: Break up long tasks; defer non-critical JavaScript to post-hydration

Usability (1)

Layout shifts during page load

+3% bounce

Content movement causes mis-clicks on CTAs and form fields

Fix: Add width/height to images; reserve space for late-loading embeds

Content (2)

No structured data

+2% bounce

No rich-result eligibility in Google — lower SERP CTR vs competitors with stars and prices

Fix: Add JSON-LD for your page type (Product, Article, FAQPage, LocalBusiness, …)

Thin content

+3% bounce

Under 300 words — visitors bounce looking for substance, search engines rank competitors first

Fix: Add a substantive FAQ, product detail, or case-study section

Navigation (2)

No skip-to-content link

+1% bounce

Keyboard and screen-reader users must tab through the entire header on every page

Fix: Add a visible-on-focus <a href="#main">Skip to content</a> as the first focusable element

2 broken link(s) on the page

+3% bounce

Clicks land on 404s — trust drops and the session often ends

Fix: Fix or remove the broken destinations surfaced on the Content tab

Preliminary CRO audit — each barrier links to the tab with detailed analysis.

Return on Investment

€553 investment → €2,237/month returns + EUR 120,500,000 risk avoided

Payback period: < 1 month First-year ROI: +4758%

Investment

€553

6h · 5 findings

Monthly returns

€2,237 /mo

~€26,840 / year

  • Conversions recovered €2,236
  • Bandwidth savings €0.74

Regulatory risk avoided

EUR 120,500,000

if kept compliant

  • ePrivacy Directive EUR 100,000,000
  • GDPR EUR 20,000,000
  • EAA EUR 500,000

Payback period

0 12mo 24mo

€85 — in quick wins — start here for the fastest payback

Figures combine localized regulatory fine ceilings, search/conversion value priced against local CPC, and bandwidth waste estimates. Results depend on implementation quality and audience composition. Not legal or financial advice.

Full methodology & sources

Estimated Remediation Cost

€553

6.5 developer hours at €85/hr

Based on European Union rates (€85/hr)

Quick wins
€85 2 fixes in ~60 minutes

Start here for the best return on investment

Cost by category

Cost by effort level

Adjust assumptions
/hr

Rates reflect fully-loaded developer cost including overhead

How developer rates are sourced

What Inaction Is Costing You

€10,041,667 / month at risk

~€120,500,009 / year if left unfixed

Compliance Risk

€120,500,000

ePrivacy DirectiveGDPREAA
  • No privacy policy link detected
    GDPR: EUR 10,000 – EUR 20,000,000
  • Trackers detected but no cookie policy found
    GDPR: EUR 5,000 – EUR 10,000,000
  • Trackers detected but no cookie policy found
    GDPR: EUR 10,000 – EUR 20,000,000

+7 more

Bandwidth Waste

€0.74 /mo

9923.3 MB/mo × 0.074 EUR/GB

  • Optimize transfer: save ~992 KB per page load
    Saves €0.74/mo

Compliance figures represent the statutory maximum fine for the most severe triggered category, capped per regulation — not the sum of per-finding penalties. Based on published regulatory fine ranges. This is not legal advice.

Compliance methodology · SEO assumptions · Bandwidth model

Your performance is already good — improvements may show diminishing returns

Unique monthly visitors from your analytics

Purchases, signups, or key actions

Optional — for revenue estimation

additional conversions/month

more engaged visitors from reduced bounce

potential monthly revenue
Current bounce (est.)
After fixes (est.)
Estimated bounce reduction

Fix 1 critical issues to capture this value

How this is calculated

Based on Google/Deloitte research ("Milliseconds Make Millions") showing a ~7% bounce rate increase per additional second of LCP above the 2.5s "Good" threshold.

Your site's LCP: → estimated after fixes.

These are estimates based on industry research — actual results vary

Bounce-rate model & assumptions

Your data stays in your browser — nothing is sent to our servers

Was this report useful?

Thanks for your feedback!

We'll use a cached audit if available, or offer to scan.

Checking for existing audit...

Lighthouse Scores

Industry-standard audits powered by Google Lighthouse.

35
Performance Overall performance score (0–100) based on Core Web Vitals and other metrics. 90+ is good.
91
Accessibility Measures how accessible the page is for users with disabilities. Checks color contrast, ARIA labels, and semantic HTML.
77
Best Practices Checks for modern web development best practices including HTTPS, no console errors, and secure JavaScript.
92
SEO Measures basic SEO optimizations: meta tags, crawlability, link text, and mobile friendliness.

Core Web Vitals

Key metrics that affect user experience.

First Contentful Paint First Contentful Paint — how long until the browser renders the first piece of content. Under 1.8s is good.

3.98 s

Largest Contentful Paint Largest Contentful Paint — how long until the largest visible element loads. Under 2.5s is good.

5.58 s

Total Blocking Time Total Blocking Time — total time the main thread was blocked, preventing user input. Under 200ms is good.

1.07 s

Cumulative Layout Shift Cumulative Layout Shift — measures visual stability. How much the page layout shifts during loading. Under 0.1 is good.

0.214

Speed Index Speed Index — how quickly content is visually displayed during load. Under 3.4s is good.

4.75 s

Time to Interactive Time to Interactive — how long until the page is fully interactive and responds to user input. Under 3.8s is good.

16.73 s

Detailed Report

Audit breakdown by category with detailed findings.

35

Performance

Insights

Remove large, duplicate JavaScript modules from bundles to reduce unnecessary bytes consumed by network activity.

Why this matters

Performance issues directly impact user engagement and conversion rates.

Polyfills and transforms enable older browsers to use new JavaScript features. However, many aren't necessary for modern browsers. Consider modifying your JavaScript build process to not transpile Baseline features, unless you know you must support older browsers. Learn why most sites can deploy ES6+ code without transpiling

Why this matters

Shipping ES5 transpiled code to modern browsers wastes bytes — every user with an evergreen browser pays for compatibility you don't need.

Learn more

Most users today run browsers that natively support ES6+, async/await, optional chaining, and the rest of modern JavaScript. Transpiling to ES5 'just in case' adds 20-40% to your bundle for no benefit. Configure your build to target a modern browserslist, or ship a differential bundle pair (modern + legacy) with the module/nomodule pattern.

Source: Google web.dev / Lighthouse

3rd party code can significantly impact load performance. Reduce and defer loading of 3rd party code to prioritize your page's content.

Why this matters

Performance issues directly impact user engagement and conversion rates.

A long cache lifetime can speed up repeat visits to your page. Learn more about caching.

Why this matters

Performance issues directly impact user engagement and conversion rates.

RequestCache TTLTransfer Size
assets.qualified.com/static-media/piperx-orb/orb-animation.mp40.0 ms708.8 KiB
js.qualified.com/qualified.js?token=GYXYao8kA4XzkurM60.0 s116.8 KiB
assets.qualified.com/packs/media/Inter-SemiBold.fcb100c7.woff20.0 ms103.9 KiB
assets.qualified.com/packs/media/Inter-Regular.f1f0c35b.woff20.0 ms96.9 KiB
connect.facebook.net/en_US/fbevents.js1200.0 s96.6 KiB
www.cision.com/etc.clientlibs/cision-revamp/clientlibs/clientlib-common.min.js10800.0 s114.4 KiB
www.cision.com/etc.clientlibs/cision-revamp/clientlibs/clientlib-revamp.min.js10800.0 s86.5 KiB
www.cision.com/etc.clientlibs/cision-revamp/clientlibs/clientlib-revamp.min.css10800.0 s59.0 KiB
/signals/config/879392717081165?v=2.9.303&r=stable&domain...1200.0 s44.5 KiB
www.cision.com/etc.clientlibs/cision-revamp/clientlibs/clientlib-custom.min.js10800.0 s40.5 KiB
euob.segreencolumn.com/sxp/i/a13c666c09e9671170b9d9245e156f37.js43200.0 s44.6 KiB
cdn.claydar.com/releases/latest/radar.min.js300.0 s20.6 KiB
www.cision.com/cdn-cgi/challenge-platform/h/b/scripts/jsd/0b8fb825cb67/main.js?14400.0 s13.2 KiB
/beacon.min.js/v8c78df7c7c0f484497ecbca7046644da177152312...86400.0 s10.7 KiB
/attribution_tracking/conversions/108.js?p=https://www.ci...0.0 ms2.2 KiB
static.claydar.com/init.v1.js?id=ceMoKiPQmL0.0 ms1.1 KiB
www.cision.com/content/dam/cision-revamp/cision-optimized/icons/campaign.svg432000.0 s3.5 KiB
www.cision.com/content/dam/cision-revamp/cision-optimized/icons/AI.svg432000.0 s2.0 KiB
/etc.clientlibs/cision.restructure/clientlibs/clientlib-w...10800.0 s404 B
www.cision.com/etc.clientlibs/cision-revamp/clientlibs/clientlib-wistia.min.js10800.0 s350 B
www.cision.com/content/dam/cision-revamp/cision-optimized/icons/social.svg432000.0 s1.2 KiB
www.cision.com/etc.clientlibs/cision-revamp/clientlibs/clientlib-wistia.min.css10800.0 s253 B
/etc.clientlibs/cision.restructure/clientlibs/clientlib-w...10800.0 s241 B
/content/dam/cision-revamp/cision-optimized/icons/cisiono...432000.0 s1.0 KiB
www.cision.com/content/dam/cision-revamp/cision-optimized/icons/monitoring-2.svg432000.0 s1003 B
/content/dam/cision-revamp/cision-optimized/icons/newsmod...432000.0 s970 B
www.cision.com/content/dam/cision-revamp/cision-optimized/icons/report.svg432000.0 s800 B
/p.css?s=1&k=uch2oqz&ht=tk&f=139.140.175.176.5474.5475.15...604800.0 s172 B
/tr/?id=879392717081165&ev=CHEQ&dl=https%3A%2F%2Fwww.cisi...0.0 ms16 B

Layout shifts occur when elements move absent any user interaction. Investigate the causes of layout shifts, such as elements being added, removed, or their fonts changing as the page loads.

Why this matters

Performance issues directly impact user engagement and conversion rates.

headings: [map[key:node label:Element subItemsHeading:map[key:extra] valueType:node] map[granularity:0.001 key:score label:Layout shift score subItemsHeading:map[key:cause valueType:text] valueType:numeric]]
items: [map[node:map[type:text value:Total] score:0.213852] map[node:map[boundingRect:map[bottom:21017 height:20769 left:0 right:412 top:248 width:412] lhId:page-1-MAIN nodeLabel:Cision Privacy Policy French Translation   About Cision Cision is a global… path:1,HTML,1,BODY,6,MAIN selector:body#basepage-188f9ccd03 > main#page snippet:<main id="page" class="base-page " tabindex="-1"> type:node] score:0.213852]]
headings: [map[key:node label:Element subItemsHeading:map[key:extra] valueType:node] map[granularity:0.001 key:score label:Layout shift score subItemsHeading:map[key:cause valueType:text] valueType:numeric]]
items: [map[node:map[type:text value:Total] score:0.095331] map[node:map[boundingRect:map[bottom:823 height:20 left:392 right:412 top:803 width:20] lhId:page-3-IFRAME nodeLabel:iframe#q-messenger-frame path:1,HTML,2,IFRAME selector:iframe#q-messenger-frame snippet:<iframe name="" class="qlfd-is-mobile" id="q-messenger-frame" data-mirrored="true" allow="camera;microphone" style="height: 20px !important; width: 20px !important;" src="https://app.qualified.com/w/1/GYXYao8kA4XzkurM/messenger?uuid=64c89a4a-e50…"> type:node] score:0.095331]]

Your first network request is the most important. Reduce its latency by avoiding redirects, ensuring a fast server response, and enabling text compression.

Why this matters

Performance issues directly impact user engagement and conversion rates.

A forced reflow occurs when JavaScript queries geometric properties (such as offsetWidth) after styles have been invalidated by a change to the DOM state. This can result in poor performance. Learn more about forced reflows and possible mitigations.

Why this matters

Performance issues directly impact user engagement and conversion rates.

headings: [map[key:source label:Source valueType:source-location] map[granularity:1 key:reflowTime label:Total reflow time valueType:ms]]
items: [map[reflowTime:32.889 source:map[type:text value:[unattributed]]]]

Avoid chaining critical requests by reducing the length of chains, reducing the download size of resources, or deferring the download of unnecessary resources to improve page load.

Why this matters

Performance issues directly impact user engagement and conversion rates.

description: [preconnect](https://developer.chrome.com/docs/lighthouse/performance/uses-rel-preconnect/) hints help the browser establish a connection earlier in the page load, saving time when the first request for that origin is made. The following are the origins that the page preconnected to.
title: Preconnected origins
value: no origins were preconnected
description: Add [preconnect](https://developer.chrome.com/docs/lighthouse/performance/uses-rel-preconnect/) hints to your most important origins, but try to use no more than 4.
title: Preconnect candidates

Consider setting font-display to swap or optional to ensure text is consistently visible. swap can be further optimized to mitigate layout shifts with font metric overrides.

Why this matters

Performance issues directly impact user engagement and conversion rates.

These insights are also available in the Chrome DevTools Performance Panel - record a trace to view more detailed information.

Lists the toplevel main thread tasks that executed during page load.

Why this matters

Performance issues directly impact user engagement and conversion rates.

Collection of useful page vitals.

Why this matters

Performance issues directly impact user engagement and conversion rates.

Redirects introduce additional delays before the page can be loaded. Learn how to avoid page redirects.

Why this matters

Performance issues directly impact user engagement and conversion rates.

Estimated savings: 1.7 s

These are the largest layout shifts observed on the page. Each table item represents a single layout shift, and shows the element that shifted the most. Below each item are possible root causes that led to the layout shift. Some of these layout shifts may not be included in the CLS metric value due to windowing. Learn how to improve CLS

Why this matters

Performance issues directly impact user engagement and conversion rates.

ElementLayout shift score
Cision Privacy Policy French Translation   About Cision Cision is a global… body#basepage-188f9ccd03 > main#page
0.214
iframe#q-messenger-frame iframe#q-messenger-frame
0.095

Time to Interactive is the amount of time it takes for the page to become fully interactive. Learn more about the Time to Interactive metric.

Why this matters

Performance issues directly impact user engagement and conversion rates.

TTI

The maximum potential First Input Delay that your users could experience is the duration of the longest task. Learn more about the Maximum Potential First Input Delay metric.

Why this matters

Performance issues directly impact user engagement and conversion rates.

Diagnostics

Consider reducing the time spent parsing, compiling, and executing JS. You may find delivering smaller JS payloads helps with this. Learn how to reduce Javascript execution time.

Why this matters

Performance issues directly impact user engagement and conversion rates.

Consider reducing the time spent parsing, compiling and executing JS. You may find delivering smaller JS payloads helps with this. Learn how to minimize main-thread work

Why this matters

Performance issues directly impact user engagement and conversion rates.

Lists the longest tasks on the main thread, useful for identifying worst contributors to input delay. Learn how to avoid long main-thread tasks

Why this matters

Performance issues directly impact user engagement and conversion rates.

Minifying CSS files can reduce network payload sizes. Learn how to minify CSS.

Why this matters

Performance issues directly impact user engagement and conversion rates.

Estimated savings: 170 ms 13.4 KiB

Minifying JavaScript files can reduce payload sizes and script parse time. Learn how to minify JavaScript.

Why this matters

Performance issues directly impact user engagement and conversion rates.

Estimated savings: 170 ms 14.5 KiB

Reduce unused rules from stylesheets and defer CSS not used for above-the-fold content to decrease bytes consumed by network activity. Learn how to reduce unused CSS.

Why this matters

Performance issues directly impact user engagement and conversion rates.

Estimated savings: 500 ms 56.2 KiB

Reduce unused JavaScript and defer loading scripts until they are required to decrease bytes consumed by network activity. Learn how to reduce unused JavaScript.

Why this matters

Multi-megabyte JavaScript bundles delay every interactive feature on the page.

Learn more

This is the Lighthouse audit fired when too much JS is shipped relative to what executes. The fix isn't a config flag — it requires bundle analysis (webpack-bundle-analyzer, rollup-plugin-visualizer), splitting routes into chunks, lazy-loading off-screen components, and removing unused dependencies. Fundamentally different from minification: minifying reduces byte count, this reduces what's downloaded at all.

Source: Google web.dev / Lighthouse

Many navigations are performed by going back to a previous page, or forwards again. The back/forward cache (bfcache) can speed up these return navigations. Learn more about the bfcache

Why this matters

Performance issues directly impact user engagement and conversion rates.

Failure reasonFailure type
Pages with WebSocket cannot enter back/forward cache.Pending browser support

More information about the performance of your application. These numbers don't directly affect the Performance score.

Optimize DOM size
Improve image delivery
LCP breakdown
Modern HTTP
Optimize viewport for mobile
User Timing marks and measures 5 user timings
Avoid non-composited animations 2 animated elements found
Image elements have explicit `width` and `height`
Network Requests
Network Round Trip Times 50 ms
Server Backend Latencies 190 ms
Metrics
Screenshot Thumbnails
Final Screenshot
Script Treemap Data
Resources Summary
Initial server response time was short Root document took 30 ms
INP breakdown
LCP request discovery
91

Accessibility

These checks highlight opportunities to improve the accessibility of your web app. Automatic detection can only detect a subset of issues and does not guarantee the accessibility of your web app, so manual testing is also encouraged.

ARIA

Using ARIA attributes in roles where they are prohibited can mean that important information is not communicated to users of assistive technologies. Learn more about prohibited ARIA roles.

Why this matters

Performance issues directly impact user engagement and conversion rates.

Failing Elements
AI assistant body#basepage-188f9ccd03 > q-focus-sentinel > div
After AI assistant body#basepage-188f9ccd03 > q-focus-sentinel > div
AI assistant, start div#qualified-multimodal-host > div
AI assistant, end div#qualified-multimodal-host > div

These are opportunities to improve the usage of ARIA in your application which may enhance the experience for users of assistive technology, like a screen reader.

Navigation

Properly ordered headings that do not skip levels convey the semantic structure of the page, making it easier to navigate and understand when using assistive technologies. Learn more about heading order.

Why this matters

Performance issues directly impact user engagement and conversion rates.

Failing Elements
div.wrapper > div.bottom > div.privacy > h3 div.wrapper > div.bottom > div.privacy > h3

These are opportunities to improve keyboard navigation in your application.

Names and labels

Link text (and alternate text for images, when used as links) that is discernible, unique, and focusable improves the navigation experience for screen reader users. Learn how to make links accessible.

Why this matters

Performance issues directly impact user engagement and conversion rates.

Failing Elements
div.wrapper > div.column > div.logo > a.first-focusable-element div.wrapper > div.column > div.logo > a.first-focusable-element
div.wrapper > div.top > div.logo > a div.wrapper > div.top > div.logo > a

These are opportunities to improve the semantics of the controls in your application. This may enhance the experience for users of assistive technology, like a screen reader.

Interactive controls are keyboard focusable
Interactive elements indicate their purpose and state
The page has a logical tab order
Visual order on the page follows DOM order
User focus is not accidentally trapped in a region
The user's focus is directed to new content added to the page
HTML5 landmark elements are used to improve navigation
Offscreen content is hidden from assistive technology
Custom controls have associated labels
Custom controls have ARIA roles
`[aria-*]` attributes match their roles
`[aria-hidden="true"]` is not present on the document `<body>`
`[role]`s have all required `[aria-*]` attributes
`[role]` values are valid
`[aria-*]` attributes have valid values
`[aria-*]` attributes are valid and not misspelled
Buttons have an accessible name
`[user-scalable="no"]` is not used in the `<meta name="viewport">` element and the `[maximum-scale]` attribute is not less than 5.
ARIA attributes are used as specified for the element's role
Elements with `role="dialog"` or `role="alertdialog"` have accessible names.
`[aria-hidden="true"]` elements do not contain focusable descendents
Background and foreground colors have a sufficient contrast ratio
Document has a `<title>` element
`<frame>` or `<iframe>` elements have a title
`<html>` element has a `[lang]` attribute
`<html>` element has a valid value for its `[lang]` attribute
Links are distinguishable without relying on color.
Lists contain only `<li>` elements and script supporting elements (`<script>` and `<template>`).
List items (`<li>`) are contained within `<ul>`, `<ol>` or `<menu>` parent elements
No element has a `[tabindex]` value greater than 0
Touch targets have sufficient size and spacing.
Cells in a `<table>` element that use the `[headers]` attribute refer to table cells within the same table.
Document has a main landmark.
Deprecated ARIA roles were not used
All heading elements contain content.
Uses ARIA roles only on compatible elements
Identical links have the same purpose.
Tables use `<caption>` instead of cells with the `[colspan]` attribute to indicate a caption.
`[accesskey]` values are unique
`button`, `link`, and `menuitem` elements have accessible names
ARIA input fields have accessible names
ARIA `meter` elements have accessible names
ARIA `progressbar` elements have accessible names
Elements with an ARIA `[role]` that require children to contain a specific `[role]` have all required children.
`[role]`s are contained by their required parent element
Elements with the `role=text` attribute do not have focusable descendents.
ARIA toggle fields have accessible names
ARIA `tooltip` elements have accessible names
ARIA `treeitem` elements have accessible names
The page contains a heading, skip link, or landmark region
`<dl>`'s contain only properly-ordered `<dt>` and `<dd>` groups, `<script>`, `<template>` or `<div>` elements.
Definition list items are wrapped in `<dl>` elements
ARIA IDs are unique
No form fields have multiple labels
`<html>` element has an `[xml:lang]` attribute with the same base language as the `[lang]` attribute.
Image elements have `[alt]` attributes
Input buttons have discernible text.
`<input type="image">` elements have `[alt]` text
Form elements have associated labels
The document does not use `<meta http-equiv="refresh">`
`<object>` elements have alternate text
Select elements have associated label elements.
Skip links are focusable.
`<th>` elements and elements with `[role="columnheader"/"rowheader"]` have data cells they describe.
`[lang]` attributes have a valid value
`<video>` elements contain a `<track>` element with `[kind="captions"]`
Tables have different content in the summary attribute and `<caption>`.
Image elements do not have `[alt]` attributes that are redundant text.
Elements with visible text labels have matching accessible names.
`<td>` elements in a large `<table>` have one or more table headers.
77

Best Practices

General

Deprecated APIs will eventually be removed from the browser. Learn more about deprecated APIs.

Why this matters

Performance issues directly impact user engagement and conversion rates.

Deprecation / WarningSource
SharedStorage
StorageType.persistent is deprecated. Please use standardized navigator.storage instead.
Fledge
AttributionReporting

Errors logged to the console indicate unresolved problems. They can come from network request failures and other browser concerns. Learn more about this errors in console diagnostic audit

Why this matters

Performance issues directly impact user engagement and conversion rates.

SourceDescription
Failed to load resource: the server responded with a status of 404 ()

Source maps translate minified code to the original source code. This helps developers debug in production. In addition, Lighthouse is able to provide further insights. Consider deploying source maps to take advantage of these benefits. Learn more about source maps.

Why this matters

Performance issues directly impact user engagement and conversion rates.

Uses HTTPS
Avoids third-party cookies
Allows users to paste into input fields
Avoids requesting the geolocation permission on page load
Avoids requesting the notification permission on page load
Displays images with correct aspect ratio
Serves images with appropriate resolution
Page has the HTML doctype
Properly defines charset
No issues in the `Issues` panel in Chrome Devtools
Ensure CSP is effective against XSS attacks
Ensure proper origin isolation with COOP
Mitigate DOM-based XSS with Trusted Types
Detected JavaScript libraries
Redirects HTTP traffic to HTTPS
Use a strong HSTS policy
Mitigate clickjacking with XFO or CSP
92

SEO

These checks ensure that your page is following basic search engine optimization advice. There are many additional factors Lighthouse does not score here that may affect your search ranking, including performance on Core Web Vitals. Learn more about Google Search Essentials.

Content Best Practices

Descriptive link text helps search engines understand your content. Learn how to make links more accessible.

Why this matters

Performance issues directly impact user engagement and conversion rates.

Format your HTML in a way that enables crawlers to better understand your app’s content.

Structured data is valid
Page isn’t blocked from indexing
Document has a `<title>` element
Document has a meta description
Page has successful HTTP status code
Links are crawlable
robots.txt is valid
Document has a valid `hreflang`
Document has a valid `rel=canonical`
Image elements have `[alt]` attributes

Lighthouse Scores

Industry-standard audits powered by Google Lighthouse. — Desktop

91
Performance Overall performance score (0–100) based on Core Web Vitals and other metrics. 90+ is good.
91
Accessibility Measures how accessible the page is for users with disabilities. Checks color contrast, ARIA labels, and semantic HTML.
81
Best Practices Checks for modern web development best practices including HTTPS, no console errors, and secure JavaScript.
92
SEO Measures basic SEO optimizations: meta tags, crawlability, link text, and mobile friendliness.

Core Web Vitals

Key metrics that affect user experience. — Desktop

First Contentful Paint First Contentful Paint — how long until the browser renders the first piece of content. Under 1.8s is good.

1.13 s

Largest Contentful Paint Largest Contentful Paint — how long until the largest visible element loads. Under 2.5s is good.

1.38 s

Total Blocking Time Total Blocking Time — total time the main thread was blocked, preventing user input. Under 200ms is good.

4 ms

Cumulative Layout Shift Cumulative Layout Shift — measures visual stability. How much the page layout shifts during loading. Under 0.1 is good.

0.065

Speed Index Speed Index — how quickly content is visually displayed during load. Under 3.4s is good.

1.64 s

Time to Interactive Time to Interactive — how long until the page is fully interactive and responds to user input. Under 3.8s is good.

1.49 s

Detailed Report

Audit breakdown by category with detailed findings.

91

Performance

Insights

Remove large, duplicate JavaScript modules from bundles to reduce unnecessary bytes consumed by network activity.

Why this matters

Performance issues directly impact user engagement and conversion rates.

Polyfills and transforms enable older browsers to use new JavaScript features. However, many aren't necessary for modern browsers. Consider modifying your JavaScript build process to not transpile Baseline features, unless you know you must support older browsers. Learn why most sites can deploy ES6+ code without transpiling

Why this matters

Shipping ES5 transpiled code to modern browsers wastes bytes — every user with an evergreen browser pays for compatibility you don't need.

Learn more

Most users today run browsers that natively support ES6+, async/await, optional chaining, and the rest of modern JavaScript. Transpiling to ES5 'just in case' adds 20-40% to your bundle for no benefit. Configure your build to target a modern browserslist, or ship a differential bundle pair (modern + legacy) with the module/nomodule pattern.

Source: Google web.dev / Lighthouse

3rd party code can significantly impact load performance. Reduce and defer loading of 3rd party code to prioritize your page's content.

Why this matters

Performance issues directly impact user engagement and conversion rates.

A long cache lifetime can speed up repeat visits to your page. Learn more about caching.

Why this matters

Performance issues directly impact user engagement and conversion rates.

RequestCache TTLTransfer Size
assets.qualified.com/static-media/piperx-orb/orb-animation.mp40.0 ms708.8 KiB
js.qualified.com/qualified.js?token=GYXYao8kA4XzkurM60.0 s116.8 KiB
assets.qualified.com/packs/media/Inter-SemiBold.fcb100c7.woff20.0 ms103.6 KiB
assets.qualified.com/packs/media/Inter-Regular.f1f0c35b.woff20.0 ms97.2 KiB
connect.facebook.net/en_US/fbevents.js1200.0 s96.6 KiB
www.cision.com/etc.clientlibs/cision-revamp/clientlibs/clientlib-common.min.js10800.0 s114.4 KiB
www.cision.com/etc.clientlibs/cision-revamp/clientlibs/clientlib-revamp.min.js10800.0 s86.5 KiB
www.cision.com/etc.clientlibs/cision-revamp/clientlibs/clientlib-revamp.min.css10800.0 s59.0 KiB
/signals/config/879392717081165?v=2.9.303&r=stable&domain...1200.0 s44.5 KiB
www.cision.com/etc.clientlibs/cision-revamp/clientlibs/clientlib-custom.min.js10800.0 s40.6 KiB
euob.segreencolumn.com/sxp/i/a13c666c09e9671170b9d9245e156f37.js43200.0 s44.6 KiB
cdn.claydar.com/releases/latest/radar.min.js300.0 s20.5 KiB
www.cision.com/cdn-cgi/challenge-platform/h/b/scripts/jsd/0b8fb825cb67/main.js?14400.0 s11.8 KiB
/beacon.min.js/v8c78df7c7c0f484497ecbca7046644da177152312...86400.0 s10.7 KiB
/attribution_tracking/conversions/108.js?p=https://www.ci...0.0 ms2.2 KiB
static.claydar.com/init.v1.js?id=ceMoKiPQmL0.0 ms1.1 KiB
www.cision.com/content/dam/cision-revamp/cision-optimized/icons/campaign.svg432000.0 s3.5 KiB
www.cision.com/content/dam/cision-revamp/cision-optimized/icons/AI.svg432000.0 s2.0 KiB
www.cision.com/etc.clientlibs/cision-revamp/clientlibs/clientlib-wistia.min.js10800.0 s426 B
/etc.clientlibs/cision.restructure/clientlibs/clientlib-w...10800.0 s392 B
/etc.clientlibs/cision.restructure/clientlibs/clientlib-w...10800.0 s297 B
www.cision.com/content/dam/cision-revamp/cision-optimized/icons/social.svg432000.0 s1.1 KiB
/content/dam/cision-revamp/cision-optimized/icons/cisiono...432000.0 s1.0 KiB
www.cision.com/content/dam/cision-revamp/cision-optimized/icons/monitoring-2.svg432000.0 s929 B
www.cision.com/etc.clientlibs/cision-revamp/clientlibs/clientlib-wistia.min.css10800.0 s197 B
/content/dam/cision-revamp/cision-optimized/icons/newsmod...432000.0 s918 B
www.cision.com/content/dam/cision-revamp/cision-optimized/icons/report.svg432000.0 s875 B
/p.css?s=1&k=uch2oqz&ht=tk&f=139.140.175.176.5474.5475.15...604800.0 s172 B
/tr/?id=879392717081165&ev=CHEQ&dl=https%3A%2F%2Fwww.cisi...0.0 ms16 B

Your first network request is the most important. Reduce its latency by avoiding redirects, ensuring a fast server response, and enabling text compression.

Why this matters

Performance issues directly impact user engagement and conversion rates.

A forced reflow occurs when JavaScript queries geometric properties (such as offsetWidth) after styles have been invalidated by a change to the DOM state. This can result in poor performance. Learn more about forced reflows and possible mitigations.

Why this matters

Performance issues directly impact user engagement and conversion rates.

headings: [map[key:source label:Top function call valueType:source-location] map[granularity:1 key:reflowTime label:Total reflow time valueType:ms]]
items: [map[reflowTime:4.665 source:map[column:259 line:117 type:source-location url:https://www.cision.com/etc.clientlibs/cision-revamp/clientlibs/clientlib-common.min.js urlProvider:network]]]
headings: [map[key:source label:Source valueType:source-location] map[granularity:1 key:reflowTime label:Total reflow time valueType:ms]]
items: [map[reflowTime:36.525 source:map[type:text value:[unattributed]]] map[reflowTime:1.321 source:map[column:388 line:43 type:source-location url:https://www.cision.com/etc.clientlibs/cision-revamp/clientlibs/clientlib-common.min.js urlProvider:network]] map[reflowTime:0.179 source:map[column:39 line:150 type:source-location url:https://www.cision.com/etc.clientlibs/cision-revamp/clientlibs/clientlib-common.min.js urlProvider:network]] map[reflowTime:0.116 source:map[column:138 line:150 type:source-location url:https://www.cision.com/etc.clientlibs/cision-revamp/clientlibs/clientlib-common.min.js urlProvider:network]] map[reflowTime:0.125 source:map[column:244 line:150 type:source-location url:https://www.cision.com/etc.clientlibs/cision-revamp/clientlibs/clientlib-common.min.js urlProvider:network]] map[reflowTime:0.041 source:map[column:410 line:43 type:source-location url:https://www.cision.com/etc.clientlibs/cision-revamp/clientlibs/clientlib-common.min.js urlProvider:network]] map[reflowTime:0.162 source:map[column:16 line:152 type:source-location url:https://www.cision.com/etc.clientlibs/cision-revamp/clientlibs/clientlib-common.min.js urlProvider:network]] map[reflowTime:0.146 source:map[column:332 line:46 type:source-location url:https://www.cision.com/etc.clientlibs/cision-revamp/clientlibs/clientlib-common.min.js urlProvider:network]] map[reflowTime:2.575 source:map[column:198 line:209 type:source-location url:https://www.cision.com/etc.clientlibs/cision-revamp/clientlibs/clientlib-common.min.js urlProvider:network]]]

Avoid chaining critical requests by reducing the length of chains, reducing the download size of resources, or deferring the download of unnecessary resources to improve page load.

Why this matters

Performance issues directly impact user engagement and conversion rates.

description: [preconnect](https://developer.chrome.com/docs/lighthouse/performance/uses-rel-preconnect/) hints help the browser establish a connection earlier in the page load, saving time when the first request for that origin is made. The following are the origins that the page preconnected to.
title: Preconnected origins
value: no origins were preconnected
description: Add [preconnect](https://developer.chrome.com/docs/lighthouse/performance/uses-rel-preconnect/) hints to your most important origins, but try to use no more than 4.
title: Preconnect candidates

Consider setting font-display to swap or optional to ensure text is consistently visible. swap can be further optimized to mitigate layout shifts with font metric overrides.

Why this matters

Performance issues directly impact user engagement and conversion rates.

These insights are also available in the Chrome DevTools Performance Panel - record a trace to view more detailed information.

Diagnostics

Consider reducing the time spent parsing, compiling, and executing JS. You may find delivering smaller JS payloads helps with this. Learn how to reduce Javascript execution time.

Why this matters

Performance issues directly impact user engagement and conversion rates.

Consider reducing the time spent parsing, compiling and executing JS. You may find delivering smaller JS payloads helps with this. Learn how to minimize main-thread work

Why this matters

Performance issues directly impact user engagement and conversion rates.

Lists the longest tasks on the main thread, useful for identifying worst contributors to input delay. Learn how to avoid long main-thread tasks

Why this matters

Performance issues directly impact user engagement and conversion rates.

Minifying CSS files can reduce network payload sizes. Learn how to minify CSS.

Why this matters

Performance issues directly impact user engagement and conversion rates.

Estimated savings: 30 ms 13.4 KiB

Reduce unused rules from stylesheets and defer CSS not used for above-the-fold content to decrease bytes consumed by network activity. Learn how to reduce unused CSS.

Why this matters

Performance issues directly impact user engagement and conversion rates.

Estimated savings: 50 ms 56.7 KiB

Reduce unused JavaScript and defer loading scripts until they are required to decrease bytes consumed by network activity. Learn how to reduce unused JavaScript.

Why this matters

Multi-megabyte JavaScript bundles delay every interactive feature on the page.

Learn more

This is the Lighthouse audit fired when too much JS is shipped relative to what executes. The fix isn't a config flag — it requires bundle analysis (webpack-bundle-analyzer, rollup-plugin-visualizer), splitting routes into chunks, lazy-loading off-screen components, and removing unused dependencies. Fundamentally different from minification: minifying reduces byte count, this reduces what's downloaded at all.

Source: Google web.dev / Lighthouse

Many navigations are performed by going back to a previous page, or forwards again. The back/forward cache (bfcache) can speed up these return navigations. Learn more about the bfcache

Why this matters

Performance issues directly impact user engagement and conversion rates.

Failure reasonFailure type
Pages with WebSocket cannot enter back/forward cache.Pending browser support

Minifying JavaScript files can reduce payload sizes and script parse time. Learn how to minify JavaScript.

Why this matters

Performance issues directly impact user engagement and conversion rates.

Estimated savings: 0.0 ms 14.6 KiB

More information about the performance of your application. These numbers don't directly affect the Performance score.

Lists the toplevel main thread tasks that executed during page load.

Why this matters

Performance issues directly impact user engagement and conversion rates.

Collection of useful page vitals.

Why this matters

Performance issues directly impact user engagement and conversion rates.

Redirects introduce additional delays before the page can be loaded. Learn how to avoid page redirects.

Why this matters

Performance issues directly impact user engagement and conversion rates.

Estimated savings: 591 ms
Time to Interactive 1.5 s
Layout shift culprits
Optimize DOM size
Improve image delivery
LCP breakdown
Modern HTTP
Optimize viewport for mobile
Max Potential First Input Delay 50 ms
User Timing marks and measures 5 user timings
Avoid non-composited animations 3 animated elements found
Image elements have explicit `width` and `height`
Network Requests
Network Round Trip Times 50 ms
Server Backend Latencies 160 ms
Metrics
Screenshot Thumbnails
Final Screenshot
Script Treemap Data
Resources Summary
Initial server response time was short Root document took 30 ms
Avoid large layout shifts 4 layout shifts found
INP breakdown
LCP request discovery
91

Accessibility

These checks highlight opportunities to improve the accessibility of your web app. Automatic detection can only detect a subset of issues and does not guarantee the accessibility of your web app, so manual testing is also encouraged.

ARIA

Using ARIA attributes in roles where they are prohibited can mean that important information is not communicated to users of assistive technologies. Learn more about prohibited ARIA roles.

Why this matters

Performance issues directly impact user engagement and conversion rates.

Failing Elements
AI assistant body#basepage-188f9ccd03 > q-focus-sentinel > div
After AI assistant body#basepage-188f9ccd03 > q-focus-sentinel > div
AI assistant, start div#qualified-multimodal-host > div
AI assistant, end div#qualified-multimodal-host > div

These are opportunities to improve the usage of ARIA in your application which may enhance the experience for users of assistive technology, like a screen reader.

Navigation

Properly ordered headings that do not skip levels convey the semantic structure of the page, making it easier to navigate and understand when using assistive technologies. Learn more about heading order.

Why this matters

Performance issues directly impact user engagement and conversion rates.

Failing Elements
div.wrapper > div.bottom > div.privacy > h3 div.wrapper > div.bottom > div.privacy > h3

These are opportunities to improve keyboard navigation in your application.

Names and labels

Link text (and alternate text for images, when used as links) that is discernible, unique, and focusable improves the navigation experience for screen reader users. Learn how to make links accessible.

Why this matters

Performance issues directly impact user engagement and conversion rates.

Failing Elements
div.wrapper > div.column > div.logo > a.first-focusable-element div.wrapper > div.column > div.logo > a.first-focusable-element
div.wrapper > div.top > div.logo > a div.wrapper > div.top > div.logo > a

These are opportunities to improve the semantics of the controls in your application. This may enhance the experience for users of assistive technology, like a screen reader.

Interactive controls are keyboard focusable
Interactive elements indicate their purpose and state
The page has a logical tab order
Visual order on the page follows DOM order
User focus is not accidentally trapped in a region
The user's focus is directed to new content added to the page
HTML5 landmark elements are used to improve navigation
Offscreen content is hidden from assistive technology
Custom controls have associated labels
Custom controls have ARIA roles
`[aria-*]` attributes match their roles
`[aria-hidden="true"]` is not present on the document `<body>`
`[role]`s have all required `[aria-*]` attributes
`[role]` values are valid
`[aria-*]` attributes have valid values
`[aria-*]` attributes are valid and not misspelled
Buttons have an accessible name
`[user-scalable="no"]` is not used in the `<meta name="viewport">` element and the `[maximum-scale]` attribute is not less than 5.
ARIA attributes are used as specified for the element's role
Elements with `role="dialog"` or `role="alertdialog"` have accessible names.
`[aria-hidden="true"]` elements do not contain focusable descendents
Background and foreground colors have a sufficient contrast ratio
Document has a `<title>` element
`<frame>` or `<iframe>` elements have a title
`<html>` element has a `[lang]` attribute
`<html>` element has a valid value for its `[lang]` attribute
Links are distinguishable without relying on color.
Lists contain only `<li>` elements and script supporting elements (`<script>` and `<template>`).
List items (`<li>`) are contained within `<ul>`, `<ol>` or `<menu>` parent elements
No element has a `[tabindex]` value greater than 0
Touch targets have sufficient size and spacing.
Cells in a `<table>` element that use the `[headers]` attribute refer to table cells within the same table.
Document has a main landmark.
Deprecated ARIA roles were not used
All heading elements contain content.
Uses ARIA roles only on compatible elements
Identical links have the same purpose.
Tables use `<caption>` instead of cells with the `[colspan]` attribute to indicate a caption.
`[accesskey]` values are unique
`button`, `link`, and `menuitem` elements have accessible names
ARIA input fields have accessible names
ARIA `meter` elements have accessible names
ARIA `progressbar` elements have accessible names
Elements with an ARIA `[role]` that require children to contain a specific `[role]` have all required children.
`[role]`s are contained by their required parent element
Elements with the `role=text` attribute do not have focusable descendents.
ARIA toggle fields have accessible names
ARIA `tooltip` elements have accessible names
ARIA `treeitem` elements have accessible names
The page contains a heading, skip link, or landmark region
`<dl>`'s contain only properly-ordered `<dt>` and `<dd>` groups, `<script>`, `<template>` or `<div>` elements.
Definition list items are wrapped in `<dl>` elements
ARIA IDs are unique
No form fields have multiple labels
`<html>` element has an `[xml:lang]` attribute with the same base language as the `[lang]` attribute.
Image elements have `[alt]` attributes
Input buttons have discernible text.
`<input type="image">` elements have `[alt]` text
Form elements have associated labels
The document does not use `<meta http-equiv="refresh">`
`<object>` elements have alternate text
Select elements have associated label elements.
Skip links are focusable.
`<th>` elements and elements with `[role="columnheader"/"rowheader"]` have data cells they describe.
`[lang]` attributes have a valid value
`<video>` elements contain a `<track>` element with `[kind="captions"]`
Tables have different content in the summary attribute and `<caption>`.
Image elements do not have `[alt]` attributes that are redundant text.
Elements with visible text labels have matching accessible names.
`<td>` elements in a large `<table>` have one or more table headers.
81

Best Practices

General

Deprecated APIs will eventually be removed from the browser. Learn more about deprecated APIs.

Why this matters

Performance issues directly impact user engagement and conversion rates.

Deprecation / WarningSource
SharedStorage
StorageType.persistent is deprecated. Please use standardized navigator.storage instead.
Fledge
AttributionReporting

Source maps translate minified code to the original source code. This helps developers debug in production. In addition, Lighthouse is able to provide further insights. Consider deploying source maps to take advantage of these benefits. Learn more about source maps.

Why this matters

Performance issues directly impact user engagement and conversion rates.

Uses HTTPS
Avoids third-party cookies
Allows users to paste into input fields
Avoids requesting the geolocation permission on page load
Avoids requesting the notification permission on page load
Displays images with correct aspect ratio
Serves images with appropriate resolution
Page has the HTML doctype
Properly defines charset
No browser errors logged to the console
No issues in the `Issues` panel in Chrome Devtools
Ensure CSP is effective against XSS attacks
Ensure proper origin isolation with COOP
Mitigate DOM-based XSS with Trusted Types
Detected JavaScript libraries
Redirects HTTP traffic to HTTPS
Use a strong HSTS policy
Mitigate clickjacking with XFO or CSP
92

SEO

These checks ensure that your page is following basic search engine optimization advice. There are many additional factors Lighthouse does not score here that may affect your search ranking, including performance on Core Web Vitals. Learn more about Google Search Essentials.

Content Best Practices

Descriptive link text helps search engines understand your content. Learn how to make links more accessible.

Why this matters

Performance issues directly impact user engagement and conversion rates.

Format your HTML in a way that enables crawlers to better understand your app’s content.

Structured data is valid
Page isn’t blocked from indexing
Document has a `<title>` element
Document has a meta description
Page has successful HTTP status code
Links are crawlable
robots.txt is valid
Document has a valid `hreflang`
Document has a valid `rel=canonical`
Image elements have `[alt]` attributes

Send Feedback