United Stated · Santa Clara Completed: Apr 4, 2026 16:08 UTC
Mobile 375 × 812
Desktop 1440 × 900
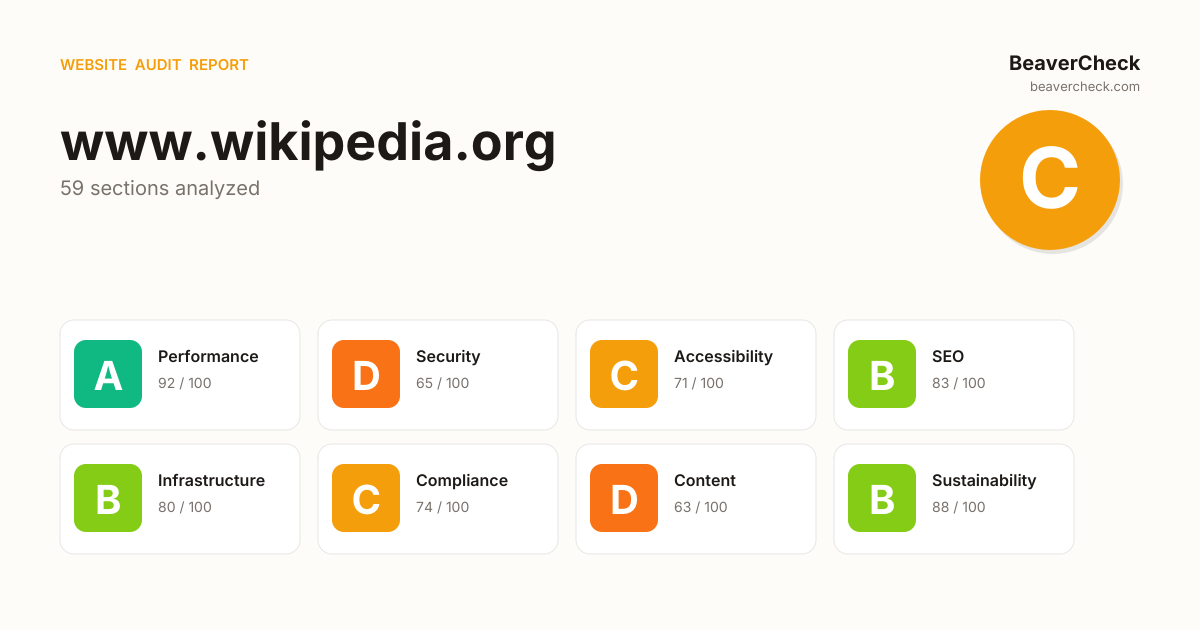
Score: 77 / 100
Based on 8 categories, 0 sections
The overall score is a weighted average of individual category scores. Categories with more impact on user experience and security carry more weight.
Weights reflect general web best practices. Individual needs may differ.
Content-Security-Policy header is missing
No Content-Security-Policy header found
Cookie 'GeoIP' has no SameSite attribute
Cookie 'GeoIP' is missing the HttpOnly flag
Cookie 'NetworkProbeLimit' is missing the HttpOnly flag
[](https://beavercheck.com/results/d28fc466-d5ca-466e-8d7b-39ab1e12aba3)<a href="https://beavercheck.com/results/d28fc466-d5ca-466e-8d7b-39ab1e12aba3"><img src="https://beavercheck.com/badge?url=https%3A%2F%2Fwww.wikipedia.org" alt="BeaverCheck Score"></a>https://beavercheck.com/badge?url=https%3A%2F%2Fwww.wikipedia.orgThis badge auto-updates with your latest scan result.
Thanks for your feedback!
Industry-standard audits powered by Google Lighthouse.
Key metrics that affect user experience.
First Contentful Paint First Contentful Paint — how long until the browser renders the first piece of content. Under 1.8s is good.
1.48 s
Largest Contentful Paint Largest Contentful Paint — how long until the largest visible element loads. Under 2.5s is good.
1.80 s
Total Blocking Time Total Blocking Time — total time the main thread was blocked, preventing user input. Under 200ms is good.
464 ms
Cumulative Layout Shift Cumulative Layout Shift — measures visual stability. How much the page layout shifts during loading. Under 0.1 is good.
0.000
Speed Index Speed Index — how quickly content is visually displayed during load. Under 3.4s is good.
1.56 s
Time to Interactive Time to Interactive — how long until the page is fully interactive and responds to user input. Under 3.8s is good.
2.05 s
Audit breakdown by category with detailed findings.
Remove large, duplicate JavaScript modules from bundles to reduce unnecessary bytes consumed by network activity.
Polyfills and transforms enable older browsers to use new JavaScript features. However, many aren't necessary for modern browsers. Consider modifying your JavaScript build process to not transpile Baseline features, unless you know you must support older browsers. Learn why most sites can deploy ES6+ code without transpiling
3rd party code can significantly impact load performance. Reduce and defer loading of 3rd party code to prioritize your page's content.
Avoid chaining critical requests by reducing the length of chains, reducing the download size of resources, or deferring the download of unnecessary resources to improve page load.
A long cache lifetime can speed up repeat visits to your page. Learn more about caching.
| Request | Cache TTL | Transfer Size |
|---|---|---|
| /portal/wikipedia.org/assets/img/wikipedia25-synthesizer-... | 86400.0 s | 159.1 KiB |
| www.wikipedia.org/portal/wikipedia.org/assets/img/Wikipedia-logo-v2@2x.png | 86400.0 s | 37.6 KiB |
| www.wikipedia.org/portal/wikipedia.org/assets/img/sprite-e49fbf32.svg | 86400.0 s | 18.6 KiB |
| /portal/wikipedia.org/assets/img/wikipedia25-synthesizer-... | 86400.0 s | 16.3 KiB |
| www.wikipedia.org/portal/wikipedia.org/assets/js/index-90de98612a.js | 86400.0 s | 9.7 KiB |
| www.wikipedia.org/portal/wikipedia.org/assets/img/Wikinews-logo_sister@2x.png | 86400.0 s | 4.1 KiB |
| www.wikipedia.org/portal/wikipedia.org/assets/js/gt-ie9-507b16b6be.js | 86400.0 s | 1.3 KiB |
Reducing the download time of images can improve the perceived load time of the page and LCP. Learn more about optimizing image size
| URL | Resource Size | Est Savings | |
|---|---|---|---|
body#www-wikipedia-org > main > div.central-textlogo > video#wikipedia25-video body#www-wikipedia-org > main > div.central-textlogo > video#wikipedia25-video | /portal/wikipedia.org/assets/img/wikipedia25-synthesizer-... | 15.6 KiB | 12.6 KiB |
These insights are also available in the Chrome DevTools Performance Panel - record a trace to view more detailed information.
The maximum potential First Input Delay that your users could experience is the duration of the longest task. Learn more about the Maximum Potential First Input Delay metric.
Consider reducing the time spent parsing, compiling and executing JS. You may find delivering smaller JS payloads helps with this. Learn how to minimize main-thread work
| Category | Time Spent |
|---|---|
| Style & Layout | 2.1 s |
| Other | 326 ms |
| Script Evaluation | 64 ms |
| Rendering | 50 ms |
| Parse HTML & CSS | 44 ms |
| Script Parsing & Compilation | 8.5 ms |
More information about the performance of your application. These numbers don't directly affect the Performance score.
These checks highlight opportunities to improve the accessibility of your web app. Automatic detection can only detect a subset of issues and does not guarantee the accessibility of your web app, so manual testing is also encouraged.
Labels ensure that form controls are announced properly by assistive technologies, like screen readers. Learn more about form element labels.
| Failing Elements |
|---|
form#search-form > fieldset > div#search-input > input#searchInput form#search-form > fieldset > div#search-input > input#searchInput |
These are opportunities to improve the semantics of the controls in your application. This may enhance the experience for users of assistive technology, like a screen reader.
These checks ensure that your page is following basic search engine optimization advice. There are many additional factors Lighthouse does not score here that may affect your search ranking, including performance on Core Web Vitals. Learn more about Google Search Essentials.
Industry-standard audits powered by Google Lighthouse. — Desktop
Key metrics that affect user experience. — Desktop
First Contentful Paint First Contentful Paint — how long until the browser renders the first piece of content. Under 1.8s is good.
255 ms
Largest Contentful Paint Largest Contentful Paint — how long until the largest visible element loads. Under 2.5s is good.
495 ms
Total Blocking Time Total Blocking Time — total time the main thread was blocked, preventing user input. Under 200ms is good.
206 ms
Cumulative Layout Shift Cumulative Layout Shift — measures visual stability. How much the page layout shifts during loading. Under 0.1 is good.
0.000
Speed Index Speed Index — how quickly content is visually displayed during load. Under 3.4s is good.
729 ms
Time to Interactive Time to Interactive — how long until the page is fully interactive and responds to user input. Under 3.8s is good.
603 ms
Audit breakdown by category with detailed findings.
Remove large, duplicate JavaScript modules from bundles to reduce unnecessary bytes consumed by network activity.
Polyfills and transforms enable older browsers to use new JavaScript features. However, many aren't necessary for modern browsers. Consider modifying your JavaScript build process to not transpile Baseline features, unless you know you must support older browsers. Learn why most sites can deploy ES6+ code without transpiling
3rd party code can significantly impact load performance. Reduce and defer loading of 3rd party code to prioritize your page's content.
A long cache lifetime can speed up repeat visits to your page. Learn more about caching.
| Request | Cache TTL | Transfer Size |
|---|---|---|
| /portal/wikipedia.org/assets/img/wikipedia25-synthesizer-... | 86400.0 s | 159.1 KiB |
| www.wikipedia.org/portal/wikipedia.org/assets/img/sprite-e49fbf32.svg | 86400.0 s | 18.6 KiB |
| www.wikipedia.org/portal/wikipedia.org/assets/img/Wikipedia-logo-v2.png | 86400.0 s | 16.4 KiB |
| /portal/wikipedia.org/assets/img/wikipedia25-synthesizer-... | 86400.0 s | 16.3 KiB |
| www.wikipedia.org/portal/wikipedia.org/assets/js/index-90de98612a.js | 86400.0 s | 9.7 KiB |
| www.wikipedia.org/portal/wikipedia.org/assets/img/Wikinews-logo_sister.png | 86400.0 s | 2.8 KiB |
| www.wikipedia.org/portal/wikipedia.org/assets/js/gt-ie9-507b16b6be.js | 86400.0 s | 1.3 KiB |
Optimize LCP by making the LCP image discoverable from the HTML immediately, and avoiding lazy-loading
Avoid chaining critical requests by reducing the length of chains, reducing the download size of resources, or deferring the download of unnecessary resources to improve page load.
Reducing the download time of images can improve the perceived load time of the page and LCP. Learn more about optimizing image size
| URL | Resource Size | Est Savings | |
|---|---|---|---|
body#www-wikipedia-org > main > div.central-textlogo > video#wikipedia25-video body#www-wikipedia-org > main > div.central-textlogo > video#wikipedia25-video | /portal/wikipedia.org/assets/img/wikipedia25-synthesizer-... | 15.6 KiB | 11.7 KiB |
These insights are also available in the Chrome DevTools Performance Panel - record a trace to view more detailed information.
The maximum potential First Input Delay that your users could experience is the duration of the longest task. Learn more about the Maximum Potential First Input Delay metric.
These checks highlight opportunities to improve the accessibility of your web app. Automatic detection can only detect a subset of issues and does not guarantee the accessibility of your web app, so manual testing is also encouraged.
These checks ensure that your page is following basic search engine optimization advice. There are many additional factors Lighthouse does not score here that may affect your search ranking, including performance on Core Web Vitals. Learn more about Google Search Essentials.
Send Feedback