Brazil · Sao Paulo Completed: Apr 4, 2026 17:25 UTC
Mobile 375 × 812

Desktop 1440 × 900
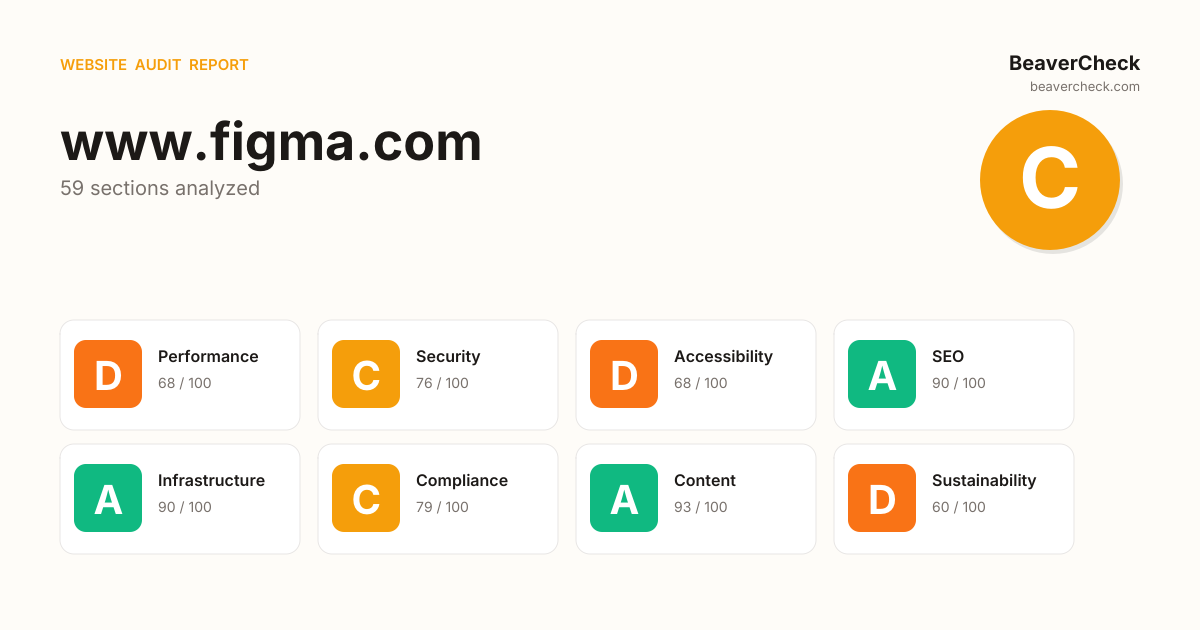
Score: 76 / 100
Based on 8 categories, 0 sections
The overall score is a weighted average of individual category scores. Categories with more impact on user experience and security carry more weight.
Weights reflect general web best practices. Individual needs may differ.
'unsafe-eval' found in script source
'unsafe-inline' found in script source
Page weighs 21.3 MB (6.2 MB transferred)
2 link(s) with no accessible text
9 image-only link(s) without alt text
[](https://beavercheck.com/results/d4731502-5cbc-42ff-8b5a-536718afb3e9)<a href="https://beavercheck.com/results/d4731502-5cbc-42ff-8b5a-536718afb3e9"><img src="https://beavercheck.com/badge?url=https%3A%2F%2Fwww.figma.com" alt="BeaverCheck Score"></a>https://beavercheck.com/badge?url=https%3A%2F%2Fwww.figma.comThis badge auto-updates with your latest scan result.
Thanks for your feedback!
Industry-standard audits powered by Google Lighthouse.
Key metrics that affect user experience.
First Contentful Paint First Contentful Paint — how long until the browser renders the first piece of content. Under 1.8s is good.
1.92 s
Largest Contentful Paint Largest Contentful Paint — how long until the largest visible element loads. Under 2.5s is good.
16.52 s
Total Blocking Time Total Blocking Time — total time the main thread was blocked, preventing user input. Under 200ms is good.
3.36 s
Cumulative Layout Shift Cumulative Layout Shift — measures visual stability. How much the page layout shifts during loading. Under 0.1 is good.
0.081
Speed Index Speed Index — how quickly content is visually displayed during load. Under 3.4s is good.
8.90 s
Time to Interactive Time to Interactive — how long until the page is fully interactive and responds to user input. Under 3.8s is good.
16.91 s
Audit breakdown by category with detailed findings.
Remove large, duplicate JavaScript modules from bundles to reduce unnecessary bytes consumed by network activity.
Polyfills and transforms enable older browsers to use new JavaScript features. However, many aren't necessary for modern browsers. Consider modifying your JavaScript build process to not transpile Baseline features, unless you know you must support older browsers. Learn why most sites can deploy ES6+ code without transpiling
3rd party code can significantly impact load performance. Reduce and defer loading of 3rd party code to prioritize your page's content.
A forced reflow occurs when JavaScript queries geometric properties (such as offsetWidth) after styles have been invalidated by a change to the DOM state. This can result in poor performance. Learn more about forced reflows and possible mitigations.
Avoid chaining critical requests by reducing the length of chains, reducing the download size of resources, or deferring the download of unnecessary resources to improve page load.
A long cache lifetime can speed up repeat visits to your page. Learn more about caching.
Reducing the download time of images can improve the perceived load time of the page and LCP. Learn more about optimizing image size
| URL | Resource Size | Est Savings | |
|---|---|---|---|
Multiple assets surrounding button to "Export assets" div.fig-92lpi3 > section.fig-gcn2ga > div.fig-z0kf9t > img.fig-vgi589 | /images/599r6htc/regionalized/d2d61daa22d944ec3cd62677c2a... | 100.5 KiB | 91.2 KiB |
A UI design interface showing card components for a travel app. The left side d… div.fig-92lpi3 > section.fig-gcn2ga > div.fig-z0kf9t > img.fig-vgi589 | /images/599r6htc/regionalized/2f1c0ba703010a1b4126b14a9b0... | 32.5 KiB | 29.5 KiB |
Screenshot of a design-to-code interface showing completed API calls on the lef… div.fig-gvtxu4 > div#drawer-content-_R_6daj9bsnpgqaivb_ > div.fig-1o2fbcf > img.fig-j94shh | /images/599r6htc/regionalized/24e122cd8a5089bd145f3fd46a3... | 21.8 KiB | 14.7 KiB |
Requests are blocking the page's initial render, which may delay LCP. Deferring or inlining can move these network requests out of the critical path.
These insights are also available in the Chrome DevTools Performance Panel - record a trace to view more detailed information.
The maximum potential First Input Delay that your users could experience is the duration of the longest task. Learn more about the Maximum Potential First Input Delay metric.
Time to Interactive is the amount of time it takes for the page to become fully interactive. Learn more about the Time to Interactive metric.
Reduce unused JavaScript and defer loading scripts until they are required to decrease bytes consumed by network activity. Learn how to reduce unused JavaScript.
| URL | Transfer Size | Est Savings |
|---|---|---|
| www.figma.com/_netlify/_next/static/chunks/8992-43f84a35aafd5858.js | 398.8 KiB | 83.3 KiB |
| www.figma.com/_netlify/_next/static/chunks/5113-2553d73f091b8664.js | 111.5 KiB | 66.6 KiB |
| www.figma.com/_netlify/_next/static/chunks/3914-2bab184028cadf54.js | 109.5 KiB | 52.4 KiB |
| www.figma.com/_netlify/_next/static/chunks/1293-26f3a1be0c9e8c0c.js | 48.6 KiB | 41.8 KiB |
| www.figma.com/_netlify/_next/static/chunks/bf76e631-047ac0aae52ca139.js | 38.3 KiB | 33.1 KiB |
| www.figma.com/_netlify/_next/static/chunks/4867-f406a2b91c16aafd.js | 47.8 KiB | 27.4 KiB |
Consider reducing the time spent parsing, compiling, and executing JS. You may find delivering smaller JS payloads helps with this. Learn how to reduce Javascript execution time.
| URL | Total CPU Time | Script Evaluation | Script Parse |
|---|---|---|---|
| www.figma.com/_netlify/_next/static/chunks/3914-2bab184028cadf54.js | 6.0 s | 5.1 s | 55 ms |
| www.figma.com/ | 3.4 s | 75 ms | 258 ms |
| Unattributable | 1.1 s | 21 ms | 0.0 ms |
| www.figma.com/_netlify/_next/static/chunks/8992-43f84a35aafd5858.js | 1.0 s | 843 ms | 183 ms |
| www.figma.com/_netlify/_next/static/chunks/4867-f406a2b91c16aafd.js | 102 ms | 7.9 ms | 17 ms |
| player.vimeo.com/api/player.js | 70 ms | 54 ms | 3.5 ms |
| www.figma.com/_netlify/_next/static/chunks/5113-2553d73f091b8664.js | 70 ms | 3.9 ms | 66 ms |
| www.figma.com/_netlify/_next/static/chunks/4bd1b696-be5ceba1b1a33b39.js | 53 ms | 30 ms | 22 ms |
Consider reducing the time spent parsing, compiling and executing JS. You may find delivering smaller JS payloads helps with this. Learn how to minimize main-thread work
| Category | Time Spent |
|---|---|
| Script Evaluation | 6.2 s |
| Other | 2.9 s |
| Style & Layout | 922 ms |
| Rendering | 713 ms |
| Script Parsing & Compilation | 701 ms |
| Parse HTML & CSS | 366 ms |
| Garbage Collection | 167 ms |
Reduce unused rules from stylesheets and defer CSS not used for above-the-fold content to decrease bytes consumed by network activity. Learn how to reduce unused CSS.
| URL | Transfer Size | Est Savings |
|---|---|---|
| html{line-height:1.15;-webkit-text-size-adjust:100%;} … | 28.5 KiB | 19.1 KiB |
Large network payloads cost users real money and are highly correlated with long load times. Learn how to reduce payload sizes.
More information about the performance of your application. These numbers don't directly affect the Performance score.
These checks highlight opportunities to improve the accessibility of your web app. Automatic detection can only detect a subset of issues and does not guarantee the accessibility of your web app, so manual testing is also encouraged.
Focusable descendents within an `[aria-hidden="true"]` element prevent those interactive elements from being available to users of assistive technologies like screen readers. Learn how `aria-hidden` affects focusable elements.
| Failing Elements |
|---|
Make my cursor reveal an image div.fig-cf28vb > div.fig-1dfrfw8 > div.fig-1j1iokz > div.fig-1cbvupn |
Make an infinite canvas gallery div.fig-cf28vb > div.fig-1dfrfw8 > div.fig-1j1iokz > div.fig-1cbvupn |
Make this design move with a parallax effect div.fig-cf28vb > div.fig-1dfrfw8 > div.fig-1j1iokz > div.fig-1cbvupn |
Make these photos rotate in 3D div.fig-cf28vb > div.fig-1dfrfw8 > div.fig-1j1iokz > div.fig-1cbvupn |
Make my site squish when scrolled div.fig-cf28vb > div.fig-1dfrfw8 > div.fig-1j1iokz > div.fig-1cbvupn |
Make a clock with a shader background div.fig-cf28vb > div.fig-1dfrfw8 > div.fig-1j1iokz > div.fig-1cbvupn |
Make text move on a path div.fig-cf28vb > div.fig-1dfrfw8 > div.fig-1j1iokz > div.fig-1cbvupn |
These are opportunities to improve the usage of ARIA in your application which may enhance the experience for users of assistive technology, like a screen reader.
Touch targets with sufficient size and spacing help users who may have difficulty targeting small controls to activate the targets. Learn more about touch targets.
| Failing Elements |
|---|
Masaya Takizawa ul.fig-ge4hzg > li > article > a.fig-9ka48u |
Raul Marin Calleja ul.fig-ge4hzg > li > article > a.fig-9ka48u |
Seungmee Lee ul.fig-ge4hzg > li > article > a.fig-9ka48u |
Ayaneshu Bhardwaj ul.fig-ge4hzg > li > article > a.fig-9ka48u |
Gui Seiz ul.fig-ge4hzg > li > article > a.fig-9ka48u |
Benjamin Leonard ul.fig-ge4hzg > li > article > a.fig-9ka48u |
Nayli C. Naza ul.fig-ge4hzg > li > article > a.fig-9ka48u |
Holly Li ul.fig-ge4hzg > li > article > a.fig-9ka48u |
These items highlight common accessibility best practices.
Visible text labels that do not match the accessible name can result in a confusing experience for screen reader users. Learn more about accessible names.
| Failing Elements |
|---|
English div.fig-19c8ja > div.fig-17o2drt > div.fig-79elbk > button.fig-xhgx56 |
Image display dimensions should match natural aspect ratio. Learn more about image aspect ratio.
Source maps translate minified code to the original source code. This helps developers debug in production. In addition, Lighthouse is able to provide further insights. Consider deploying source maps to take advantage of these benefits. Learn more about source maps.
These checks ensure that your page is following basic search engine optimization advice. There are many additional factors Lighthouse does not score here that may affect your search ranking, including performance on Core Web Vitals. Learn more about Google Search Essentials.
Industry-standard audits powered by Google Lighthouse. — Desktop
Key metrics that affect user experience. — Desktop
First Contentful Paint First Contentful Paint — how long until the browser renders the first piece of content. Under 1.8s is good.
846 ms
Largest Contentful Paint Largest Contentful Paint — how long until the largest visible element loads. Under 2.5s is good.
1.89 s
Total Blocking Time Total Blocking Time — total time the main thread was blocked, preventing user input. Under 200ms is good.
294 ms
Cumulative Layout Shift Cumulative Layout Shift — measures visual stability. How much the page layout shifts during loading. Under 0.1 is good.
0.188
Speed Index Speed Index — how quickly content is visually displayed during load. Under 3.4s is good.
2.09 s
Time to Interactive Time to Interactive — how long until the page is fully interactive and responds to user input. Under 3.8s is good.
3.43 s
Audit breakdown by category with detailed findings.
Remove large, duplicate JavaScript modules from bundles to reduce unnecessary bytes consumed by network activity.
Polyfills and transforms enable older browsers to use new JavaScript features. However, many aren't necessary for modern browsers. Consider modifying your JavaScript build process to not transpile Baseline features, unless you know you must support older browsers. Learn why most sites can deploy ES6+ code without transpiling
3rd party code can significantly impact load performance. Reduce and defer loading of 3rd party code to prioritize your page's content.
Layout shifts occur when elements move absent any user interaction. Investigate the causes of layout shifts, such as elements being added, removed, or their fonts changing as the page loads.
A forced reflow occurs when JavaScript queries geometric properties (such as offsetWidth) after styles have been invalidated by a change to the DOM state. This can result in poor performance. Learn more about forced reflows and possible mitigations.
Avoid chaining critical requests by reducing the length of chains, reducing the download size of resources, or deferring the download of unnecessary resources to improve page load.
Requests are blocking the page's initial render, which may delay LCP. Deferring or inlining can move these network requests out of the critical path.
| URL | Transfer Size | Duration |
|---|---|---|
| www.figma.com/_netlify/_next/static/css/f564ddd3fbf8f7e4.css | 765 B | 239 ms |
| www.figma.com/_netlify/_next/static/css/f03300ce0c70ed64.css | 898 B | 95 ms |
A long cache lifetime can speed up repeat visits to your page. Learn more about caching.
Reducing the download time of images can improve the perceived load time of the page and LCP. Learn more about optimizing image size
| URL | Resource Size | Est Savings | |
|---|---|---|---|
Screenshot of a web design interface showing a museum website with artwork disp… div.fig-92lpi3 > section.fig-gcn2ga > div.fig-1qkml7u > img.fig-vekl8e | /images/599r6htc/regionalized/278b3fae156f139de38afab1b01... | 100.6 KiB | 89.2 KiB |
Multiple assets surrounding button to "Export assets" div.fig-92lpi3 > section.fig-gcn2ga > div.fig-z0kf9t > img.fig-vgi589 | /images/599r6htc/regionalized/d2d61daa22d944ec3cd62677c2a... | 105.0 KiB | 81.9 KiB |
Screenshot of a design-to-code interface showing completed API calls on the lef… div.fig-gvtxu4 > div#drawer-content-_R_6daj9bsnpgqaivb_ > div.fig-1o2fbcf > img.fig-j94shh | /images/599r6htc/regionalized/24e122cd8a5089bd145f3fd46a3... | 58.2 KiB | 43.9 KiB |
A UI design interface showing card components for a travel app. The left side d… div.fig-92lpi3 > section.fig-gcn2ga > div.fig-z0kf9t > img.fig-vgi589 | /images/599r6htc/regionalized/2f1c0ba703010a1b4126b14a9b0... | 34.7 KiB | 27.0 KiB |
These insights are also available in the Chrome DevTools Performance Panel - record a trace to view more detailed information.
These are the largest layout shifts observed on the page. Each table item represents a single layout shift, and shows the element that shifted the most. Below each item are possible root causes that led to the layout shift. Some of these layout shifts may not be included in the CLS metric value due to windowing. Learn how to improve CLS
| Element | Layout shift score |
|---|---|
Make my cursor reveal an image
Make my cursor reveal an image
Get started
SLID… main#main > section.fig-dvbxa9 > div#_R_2gpbsnpgqaivb_ > div.fig-cf28vb | 0.172 |
Logo marquee body > div#app > main#main > section.fig-1db00we | 0.018 |
div.fig-cf28vb > div.fig-bpnbm5 > div.fig-17xhnpg > div.fig-1na308s div.fig-cf28vb > div.fig-bpnbm5 > div.fig-17xhnpg > div.fig-1na308s | 0.012 |
span.fig-bytzjo | 0.000 |
span.fig-bytzjo | 0.000 |
span.fig-bytzjo | 0.000 |
span.fig-bytzjo | 0.000 |
span.fig-bytzjo | 0.000 |
span.fig-bytzjo | 0.000 |
span.fig-bytzjo | 0.000 |
span.fig-bytzjo | 0.000 |
span.fig-bytzjo | 0.000 |
span.fig-bytzjo | 0.000 |
span.fig-bytzjo | 0.000 |
span.fig-bytzjo | 0.000 |
The maximum potential First Input Delay that your users could experience is the duration of the longest task. Learn more about the Maximum Potential First Input Delay metric.
Time to Interactive is the amount of time it takes for the page to become fully interactive. Learn more about the Time to Interactive metric.
Reduce unused JavaScript and defer loading scripts until they are required to decrease bytes consumed by network activity. Learn how to reduce unused JavaScript.
| URL | Transfer Size | Est Savings |
|---|---|---|
| www.figma.com/_netlify/_next/static/chunks/8992-43f84a35aafd5858.js | 398.8 KiB | 83.3 KiB |
| www.figma.com/_netlify/_next/static/chunks/5113-2553d73f091b8664.js | 111.5 KiB | 66.6 KiB |
| www.figma.com/_netlify/_next/static/chunks/3914-2bab184028cadf54.js | 109.5 KiB | 52.1 KiB |
| www.figma.com/_netlify/_next/static/chunks/1293-26f3a1be0c9e8c0c.js | 48.6 KiB | 41.8 KiB |
| www.figma.com/_netlify/_next/static/chunks/bf76e631-047ac0aae52ca139.js | 38.3 KiB | 33.1 KiB |
| www.figma.com/_netlify/_next/static/chunks/4867-f406a2b91c16aafd.js | 47.8 KiB | 27.3 KiB |
Consider reducing the time spent parsing, compiling, and executing JS. You may find delivering smaller JS payloads helps with this. Learn how to reduce Javascript execution time.
| URL | Total CPU Time | Script Evaluation | Script Parse |
|---|---|---|---|
| www.figma.com/_netlify/_next/static/chunks/3914-2bab184028cadf54.js | 1.5 s | 1.3 s | 14 ms |
| www.figma.com/ | 832 ms | 19 ms | 69 ms |
| Unattributable | 291 ms | 5.9 ms | 0.0 ms |
| www.figma.com/_netlify/_next/static/chunks/8992-43f84a35aafd5858.js | 267 ms | 215 ms | 45 ms |
Consider reducing the time spent parsing, compiling and executing JS. You may find delivering smaller JS payloads helps with this. Learn how to minimize main-thread work
| Category | Time Spent |
|---|---|
| Script Evaluation | 1.6 s |
| Other | 733 ms |
| Style & Layout | 307 ms |
| Script Parsing & Compilation | 175 ms |
| Rendering | 137 ms |
| Parse HTML & CSS | 72 ms |
| Garbage Collection | 58 ms |
Reduce unused rules from stylesheets and defer CSS not used for above-the-fold content to decrease bytes consumed by network activity. Learn how to reduce unused CSS.
| URL | Transfer Size | Est Savings |
|---|---|---|
| html{line-height:1.15;-webkit-text-size-adjust:100%;} … | 28.5 KiB | 16.6 KiB |
Large network payloads cost users real money and are highly correlated with long load times. Learn how to reduce payload sizes.
More information about the performance of your application. These numbers don't directly affect the Performance score.
These checks highlight opportunities to improve the accessibility of your web app. Automatic detection can only detect a subset of issues and does not guarantee the accessibility of your web app, so manual testing is also encouraged.
Focusable descendents within an `[aria-hidden="true"]` element prevent those interactive elements from being available to users of assistive technologies like screen readers. Learn how `aria-hidden` affects focusable elements.
| Failing Elements |
|---|
Make my cursor reveal an image div.fig-cf28vb > div.fig-1dfrfw8 > div.fig-1j1iokz > div.fig-1cbvupn |
Make an infinite canvas gallery div.fig-cf28vb > div.fig-1dfrfw8 > div.fig-1j1iokz > div.fig-1cbvupn |
Make this design move with a parallax effect div.fig-cf28vb > div.fig-1dfrfw8 > div.fig-1j1iokz > div.fig-1cbvupn |
Make these photos rotate in 3D div.fig-cf28vb > div.fig-1dfrfw8 > div.fig-1j1iokz > div.fig-1cbvupn |
Make my site squish when scrolled div.fig-cf28vb > div.fig-1dfrfw8 > div.fig-1j1iokz > div.fig-1cbvupn |
Make a clock with a shader background div.fig-cf28vb > div.fig-1dfrfw8 > div.fig-1j1iokz > div.fig-1cbvupn |
Make text move on a path div.fig-cf28vb > div.fig-1dfrfw8 > div.fig-1j1iokz > div.fig-1cbvupn |
These are opportunities to improve the usage of ARIA in your application which may enhance the experience for users of assistive technology, like a screen reader.
Touch targets with sufficient size and spacing help users who may have difficulty targeting small controls to activate the targets. Learn more about touch targets.
| Failing Elements |
|---|
Masaya Takizawa ul.fig-ge4hzg > li > article > a.fig-9ka48u |
Raul Marin Calleja ul.fig-ge4hzg > li > article > a.fig-9ka48u |
Seungmee Lee ul.fig-ge4hzg > li > article > a.fig-9ka48u |
Ayaneshu Bhardwaj ul.fig-ge4hzg > li > article > a.fig-9ka48u |
Gui Seiz ul.fig-ge4hzg > li > article > a.fig-9ka48u |
Benjamin Leonard ul.fig-ge4hzg > li > article > a.fig-9ka48u |
Nayli C. Naza ul.fig-ge4hzg > li > article > a.fig-9ka48u |
Holly Li ul.fig-ge4hzg > li > article > a.fig-9ka48u |
These items highlight common accessibility best practices.
Visible text labels that do not match the accessible name can result in a confusing experience for screen reader users. Learn more about accessible names.
| Failing Elements |
|---|
English div.fig-19c8ja > div.fig-17o2drt > div.fig-79elbk > button.fig-xhgx56 |
Image display dimensions should match natural aspect ratio. Learn more about image aspect ratio.
Source maps translate minified code to the original source code. This helps developers debug in production. In addition, Lighthouse is able to provide further insights. Consider deploying source maps to take advantage of these benefits. Learn more about source maps.
These checks ensure that your page is following basic search engine optimization advice. There are many additional factors Lighthouse does not score here that may affect your search ranking, including performance on Core Web Vitals. Learn more about Google Search Essentials.
Send Feedback