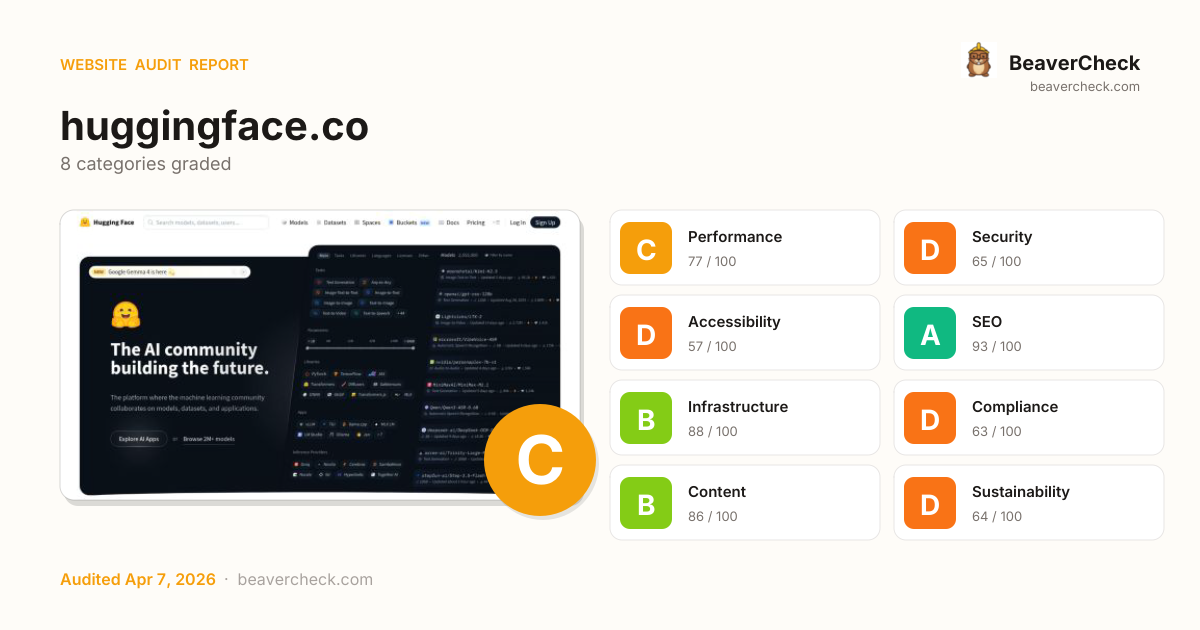
Audit overview
4 categories need attention: Security, and 3 others.
Fix Priority Matrix
5 findingsQuick Wins
2High impact, low effort — start here.
Strategic
3High impact, requires investment.
Easy Improvements
0Small gains, minimal effort.
Nothing in this quadrant — good news.
Deprioritize
0Low impact, high effort — do last.
Nothing in this quadrant — good news.
Screenshots

Top Priorities (5)
Content-Security-Policy header is missing
Without a CSP, a single XSS bug can exfiltrate everything your users type — including credentials.
HSTS header is missing
Without HSTS, a network attacker can downgrade the very first connection to HTTP and steal the user's session.
No Content-Security-Policy header found
Without a CSP, a single XSS bug can exfiltrate everything users type — credentials, payment data, session tokens.
4 button(s) with no accessible text
Buttons with no accessible text (icon-only, no aria-label) can't be activated by voice control or understood by screen readers.
Cross-Origin-Embedder-Policy header is missing
COEP enforces that all embedded resources opt-in to cross-origin embedding — required for cross-origin isolation features.
Business case
What fixing the audit's findings is worth -- and what ignoring them keeps costing.
Return on investment
€659 investment → €7,074/month returns + EUR 120,500,000 risk avoided
Figures combine localized regulatory fine ceilings, search/conversion value priced against local CPC, and bandwidth waste estimates. Results depend on implementation quality and audience composition. Not legal or financial advice.
Conversion barriers
8 barrier(s) likely increasing bounce by ~23%.
- Page feels frozen for 1.2sClicks on the primary CTA are ignored while JavaScript runs→ Break up long tasks; defer non-critical JavaScript to post-hydration
- Page loads in 3.8sEvery additional 100ms above 2.5s costs conversions — you're 1.3s over→ Target <2.5s LCP: defer non-critical scripts and optimize the hero image
- No HSTS headerReturning visitors are briefly exposed to downgrade attacks on first request→ Set Strict-Transport-Security: max-age=31536000; includeSubDomains
- No Content-Security-Policy headerHigher XSS blast radius — one compromised script can exfiltrate the checkout form→ Ship a reporting-only CSP first, then enforce once violations are clean
- Viewport disables user zoomVisitors with low vision can't read the page — and some jurisdictions treat this as a legal risk→ Remove user-scalable=no; drop maximum-scale if it's below 2
Preliminary CRO audit — each barrier links to the tab with detailed analysis.
Remediation cost
Start here for the best return on investment
Cost by category
Cost by effort level
Adjust assumptions
Team composition
Multiplier applied to dev hours to reflect QA, design, and PM overhead. Use Dev only for solo work; Full team for projects with formal review processes.
Rates reflect fully-loaded developer cost including overhead
Warning:Cost of inaction
Compliance Risk
€120.500.000
- No privacy policy link detectedGDPR: EUR 10.000 – EUR 20.000.000
- Trackers detected but no cookie policy foundGDPR: EUR 5.000 – EUR 10.000.000
- Trackers detected but no cookie policy foundGDPR: EUR 10.000 – EUR 20.000.000
Bounce-Rate Cost
€5.096 /mo
+23.2pp bounce · ~2,316 lost visitors/mo
CPC: EUR 2.20
Bandwidth Waste
€0,72 /mo
9766.0 MB/mo × 0.074 EUR/GB
- Optimize transfer: save ~977 KB per page loadSaves €0,72/mo
Compliance figures represent the statutory maximum fine for the most severe triggered category, capped per regulation — not the sum of per-finding penalties. Based on published regulatory fine ranges. This is not legal advice.
Unique monthly visitors from your analytics
Purchases, signups, or key actions
Optional — for revenue estimation
more engaged visitors from reduced bounce
Fix 4 critical issues to capture this value
How this is calculated
Based on Google/Deloitte research ("Milliseconds Make Millions") showing a ~7% bounce rate increase per additional second of LCP above the 2.5s "Good" threshold.
Your site's LCP: → estimated after fixes.
These are estimates based on industry research — actual results vary
Your data stays in your browser — nothing is sent to our servers
Lighthouse
Mobile
First Contentful Paint First Contentful Paint — how long until the browser renders the first piece of content. Under 1.8s is good.
2.25 s
Largest Contentful Paint Largest Contentful Paint — how long until the largest visible element loads. Under 2.5s is good.
3.78 s
Total Blocking Time Total Blocking Time — total time the main thread was blocked, preventing user input. Under 200ms is good.
1.21 s
Cumulative Layout Shift Cumulative Layout Shift — measures visual stability. How much the page layout shifts during loading. Under 0.1 is good.
0.000
Speed Index Speed Index — how quickly content is visually displayed during load. Under 3.4s is good.
2.33 s
Time to Interactive Time to Interactive — how long until the page is fully interactive and responds to user input. Under 3.8s is good.
14.30 s
Desktop
First Contentful Paint First Contentful Paint — how long until the browser renders the first piece of content. Under 1.8s is good.
634 ms
Largest Contentful Paint Largest Contentful Paint — how long until the largest visible element loads. Under 2.5s is good.
905 ms
Total Blocking Time Total Blocking Time — total time the main thread was blocked, preventing user input. Under 200ms is good.
116 ms
Cumulative Layout Shift Cumulative Layout Shift — measures visual stability. How much the page layout shifts during loading. Under 0.1 is good.
0.018
Speed Index Speed Index — how quickly content is visually displayed during load. Under 3.4s is good.
777 ms
Time to Interactive Time to Interactive — how long until the page is fully interactive and responds to user input. Under 3.8s is good.
2.11 s
Categories
8Performance
All checks pass
Security
Content-Security-Policy header is missing
Accessibility
4 button(s) with no accessible text
SEO
All checks pass
Infrastructure
All checks pass
Compliance
All checks pass
Content
All checks pass
Sustainability
All checks pass
How you compare
Where this site stands against peers running the same stack.
Top 10% of Amazon Route 53 sites score 86+ on Compliance; you're at 63 — closing this gap is the highest-leverage improvement.
Top 10% of Apple sites score 85+ on Compliance; you're at 63 — closing this gap is the highest-leverage improvement.
Technology stack
Amazon Route 53, hosted on AWS, with AWS CloudFront CDN
Stack Architecture
 Plausible
  Stripe 3
 Google Font API Google Search Console Google Workspace
  KaTeX Microsoft
  Open Graph
  RSS
RSS  Tailwind CSS
  Workable
  AWS CloudFront Amazon CloudFront
  Cloudflare
  cdnjs
cdnjs  AWS Amazon Web Services
 All Detected Technologies (19)
Amazon CloudFront is a fast content delivery network (CDN) service that securely delivers data, videos, applications, and APIs to customers globally with low latency, high transfer speeds.
Cloudflare is a web-infrastructure and website-security company, providing content-delivery-network services, DDoS mitigation, Internet security, and distributed domain-name-server services.
cdnjs is a free distributed JS library delivery service.
Amazon Web Services (AWS) is a comprehensive cloud services platform offering compute power, database storage, content delivery and other functionality.
Google Font API is a web service that supports open-source font files that can be used on your web designs.
KaTeX is a cross-browser JavaScript library that displays mathematical notation in web browsers.
Open Graph is a protocol that is used to integrate any web page into the social graph.
RSS is a family of web feed formats used to publish frequently updated works—such as blog entries, news headlines, audio, and video—in a standardized format.
Workable is the all-in-one hiring solution.
Plausible is an open-source alternative to Google Analytics.
Stripe offers online payment processing for internet businesses as well as fraud prevention, invoicing and subscription management.
Observations (2)
No build tool detected
A framework (Amazon Route 53) was detected but no bundler was identified. The build tool may not be detectable from output patterns, or the site may use the framework's built-in bundler.
Complex technology stack detected
19 technologies identified. A complex stack increases maintenance burden and attack surface. Consider whether all components are actively needed.
Show your score
Drop this badge on your README, marketing site, or status page. It auto-updates every time the audit re-runs and links back to this report.
This badge auto-updates with your latest scan result.
[](https://beavercheck.com/results/d72d6cb5-9cdf-a84c-81a9-2e08fbc4e861)<a href="https://beavercheck.com/results/d72d6cb5-9cdf-a84c-81a9-2e08fbc4e861"><img src="https://beavercheck.com/badge?url=https%3A%2F%2Fhuggingface.co" alt="BeaverCheck Score"></a>https://beavercheck.com/badge?url=https%3A%2F%2Fhuggingface.coExport & share
Download the audit, share with your team, or grab a fix plan ready to copy into your tracker.
Copies markdown to clipboard
Fix Plan
Three-week roadmap to ship the audit's findings, with one-click copy targets for your tracker.
Three-week fix plan
2 sprints · 8h total → projected B (81)
Sprint 1: Quick Wins
+4Highest ROI — low effort, high impact
- · HSTS header is missing
- · 4 button(s) with no accessible text
Sprint 2: Core Fixes
+4Medium effort, high structural impact
- · Content-Security-Policy header is missing
- · No Content-Security-Policy header found
- · Cross-Origin-Embedder-Policy header is missing