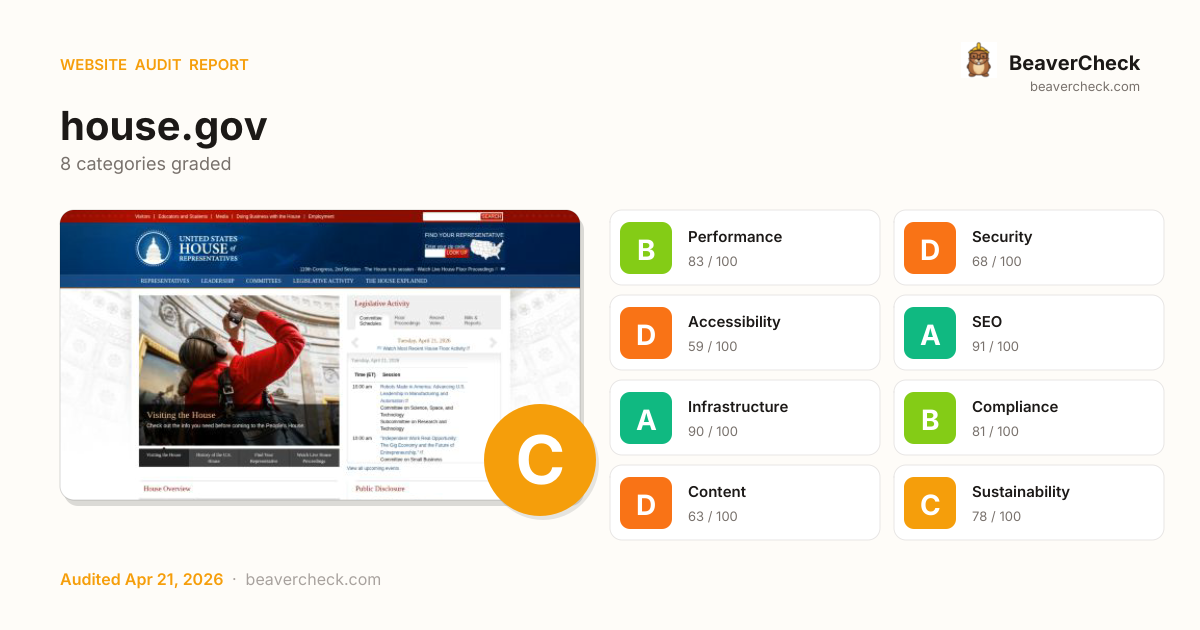
URL substituted: You submitted https://house.gov but we scanned https://www.house.gov instead — the HTTPS certificate on the submitted hostname didn't cover that name, so we retried on the www. variant
Mobile 375 × 812

Desktop 1440 × 900

Score: 76 / 100
Based on 8 categories, 0 sections
Decent speed, but optimizing further could improve engagement.
Several missing protections leave your users and data exposed.
Several issues make your site difficult for assistive technology users.
Well-optimized for search — your content is discoverable.
Solid infrastructure — fast server responses across the board.
Mostly compliant — a few items need attention.
Missing metadata means poor previews on social media and search.
Reasonable footprint with room for optimization.
The overall score is a weighted average of individual category scores. Categories with more impact on user experience and security carry more weight.
Weights reflect general web best practices. Individual needs may differ.
1 link(s) with no accessible text
Accessibility issues exclude users with disabilities — up to 15% of your potential audience.
4 control(s) without accessible label
Accessibility issues exclude users with disabilities — up to 15% of your potential audience.
Cross-Origin-Embedder-Policy header is missing
Security gaps expose your site and users to attacks, eroding trust.
Cross-Origin-Opener-Policy header is missing
Security gaps expose your site and users to attacks, eroding trust.
External script from www.googletagmanager.com lacks integrity attribute
Security gaps expose your site and users to attacks, eroding trust.
High impact, low effort — start here.
High impact, requires investment.
Small gains, minimal effort.
Nothing in this quadrant — good news.
Low impact, high effort — do last.
Nothing in this quadrant — good news.
[](https://beavercheck.com/results/d8d9fef8-97c6-4884-ac15-25f954c8c5eb)<a href="https://beavercheck.com/results/d8d9fef8-97c6-4884-ac15-25f954c8c5eb"><img src="https://beavercheck.com/badge?url=https%3A%2F%2Fhouse.gov" alt="BeaverCheck Score"></a>https://beavercheck.com/badge?url=https%3A%2F%2Fhouse.govThis badge auto-updates with your latest scan result.
Your site performs reasonably well, but a few targeted fixes could meaningfully improve results. Accessibility issues exclude users who rely on assistive technology — an estimated 15% of your potential audience. Addressing the critical issues below would have the most immediate impact on your audience reach.
11 barrier(s) likely increasing bounce by ~39%.
Page takes 8.2s to load
+12% bounceUsers abandon at ~3s — you're 5.7s over the 2.5s threshold
Fix: Optimize render-blocking resources, preload the hero image, and compress images
Page feels frozen for 1.8s
+5% bounceClicks on the primary CTA are ignored while JavaScript runs
Fix: Break up long tasks; defer non-critical JavaScript to post-hydration
Mixed content on HTTPS page
+8% bounceBrowsers block insecure subresources — broken images, missing scripts, warning badge
Fix: Change http:// URLs inside the page to https:// (or protocol-relative)
No HSTS header
+1% bounceReturning visitors are briefly exposed to downgrade attacks on first request
Fix: Set Strict-Transport-Security: max-age=31536000; includeSubDomains
No Content-Security-Policy header
+1% bounceHigher XSS blast radius — one compromised script can exfiltrate the checkout form
Fix: Ship a reporting-only CSP first, then enforce once violations are clean
Severe layout shift during page load
+6% bounceUsers mis-click when content jumps — converting intent into frustration
Fix: Reserve space for images, ads, and embeds with explicit width/height
4 form field(s) without a label
+6% bounceScreen readers skip unlabeled fields; autofill can't identify them; checkout abandonment spikes
Fix: Associate every input with a visible <label for="…">; add autocomplete attributes
No Open Graph tags
+2% bounceLinks shared on LinkedIn / Slack / Facebook show bare URLs — referral clicks drop
Fix: Add og:title, og:description, og:image, og:url to the page head
No structured data
+2% bounceNo rich-result eligibility in Google — lower SERP CTR vs competitors with stars and prices
Fix: Add JSON-LD for your page type (Product, Article, FAQPage, LocalBusiness, …)
Content is hard to read
+2% bounceGraduate-level reading difficulty — limits the addressable audience for product or blog pages
Fix: Shorten sentences; replace jargon with plain language; target Flesch ease ≥60
1 broken link(s) on the page
+2% bounceClicks land on 404s — trust drops and the session often ends
Fix: Fix or remove the broken destinations surfaced on the Content tab
Preliminary CRO audit — each barrier links to the tab with detailed analysis.
$450 investment → $4,949/month returns + USD 157,500 risk avoided
$450
4h · 5 findings
$4,949 /mo
~$59,382 / year
USD 157,500
if kept compliant
$150 — in quick wins — start here for the fastest payback
Figures combine localized regulatory fine ceilings, search/conversion value priced against local CPC, and bandwidth waste estimates. Results depend on implementation quality and audience composition. Not legal or financial advice.
4.5 developer hours at $100/hr
Based on United States rates ($100/hr)
Start here for the best return on investment
$13,125 / month at risk
~$157,504 / year if left unfixed
$157,500
+3 more
$0.30 /mo
3790.6 MB/mo × 0.080 USD/GB
Compliance figures represent the statutory maximum fine for the most severe triggered category, capped per regulation — not the sum of per-finding penalties. Based on published regulatory fine ranges. This is not legal advice.
Unique monthly visitors from your analytics
Purchases, signups, or key actions
Optional — for revenue estimation
more engaged visitors from reduced bounce
Fix 2 critical issues to capture this value
Based on Google/Deloitte research ("Milliseconds Make Millions") showing a ~7% bounce rate increase per additional second of LCP above the 2.5s "Good" threshold.
Your site's LCP: → estimated after fixes.
These are estimates based on industry research — actual results vary
Your data stays in your browser — nothing is sent to our servers
Thanks for your feedback!
We'll use a cached audit if available, or offer to scan.
Industry-standard audits powered by Google Lighthouse.
Key metrics that affect user experience.
First Contentful Paint First Contentful Paint — how long until the browser renders the first piece of content. Under 1.8s is good.
2.79 s
Largest Contentful Paint Largest Contentful Paint — how long until the largest visible element loads. Under 2.5s is good.
8.21 s
Total Blocking Time Total Blocking Time — total time the main thread was blocked, preventing user input. Under 200ms is good.
1.84 s
Cumulative Layout Shift Cumulative Layout Shift — measures visual stability. How much the page layout shifts during loading. Under 0.1 is good.
0.258
Speed Index Speed Index — how quickly content is visually displayed during load. Under 3.4s is good.
6.44 s
Time to Interactive Time to Interactive — how long until the page is fully interactive and responds to user input. Under 3.8s is good.
9.71 s
Audit breakdown by category with detailed findings.
Remove large, duplicate JavaScript modules from bundles to reduce unnecessary bytes consumed by network activity.
Performance issues directly impact user engagement and conversion rates.
Polyfills and transforms enable older browsers to use new JavaScript features. However, many aren't necessary for modern browsers. Consider modifying your JavaScript build process to not transpile Baseline features, unless you know you must support older browsers. Learn why most sites can deploy ES6+ code without transpiling
Shipping ES5 transpiled code to modern browsers wastes bytes — every user with an evergreen browser pays for compatibility you don't need.
Most users today run browsers that natively support ES6+, async/await, optional chaining, and the rest of modern JavaScript. Transpiling to ES5 'just in case' adds 20-40% to your bundle for no benefit. Configure your build to target a modern browserslist, or ship a differential bundle pair (modern + legacy) with the module/nomodule pattern.
Source: Google web.dev / Lighthouse
3rd party code can significantly impact load performance. Reduce and defer loading of 3rd party code to prioritize your page's content.
Performance issues directly impact user engagement and conversion rates.
A long cache lifetime can speed up repeat visits to your page. Learn more about caching.
Performance issues directly impact user engagement and conversion rates.
| Request | Cache TTL | Transfer Size |
|---|---|---|
| /sites/default/files/styles/large/public/2023-10/Capitol ... | 56881.0 s | 404.2 KiB |
| /sites/default/files/styles/large/public/2023-01/Floor Pr... | 38427.0 s | 44.6 KiB |
| /sites/default/files/styles/large/public/2024-10/constitu... | 43684.0 s | 32.4 KiB |
| www.house.gov/core/assets/vendor/jquery/jquery.min.js?v=4.0.0 | 36765.0 s | 27.6 KiB |
| /sites/default/files/styles/large/public/uploads/images-s... | 71673.0 s | 16.5 KiB |
| /sites/default/files/css/css_vKwGOib_wDyOY1O6NucuWZVuQj0p... | 17725.0 s | 4.0 KiB |
| www.house.gov/sites/default/themes/housegov/logo.svg | 71673.0 s | 1.6 KiB |
Layout shifts occur when elements move absent any user interaction. Investigate the causes of layout shifts, such as elements being added, removed, or their fonts changing as the page loads.
Performance issues directly impact user engagement and conversion rates.
Your first network request is the most important. Reduce its latency by avoiding redirects, ensuring a fast server response, and enabling text compression.
Performance issues directly impact user engagement and conversion rates.
A forced reflow occurs when JavaScript queries geometric properties (such as offsetWidth) after styles have been invalidated by a change to the DOM state. This can result in poor performance. Learn more about forced reflows and possible mitigations.
Performance issues directly impact user engagement and conversion rates.
Reducing the download time of images can improve the perceived load time of the page and LCP. Learn more about optimizing image size
Performance issues directly impact user engagement and conversion rates.
| URL | Resource Size | Est Savings | |
|---|---|---|---|
Interior of the U.S. Capitol dome. div.owl-stage > div.owl-item > div.carousel-item > img | /sites/default/files/styles/large/public/2023-10/Capitol ... | 403.7 KiB | 375.6 KiB |
Home div.row > div.col-xs-16 > div.region > a.logo | www.house.gov/sites/default/themes/housegov/images/houseLogoScreenIn.png | 28.8 KiB | 19.5 KiB |
section#committee-schedules > div.carousel-controls > a.right > span.icon-next section#committee-schedules > div.carousel-controls > a.right > span.icon-next | www.house.gov/sites/default/themes/housegov/images/arrows-sprite.png | 16.9 KiB | 16.2 KiB |
House Floor Proceedings div.owl-stage > div.owl-item > div.carousel-item > img | /sites/default/files/styles/large/public/2023-01/Floor Pr... | 44.1 KiB | 15.9 KiB |
Watch Most Recent House Floor Activity div#carousel-events > div.view-header > div#homepage-committee-schedules-houselive > a.ext | www.house.gov/sites/default/themes/housegov/images/bgSprite.png | 14.8 KiB | 7.4 KiB |
Optimize LCP by making the LCP image discoverable from the HTML immediately, and avoiding lazy-loading
Performance issues directly impact user engagement and conversion rates.
HTTP/2 and HTTP/3 offer many benefits over HTTP/1.1, such as multiplexing. Learn more about using modern HTTP.
Performance issues directly impact user engagement and conversion rates.
Avoid chaining critical requests by reducing the length of chains, reducing the download size of resources, or deferring the download of unnecessary resources to improve page load.
Performance issues directly impact user engagement and conversion rates.
Requests are blocking the page's initial render, which may delay LCP. Deferring or inlining can move these network requests out of the critical path.
Performance issues directly impact user engagement and conversion rates.
| URL | Transfer Size | Duration |
|---|---|---|
| www.house.gov/ruxitagentjs_ICA7NQVfqrux_10331260218130851.js | 106.8 KiB | 1.3 s |
| /sites/default/files/css/css_z0wHwbPsLix_f19iiTkAgbSGcT7P... | 27.9 KiB | 843 ms |
| /sites/default/files/css/css_vKwGOib_wDyOY1O6NucuWZVuQj0p... | 4.0 KiB | 393 ms |
These insights are also available in the Chrome DevTools Performance Panel - record a trace to view more detailed information.
Keep the server response time for the main document short because all other requests depend on it. Learn more about the Time to First Byte metric.
Performance issues directly impact user engagement and conversion rates.
| URL | Time Spent |
|---|---|
| www.house.gov/ | 1.4 s |
These are the largest layout shifts observed on the page. Each table item represents a single layout shift, and shows the element that shifted the most. Below each item are possible root causes that led to the layout shift. Some of these layout shifts may not be included in the CLS metric value due to windowing. Learn how to improve CLS
Performance issues directly impact user engagement and conversion rates.
| Element | Layout shift score |
|---|---|
Legislative Activity
Committee Schedules
Floor Proceedings
Recent Votes
Bills &… div.region > div.home-layout > div.home-layout__row > div.home-layout__top-right | 0.221 |
Visiting the House
Check out the info you need before coming to the People's H… div.dialog-off-canvas-main-canvas > div#main-content-section > div.row > section.col-xs-16 | 0.037 |
The maximum potential First Input Delay that your users could experience is the duration of the longest task. Learn more about the Maximum Potential First Input Delay metric.
Performance issues directly impact user engagement and conversion rates.
Time to Interactive is the amount of time it takes for the page to become fully interactive. Learn more about the Time to Interactive metric.
Performance issues directly impact user engagement and conversion rates.
Reduce unused JavaScript and defer loading scripts until they are required to decrease bytes consumed by network activity. Learn how to reduce unused JavaScript.
Multi-megabyte JavaScript bundles delay every interactive feature on the page.
This is the Lighthouse audit fired when too much JS is shipped relative to what executes. The fix isn't a config flag — it requires bundle analysis (webpack-bundle-analyzer, rollup-plugin-visualizer), splitting routes into chunks, lazy-loading off-screen components, and removing unused dependencies. Fundamentally different from minification: minifying reduces byte count, this reduces what's downloaded at all.
Source: Google web.dev / Lighthouse
| URL | Transfer Size | Est Savings |
|---|---|---|
| www.googletagmanager.com/gtm.js?id=GTM-TQX94K2 | 166.1 KiB | 72.8 KiB |
| www.googletagmanager.com/gtag/js?id=G-65K8PR1QER&cx=c>m=4e64k0h2 | 144.7 KiB | 63.8 KiB |
| /sites/default/files/js/js_yLfC_csMovnaXacCikH96zR8H2WU2T... | 84.5 KiB | 44.0 KiB |
| www.house.gov/ruxitagentjs_ICA7NQVfqrux_10331260218130851.js | 106.2 KiB | 36.3 KiB |
Consider reducing the time spent parsing, compiling, and executing JS. You may find delivering smaller JS payloads helps with this. Learn how to reduce Javascript execution time.
Performance issues directly impact user engagement and conversion rates.
| URL | Total CPU Time | Script Evaluation | Script Parse |
|---|---|---|---|
| www.house.gov/ruxitagentjs_ICA7NQVfqrux_10331260218130851.js | 2.5 s | 2.2 s | 41 ms |
| /sites/default/files/js/js_yLfC_csMovnaXacCikH96zR8H2WU2T... | 971 ms | 532 ms | 38 ms |
| www.house.gov/ | 797 ms | 24 ms | 4.4 ms |
| Unattributable | 376 ms | 34 ms | 0.0 ms |
| www.googletagmanager.com/gtm.js?id=GTM-TQX94K2 | 355 ms | 276 ms | 77 ms |
| www.googletagmanager.com/gtag/js?id=G-65K8PR1QER&cx=c>m=4e64k0h2 | 344 ms | 246 ms | 95 ms |
Consider reducing the time spent parsing, compiling and executing JS. You may find delivering smaller JS payloads helps with this. Learn how to minimize main-thread work
Performance issues directly impact user engagement and conversion rates.
| Category | Time Spent |
|---|---|
| Script Evaluation | 3.3 s |
| Other | 660 ms |
| Style & Layout | 580 ms |
| Script Parsing & Compilation | 266 ms |
| Parse HTML & CSS | 253 ms |
| Rendering | 137 ms |
| Garbage Collection | 95 ms |
Reduce unused rules from stylesheets and defer CSS not used for above-the-fold content to decrease bytes consumed by network activity. Learn how to reduce unused CSS.
Performance issues directly impact user engagement and conversion rates.
| URL | Transfer Size | Est Savings |
|---|---|---|
| /sites/default/files/css/css_z0wHwbPsLix_f19iiTkAgbSGcT7P... | 27.1 KiB | 22.9 KiB |
More information about the performance of your application. These numbers don't directly affect the Performance score.
These checks highlight opportunities to improve the accessibility of your web app. Automatic detection can only detect a subset of issues and does not guarantee the accessibility of your web app, so manual testing is also encouraged.
Touch targets with sufficient size and spacing help users who may have difficulty targeting small controls to activate the targets. Learn more about touch targets.
Performance issues directly impact user engagement and conversion rates.
| Failing Elements |
|---|
Accessibility section#block-footer-menu > ul.menu > li.expanded > a |
Contact Webmaster section#block-footer-menu > ul.menu > li.expanded > a |
Feature Stories section#block-footer-menu > ul.menu > li.expanded > a |
Privacy Policy section#block-footer-menu > ul.menu > li.expanded > a |
Site Map section#block-footer-menu > ul.menu > li.expanded > a |
Site Tools section#block-footer-menu > ul.menu > li.expanded > a |
Terms of Use section#block-footer-menu > ul.menu > li.expanded > a |
Watch live.house.gov section#block-footer-menu > ul.menu > li.expanded > a |
These items highlight common accessibility best practices.
Errors logged to the console indicate unresolved problems. They can come from network request failures and other browser concerns. Learn more about this errors in console diagnostic audit
Performance issues directly impact user engagement and conversion rates.
| Source | Description |
|---|---|
/sites/default/files/js/js_yLfC_csMovnaXacCikH96zR8H2WU2T... line 72, col 1406 | TypeError: $(...).accordion is not a function
at Object.attach (https://www.house.gov/sites/default/files/js/js_yLfC_csMovnaXacCikH96zR8H2WU2TocOq1F97fQZRE.js?scope=footer&delta=1&language=en&theme=housegov&include=eJxtjlESgzAIRC8k5kgORoyZJiED2NbbN-1o04_-LW93Ac9CznOuXKiYjhvvSoHvAB8FsYCSauQyND_aMQmtk-E8rSwZzUgces-ytEhnAz0txXJzi-wV03iOw7XezcymJlihdanzkHjGBGpHy4fON85UMRC00_qLz3c9ylumP9ZV7RY_0rfwAkQKZbc:73:1407)
at https://www.house.gov/sites/default/files/js/js_yLfC_csMovnaXacCikH96zR8H2WU2TocOq1F97fQZRE.js?scope=footer&delta=1&language=en&theme=housegov&include=eJxtjlESgzAIRC8k5kgORoyZJiED2NbbN-1o04_-LW93Ac9CznOuXKiYjhvvSoHvAB8FsYCSauQyND_aMQmtk-E8rSwZzUgces-ytEhnAz0txXJzi-wV03iOw7XezcymJlihdanzkHjGBGpHy4fON85UMRC00_qLz3c9ylumP9ZV7RY_0rfwAkQKZbc:15:427
at Array.forEach (<anonymous>)
at Drupal.attachBehaviors (https://www.house.gov/sites/default/files/js/js_yLfC_csMovnaXacCikH96zR8H2WU2TocOq1F97fQZRE.js?scope=footer&delta=1&language=en&theme=housegov&include=eJxtjlESgzAIRC8k5kgORoyZJiED2NbbN-1o04_-LW93Ac9CznOuXKiYjhvvSoHvAB8FsYCSauQyND_aMQmtk-E8rSwZzUgces-ytEhnAz0txXJzi-wV03iOw7XezcymJlihdanzkHjGBGpHy4fON85UMRC00_qLz3c9ylumP9ZV7RY_0rfwAkQKZbc:15:353)
at https://www.house.gov/sites/default/files/js/js_yLfC_csMovnaXacCikH96zR8H2WU2TocOq1F97fQZRE.js?scope=footer&delta=1&language=en&theme=housegov&include=eJxtjlESgzAIRC8k5kgORoyZJiED2NbbN-1o04_-LW93Ac9CznOuXKiYjhvvSoHvAB8FsYCSauQyND_aMQmtk-E8rSwZzUgces-ytEhnAz0txXJzi-wV03iOw7XezcymJlihdanzkHjGBGpHy4fON85UMRC00_qLz3c9ylumP9ZV7RY_0rfwAkQKZbc:16:373
at HTMLDocument.listener (https://www.house.gov/sites/default/files/js/js_yLfC_csMovnaXacCikH96zR8H2WU2TocOq1F97fQZRE.js?scope=footer&delta=1&language=en&theme=housegov&include=eJxtjlESgzAIRC8k5kgORoyZJiED2NbbN-1o04_-LW93Ac9CznOuXKiYjhvvSoHvAB8FsYCSauQyND_aMQmtk-E8rSwZzUgces-ytEhnAz0txXJzi-wV03iOw7XezcymJlihdanzkHjGBGpHy4fON85UMRC00_qLz3c9ylumP9ZV7RY_0rfwAkQKZbc:16:161) |
These checks ensure that your page is following basic search engine optimization advice. There are many additional factors Lighthouse does not score here that may affect your search ranking, including performance on Core Web Vitals. Learn more about Google Search Essentials.
Meta descriptions may be included in search results to concisely summarize page content. Learn more about the meta description.
Performance issues directly impact user engagement and conversion rates.
Format your HTML in a way that enables crawlers to better understand your app’s content.
Industry-standard audits powered by Google Lighthouse. — Desktop
Key metrics that affect user experience. — Desktop
First Contentful Paint First Contentful Paint — how long until the browser renders the first piece of content. Under 1.8s is good.
658 ms
Largest Contentful Paint Largest Contentful Paint — how long until the largest visible element loads. Under 2.5s is good.
1.30 s
Total Blocking Time Total Blocking Time — total time the main thread was blocked, preventing user input. Under 200ms is good.
72 ms
Cumulative Layout Shift Cumulative Layout Shift — measures visual stability. How much the page layout shifts during loading. Under 0.1 is good.
0.192
Speed Index Speed Index — how quickly content is visually displayed during load. Under 3.4s is good.
696 ms
Time to Interactive Time to Interactive — how long until the page is fully interactive and responds to user input. Under 3.8s is good.
1.90 s
Audit breakdown by category with detailed findings.
Remove large, duplicate JavaScript modules from bundles to reduce unnecessary bytes consumed by network activity.
Performance issues directly impact user engagement and conversion rates.
Polyfills and transforms enable older browsers to use new JavaScript features. However, many aren't necessary for modern browsers. Consider modifying your JavaScript build process to not transpile Baseline features, unless you know you must support older browsers. Learn why most sites can deploy ES6+ code without transpiling
Shipping ES5 transpiled code to modern browsers wastes bytes — every user with an evergreen browser pays for compatibility you don't need.
Most users today run browsers that natively support ES6+, async/await, optional chaining, and the rest of modern JavaScript. Transpiling to ES5 'just in case' adds 20-40% to your bundle for no benefit. Configure your build to target a modern browserslist, or ship a differential bundle pair (modern + legacy) with the module/nomodule pattern.
Source: Google web.dev / Lighthouse
3rd party code can significantly impact load performance. Reduce and defer loading of 3rd party code to prioritize your page's content.
Performance issues directly impact user engagement and conversion rates.
A long cache lifetime can speed up repeat visits to your page. Learn more about caching.
Performance issues directly impact user engagement and conversion rates.
Layout shifts occur when elements move absent any user interaction. Investigate the causes of layout shifts, such as elements being added, removed, or their fonts changing as the page loads.
Performance issues directly impact user engagement and conversion rates.
A forced reflow occurs when JavaScript queries geometric properties (such as offsetWidth) after styles have been invalidated by a change to the DOM state. This can result in poor performance. Learn more about forced reflows and possible mitigations.
Performance issues directly impact user engagement and conversion rates.
Reducing the download time of images can improve the perceived load time of the page and LCP. Learn more about optimizing image size
Performance issues directly impact user engagement and conversion rates.
| URL | Resource Size | Est Savings | |
|---|---|---|---|
Interior of the U.S. Capitol dome. div.owl-stage > div.owl-item > div.carousel-item > img | /sites/default/files/styles/large/public/2023-10/Capitol ... | 403.7 KiB | 375.6 KiB |
Image of House Chamber div.carousel-caption--owl > a > div.carousel-image > img | /sites/default/files/styles/homepage_carousel/public/uplo... | 28.2 KiB | 21.5 KiB |
A lighthouse by the ocean div.carousel-caption--owl > a > div.carousel-image > img | /sites/default/files/styles/homepage_carousel/public/uplo... | 27.6 KiB | 21.0 KiB |
Home div.row > div.col-xs-16 > div.region > a.logo | www.house.gov/sites/default/themes/housegov/images/houseLogoScreenIn.png | 28.8 KiB | 19.5 KiB |
Emancipation Hall in the Capitol Visitor Center div.carousel-caption--owl > a > div.carousel-image > img | /sites/default/files/styles/homepage_carousel/public/uplo... | 23.9 KiB | 17.8 KiB |
Orchid at the United States Botanic Garden div.carousel-caption--owl > a > div.carousel-image > img | /sites/default/files/styles/homepage_carousel/public/uplo... | 23.3 KiB | 17.3 KiB |
Logo of Kids in the House div.carousel-caption--owl > a > div.carousel-image > img | /sites/default/files/styles/homepage_carousel/public/uplo... | 23.0 KiB | 17.1 KiB |
Black and white image of a group of Hispanic American Congressmen div.carousel-caption--owl > a > div.carousel-image > img | /sites/default/files/styles/homepage_carousel/public/uplo... | 22.2 KiB | 16.5 KiB |
section#committee-schedules > div.carousel-controls > a.right > span.icon-next section#committee-schedules > div.carousel-controls > a.right > span.icon-next | www.house.gov/sites/default/themes/housegov/images/arrows-sprite.png | 16.9 KiB | 16.2 KiB |
House Floor Proceedings div.owl-stage > div.owl-item > div.carousel-item > img | /sites/default/files/styles/large/public/2023-01/Floor Pr... | 44.1 KiB | 15.9 KiB |
Black and white image of a Congresswoman standing in front of U.S. flag div.carousel-caption--owl > a > div.carousel-image > img | /sites/default/files/styles/homepage_carousel/public/uplo... | 20.1 KiB | 14.9 KiB |
Congressman Joseph Hayne Rainey div.carousel-caption--owl > a > div.carousel-image > img | /sites/default/files/styles/homepage_carousel/public/uplo... | 19.6 KiB | 14.6 KiB |
logo for Wounded Warrior Program div.carousel-caption--owl > a > div.carousel-image > img | /sites/default/files/styles/homepage_carousel/public/uplo... | 16.3 KiB | 12.1 KiB |
Congressional App Challenge div.carousel-caption--owl > a > div.carousel-image > img | /sites/default/files/styles/homepage_carousel/public/uplo... | 15.9 KiB | 11.8 KiB |
Artistic rendering of a former Congressman div.carousel-caption--owl > a > div.carousel-image > img | /sites/default/files/styles/homepage_carousel/public/uplo... | 10.7 KiB | 7.9 KiB |
Watch Most Recent House Floor Activity div#carousel-events > div.view-header > div#homepage-committee-schedules-houselive > a.ext | www.house.gov/sites/default/themes/housegov/images/bgSprite.png | 14.8 KiB | 7.4 KiB |
Optimize LCP by making the LCP image discoverable from the HTML immediately, and avoiding lazy-loading
Performance issues directly impact user engagement and conversion rates.
HTTP/2 and HTTP/3 offer many benefits over HTTP/1.1, such as multiplexing. Learn more about using modern HTTP.
Performance issues directly impact user engagement and conversion rates.
Avoid chaining critical requests by reducing the length of chains, reducing the download size of resources, or deferring the download of unnecessary resources to improve page load.
Performance issues directly impact user engagement and conversion rates.
Requests are blocking the page's initial render, which may delay LCP. Deferring or inlining can move these network requests out of the critical path.
Performance issues directly impact user engagement and conversion rates.
| URL | Transfer Size | Duration |
|---|---|---|
| www.house.gov/ruxitagentjs_ICA7NQVfqrux_10331260218130851.js | 106.8 KiB | 282 ms |
| /sites/default/files/css/css_z0wHwbPsLix_f19iiTkAgbSGcT7P... | 27.9 KiB | 202 ms |
| /sites/default/files/css/css_vKwGOib_wDyOY1O6NucuWZVuQj0p... | 4.0 KiB | 82 ms |
These insights are also available in the Chrome DevTools Performance Panel - record a trace to view more detailed information.
Reduce unused rules from stylesheets and defer CSS not used for above-the-fold content to decrease bytes consumed by network activity. Learn how to reduce unused CSS.
Performance issues directly impact user engagement and conversion rates.
| URL | Transfer Size | Est Savings |
|---|---|---|
| /sites/default/files/css/css_z0wHwbPsLix_f19iiTkAgbSGcT7P... | 27.1 KiB | 21.4 KiB |
Reduce unused JavaScript and defer loading scripts until they are required to decrease bytes consumed by network activity. Learn how to reduce unused JavaScript.
Multi-megabyte JavaScript bundles delay every interactive feature on the page.
This is the Lighthouse audit fired when too much JS is shipped relative to what executes. The fix isn't a config flag — it requires bundle analysis (webpack-bundle-analyzer, rollup-plugin-visualizer), splitting routes into chunks, lazy-loading off-screen components, and removing unused dependencies. Fundamentally different from minification: minifying reduces byte count, this reduces what's downloaded at all.
Source: Google web.dev / Lighthouse
| URL | Transfer Size | Est Savings |
|---|---|---|
| www.googletagmanager.com/gtm.js?id=GTM-TQX94K2 | 166.3 KiB | 72.7 KiB |
| www.googletagmanager.com/gtag/js?id=G-65K8PR1QER&cx=c>m=4e64h1 | 144.8 KiB | 63.1 KiB |
| www.house.gov/ruxitagentjs_ICA7NQVfqrux_10331260218130851.js | 106.2 KiB | 49.9 KiB |
| /sites/default/files/js/js_yLfC_csMovnaXacCikH96zR8H2WU2T... | 84.5 KiB | 40.9 KiB |
More information about the performance of your application. These numbers don't directly affect the Performance score.
These are the largest layout shifts observed on the page. Each table item represents a single layout shift, and shows the element that shifted the most. Below each item are possible root causes that led to the layout shift. Some of these layout shifts may not be included in the CLS metric value due to windowing. Learn how to improve CLS
Performance issues directly impact user engagement and conversion rates.
| Element | Layout shift score |
|---|---|
House Overview
Representatives
Leadership
Committees
Officers and Organizations… section.col-xs-16 > div.region > div.home-layout > div.row | 0.192 |
These checks highlight opportunities to improve the accessibility of your web app. Automatic detection can only detect a subset of issues and does not guarantee the accessibility of your web app, so manual testing is also encouraged.
Touch targets with sufficient size and spacing help users who may have difficulty targeting small controls to activate the targets. Learn more about touch targets.
Performance issues directly impact user engagement and conversion rates.
| Failing Elements |
|---|
Accessibility section#block-footer-menu > ul.menu > li.expanded > a |
Contact Webmaster section#block-footer-menu > ul.menu > li.expanded > a |
Feature Stories section#block-footer-menu > ul.menu > li.expanded > a |
Privacy Policy section#block-footer-menu > ul.menu > li.expanded > a |
Site Map section#block-footer-menu > ul.menu > li.expanded > a |
Site Tools section#block-footer-menu > ul.menu > li.expanded > a |
Terms of Use section#block-footer-menu > ul.menu > li.expanded > a |
Watch live.house.gov section#block-footer-menu > ul.menu > li.expanded > a |
These items highlight common accessibility best practices.
These checks ensure that your page is following basic search engine optimization advice. There are many additional factors Lighthouse does not score here that may affect your search ranking, including performance on Core Web Vitals. Learn more about Google Search Essentials.
Meta descriptions may be included in search results to concisely summarize page content. Learn more about the meta description.
Performance issues directly impact user engagement and conversion rates.
Format your HTML in a way that enables crawlers to better understand your app’s content.
Send Feedback