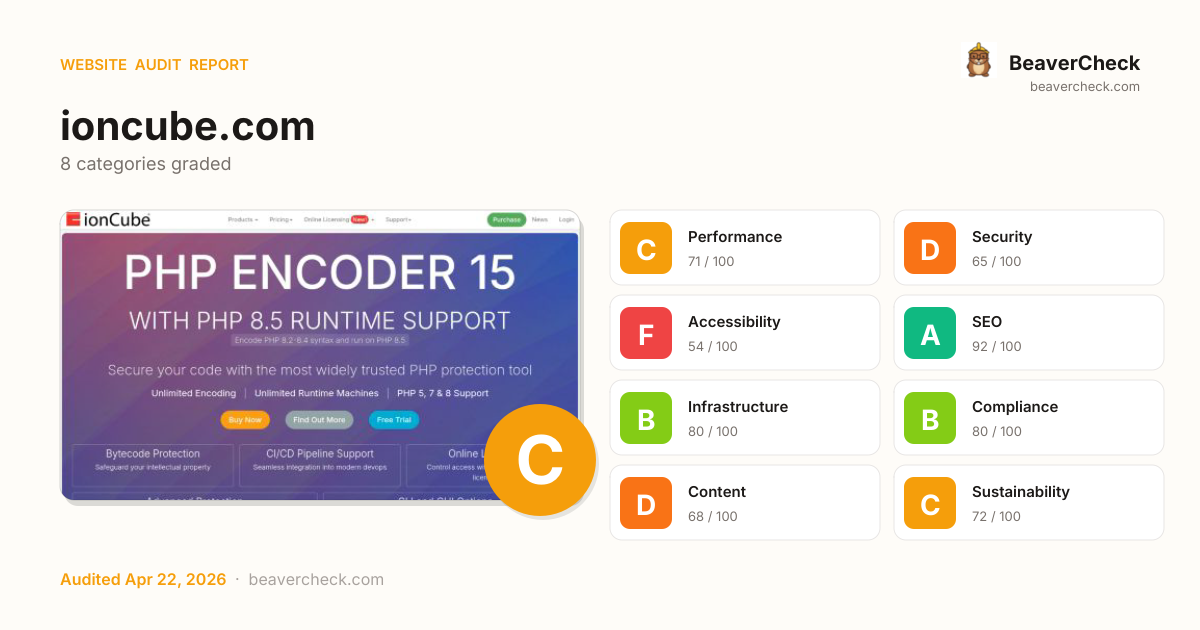
Mobile 375 × 812

Desktop 1440 × 900

Score: 71 / 100
Based on 8 categories, 0 sections
Decent speed, but optimizing further could improve engagement.
Several missing protections leave your users and data exposed.
Several issues make your site difficult for assistive technology users.
Well-optimized for search — your content is discoverable.
Good server performance with room for optimization.
Mostly compliant — a few items need attention.
Missing metadata means poor previews on social media and search.
Reasonable footprint with room for optimization.
The overall score is a weighted average of individual category scores. Categories with more impact on user experience and security carry more weight.
Weights reflect general web best practices. Individual needs may differ.
Content-Security-Policy header is missing
Security gaps expose your site and users to attacks, eroding trust.
HSTS header is missing
Security gaps expose your site and users to attacks, eroding trust.
No Content-Security-Policy header found
Security gaps expose your site and users to attacks, eroding trust.
2 image(s) missing alt attribute
Accessibility issues exclude users with disabilities — up to 15% of your potential audience.
3 button(s) with no accessible text
Accessibility issues exclude users with disabilities — up to 15% of your potential audience.
High impact, low effort — start here.
High impact, requires investment.
Small gains, minimal effort.
Nothing in this quadrant — good news.
Low impact, high effort — do last.
Nothing in this quadrant — good news.
[](https://beavercheck.com/results/e0001702-e43e-4edd-94ff-384cfe92818e)<a href="https://beavercheck.com/results/e0001702-e43e-4edd-94ff-384cfe92818e"><img src="https://beavercheck.com/badge?url=https%3A%2F%2Fioncube.com" alt="BeaverCheck Score"></a>https://beavercheck.com/badge?url=https%3A%2F%2Fioncube.comThis badge auto-updates with your latest scan result.
Your site performs reasonably well, but a few targeted fixes could meaningfully improve results. Accessibility issues exclude users who rely on assistive technology — an estimated 15% of your potential audience. Addressing the critical issues below would have the most immediate impact on your user trust.
7 barrier(s) likely increasing bounce by ~28%.
Page takes 13.7s to load
+12% bounceUsers abandon at ~3s — you're 11.2s over the 2.5s threshold
Fix: Optimize render-blocking resources, preload the hero image, and compress images
Page feels frozen for 778ms
+5% bounceClicks on the primary CTA are ignored while JavaScript runs
Fix: Break up long tasks; defer non-critical JavaScript to post-hydration
No HSTS header
+1% bounceReturning visitors are briefly exposed to downgrade attacks on first request
Fix: Set Strict-Transport-Security: max-age=31536000; includeSubDomains
No Content-Security-Policy header
+1% bounceHigher XSS blast radius — one compromised script can exfiltrate the checkout form
Fix: Ship a reporting-only CSP first, then enforce once violations are clean
No Open Graph tags
+2% bounceLinks shared on LinkedIn / Slack / Facebook show bare URLs — referral clicks drop
Fix: Add og:title, og:description, og:image, og:url to the page head
No structured data
+2% bounceNo rich-result eligibility in Google — lower SERP CTR vs competitors with stars and prices
Fix: Add JSON-LD for your page type (Product, Article, FAQPage, LocalBusiness, …)
No skip-to-content link
+1% bounceKeyboard and screen-reader users must tab through the entire header on every page
Fix: Add a visible-on-focus <a href="#main">Skip to content</a> as the first focusable element
Preliminary CRO audit — each barrier links to the tab with detailed analysis.
$450 investment → $1,281/month returns + USD 157,500 risk avoided
$450
4h · 5 findings
$1,281 /mo
~$15,368 / year
USD 157,500
if kept compliant
$150 — in quick wins — start here for the fastest payback
Figures combine localized regulatory fine ceilings, search/conversion value priced against local CPC, and bandwidth waste estimates. Results depend on implementation quality and audience composition. Not legal or financial advice.
4.5 developer hours at $100/hr
Based on United States rates ($100/hr)
Start here for the best return on investment
$13,126 / month at risk
~$157,507 / year if left unfixed
$157,500
+7 more
$0.56 /mo
6991.6 MB/mo × 0.080 USD/GB
Compliance figures represent the statutory maximum fine for the most severe triggered category, capped per regulation — not the sum of per-finding penalties. Based on published regulatory fine ranges. This is not legal advice.
Unique monthly visitors from your analytics
Purchases, signups, or key actions
Optional — for revenue estimation
more engaged visitors from reduced bounce
Fix 5 critical issues to capture this value
Based on Google/Deloitte research ("Milliseconds Make Millions") showing a ~7% bounce rate increase per additional second of LCP above the 2.5s "Good" threshold.
Your site's LCP: → estimated after fixes.
These are estimates based on industry research — actual results vary
Your data stays in your browser — nothing is sent to our servers
Thanks for your feedback!
We'll use a cached audit if available, or offer to scan.
Industry-standard audits powered by Google Lighthouse.
Key metrics that affect user experience.
First Contentful Paint First Contentful Paint — how long until the browser renders the first piece of content. Under 1.8s is good.
3.51 s
Largest Contentful Paint Largest Contentful Paint — how long until the largest visible element loads. Under 2.5s is good.
13.75 s
Total Blocking Time Total Blocking Time — total time the main thread was blocked, preventing user input. Under 200ms is good.
778 ms
Cumulative Layout Shift Cumulative Layout Shift — measures visual stability. How much the page layout shifts during loading. Under 0.1 is good.
0.000
Speed Index Speed Index — how quickly content is visually displayed during load. Under 3.4s is good.
7.71 s
Time to Interactive Time to Interactive — how long until the page is fully interactive and responds to user input. Under 3.8s is good.
18.50 s
Audit breakdown by category with detailed findings.
Remove large, duplicate JavaScript modules from bundles to reduce unnecessary bytes consumed by network activity.
Performance issues directly impact user engagement and conversion rates.
Polyfills and transforms enable older browsers to use new JavaScript features. However, many aren't necessary for modern browsers. Consider modifying your JavaScript build process to not transpile Baseline features, unless you know you must support older browsers. Learn why most sites can deploy ES6+ code without transpiling
Shipping ES5 transpiled code to modern browsers wastes bytes — every user with an evergreen browser pays for compatibility you don't need.
Most users today run browsers that natively support ES6+, async/await, optional chaining, and the rest of modern JavaScript. Transpiling to ES5 'just in case' adds 20-40% to your bundle for no benefit. Configure your build to target a modern browserslist, or ship a differential bundle pair (modern + legacy) with the module/nomodule pattern.
Source: Google web.dev / Lighthouse
3rd party code can significantly impact load performance. Reduce and defer loading of 3rd party code to prioritize your page's content.
Performance issues directly impact user engagement and conversion rates.
A long cache lifetime can speed up repeat visits to your page. Learn more about caching.
Performance issues directly impact user engagement and conversion rates.
Your first network request is the most important. Reduce its latency by avoiding redirects, ensuring a fast server response, and enabling text compression.
Performance issues directly impact user engagement and conversion rates.
Consider setting font-display to swap or optional to ensure text is consistently visible. swap can be further optimized to mitigate layout shifts with font metric overrides.
Performance issues directly impact user engagement and conversion rates.
| URL | Est Savings |
|---|---|
| www.ioncube.com/font-awesome/fonts/fontawesome-webfont.woff2?v=4.6.3 | 195 ms |
HTTP/2 and HTTP/3 offer many benefits over HTTP/1.1, such as multiplexing. Learn more about using modern HTTP.
Performance issues directly impact user engagement and conversion rates.
Avoid chaining critical requests by reducing the length of chains, reducing the download size of resources, or deferring the download of unnecessary resources to improve page load.
Performance issues directly impact user engagement and conversion rates.
Requests are blocking the page's initial render, which may delay LCP. Deferring or inlining can move these network requests out of the critical path.
Performance issues directly impact user engagement and conversion rates.
| URL | Transfer Size | Duration |
|---|---|---|
| www.ioncube.com/assets/css/vendor.min.css?1704812232 | 40.1 KiB | 1.2 s |
| www.ioncube.com/assets/css/styles.min.css?1771587005 | 18.6 KiB | 972 ms |
| www.ioncube.com/css/font.css?1771587005 | 627 B | 730 ms |
| www.ioncube.com/css/fonts/inter/inter.css?1771587005 | 1.6 KiB | 245 ms |
Reducing the download time of images can improve the perceived load time of the page and LCP. Learn more about optimizing image size
Performance issues directly impact user engagement and conversion rates.
| URL | Resource Size | Est Savings | |
|---|---|---|---|
ionCube24 logo div#ic24 > div.content > a#ic24logo > img.img-responsive | www.ioncube.com/images/ioncube24/text_logo_vert.png | 73.9 KiB | 73.3 KiB |
Distribute & Manage div.flow_wrapper > div.step_card > div.step_icon > img | www.ioncube.com/images/icons/cloud_download.png | 9.1 KiB | 7.5 KiB |
Domain icon div.license_files_wrapper > div.license_card_group > div.license_card > img.license_icon | www.ioncube.com/images/icons/domain_icon.png | 6.5 KiB | 6.1 KiB |
Create License File div.flow_wrapper > div.step_card > div.step_icon > img | www.ioncube.com/images/icons/secure_file.png | 6.8 KiB | 5.7 KiB |
IP icon div.license_files_wrapper > div.license_card_group > div.license_card > img.license_icon | www.ioncube.com/images/icons/ip_icon.png | 5.5 KiB | 5.1 KiB |
Setup Project div.flow_wrapper > div.step_card > div.step_icon > img | www.ioncube.com/images/icons/computer_setup.png | 5.7 KiB | 4.8 KiB |
These insights are also available in the Chrome DevTools Performance Panel - record a trace to view more detailed information.
Redirects introduce additional delays before the page can be loaded. Learn how to avoid page redirects.
Performance issues directly impact user engagement and conversion rates.
| URL | Time Spent |
|---|---|
| ioncube.com/ | 1.0 s |
| www.ioncube.com/ | 0.0 ms |
Time to Interactive is the amount of time it takes for the page to become fully interactive. Learn more about the Time to Interactive metric.
Performance issues directly impact user engagement and conversion rates.
The maximum potential First Input Delay that your users could experience is the duration of the longest task. Learn more about the Maximum Potential First Input Delay metric.
Performance issues directly impact user engagement and conversion rates.
Reduce unused rules from stylesheets and defer CSS not used for above-the-fold content to decrease bytes consumed by network activity. Learn how to reduce unused CSS.
Performance issues directly impact user engagement and conversion rates.
| URL | Transfer Size | Est Savings |
|---|---|---|
| www.ioncube.com/assets/css/vendor.min.css?1704812232 | 39.6 KiB | 37.8 KiB |
| embed.tawk.to/_s/v4/app/69e6f4c07ce/css/max-widget.css | 21.6 KiB | 21.6 KiB |
| www.ioncube.com/assets/css/styles.min.css?1771587005 | 18.1 KiB | 15.0 KiB |
Reduce unused JavaScript and defer loading scripts until they are required to decrease bytes consumed by network activity. Learn how to reduce unused JavaScript.
Multi-megabyte JavaScript bundles delay every interactive feature on the page.
This is the Lighthouse audit fired when too much JS is shipped relative to what executes. The fix isn't a config flag — it requires bundle analysis (webpack-bundle-analyzer, rollup-plugin-visualizer), splitting routes into chunks, lazy-loading off-screen components, and removing unused dependencies. Fundamentally different from minification: minifying reduces byte count, this reduces what's downloaded at all.
Source: Google web.dev / Lighthouse
| URL | Transfer Size | Est Savings |
|---|---|---|
| s3.eu-west-1.amazonaws.com/static.ioncube.com/images/vendor.min.js?1704815250 | 563.8 KiB | 347.2 KiB |
| embed.tawk.to/_s/v4/app/69e6f4c07ce/js/twk-chunk-vendors.js | 113.8 KiB | 75.2 KiB |
| www.googletagmanager.com/gtag/js?id=G-F1KFLPF6WF | 164.2 KiB | 64.9 KiB |
| embed.tawk.to/_s/v4/app/69e6f4c07ce/js/twk-chunk-common.js | 66.7 KiB | 34.2 KiB |
Consider reducing the time spent parsing, compiling, and executing JS. You may find delivering smaller JS payloads helps with this. Learn how to reduce Javascript execution time.
Performance issues directly impact user engagement and conversion rates.
| URL | Total CPU Time | Script Evaluation | Script Parse |
|---|---|---|---|
| s3.eu-west-1.amazonaws.com/static.ioncube.com/images/vendor.min.js?1704815250 | 1.2 s | 672 ms | 66 ms |
| www.ioncube.com/ | 958 ms | 127 ms | 6.5 ms |
| www.ioncube.com/assets/js/public.live.vue.js?1774443823 | 633 ms | 506 ms | 3.2 ms |
| Unattributable | 463 ms | 23 ms | 0.0 ms |
| scripts.clarity.ms/0.8.59/clarity.js | 388 ms | 333 ms | 12 ms |
| www.googletagmanager.com/gtag/js?id=G-F1KFLPF6WF | 330 ms | 277 ms | 48 ms |
| embed.tawk.to/_s/v4/app/69e6f4c07ce/js/twk-chunk-vendors.js | 189 ms | 155 ms | 32 ms |
| embed.tawk.to/_s/v4/app/69e6f4c07ce/js/twk-chunk-common.js | 112 ms | 82 ms | 25 ms |
| embed.tawk.to/_s/v4/app/69e6f4c07ce/js/twk-chunk-6289ff8e.js | 94 ms | 82 ms | 10 ms |
| embed.tawk.to/_s/v4/app/69e6f4c07ce/js/twk-chunk-2d224aff.js | 71 ms | 68 ms | 2.1 ms |
Consider reducing the time spent parsing, compiling and executing JS. You may find delivering smaller JS payloads helps with this. Learn how to minimize main-thread work
Performance issues directly impact user engagement and conversion rates.
| Category | Time Spent |
|---|---|
| Script Evaluation | 2.4 s |
| Other | 876 ms |
| Style & Layout | 663 ms |
| Rendering | 306 ms |
| Script Parsing & Compilation | 243 ms |
| Parse HTML & CSS | 108 ms |
| Garbage Collection | 52 ms |
Many navigations are performed by going back to a previous page, or forwards again. The back/forward cache (bfcache) can speed up these return navigations. Learn more about the bfcache
Performance issues directly impact user engagement and conversion rates.
| Failure reason | Failure type |
|---|---|
| Pages with cache-control:no-store header cannot enter back/forward cache. | Actionable |
| Pages whose main resource has cache-control:no-store cannot enter back/forward cache. | Not actionable |
| Back/forward cache is disabled because some JavaScript network request received resource with Cache-Control: no-store header. | Not actionable |
Minifying JavaScript files can reduce payload sizes and script parse time. Learn how to minify JavaScript.
Performance issues directly impact user engagement and conversion rates.
| URL | Transfer Size | Est Savings |
|---|---|---|
| www.ioncube.com/assets/js/public.live.vue.js?1774443823 | 9.8 KiB | 2.8 KiB |
Set an explicit width and height on image elements to reduce layout shifts and improve CLS. Learn how to set image dimensions
Performance issues directly impact user engagement and conversion rates.
| URL | |
|---|---|
ionCube24 logo div#ic24 > div.content > a#ic24logo > img.img-responsive | www.ioncube.com/images/ioncube24/text_logo_vert.png |
Create License File div.flow_wrapper > div.step_card > div.step_icon > img | www.ioncube.com/images/icons/secure_file.png |
Distribute & Manage div.flow_wrapper > div.step_card > div.step_icon > img | www.ioncube.com/images/icons/cloud_download.png |
Setup Project div.flow_wrapper > div.step_card > div.step_icon > img | www.ioncube.com/images/icons/computer_setup.png |
Upload file div.content > div#online_enc_strip > div.action > img | www.ioncube.com/images/icons/file_upload.png |
Complete div.content > div#online_enc_strip > div.action > img | www.ioncube.com/images/icons/checkmark_circle.png |
More information about the performance of your application. These numbers don't directly affect the Performance score.
These checks highlight opportunities to improve the accessibility of your web app. Automatic detection can only detect a subset of issues and does not guarantee the accessibility of your web app, so manual testing is also encouraged.
Low-contrast text is difficult or impossible for many users to read. Learn how to provide sufficient color contrast.
Performance issues directly impact user engagement and conversion rates.
| Failing Elements |
|---|
Purchase div.navbar-header > div.navbar-button > a.btn > span |
Buy Now div.home_page > div#marquee > div.button_group > a.btn |
Find Out More div.home_page > div#marquee > div.button_group > a.btn |
Free Trial div.home_page > div#marquee > div.button_group > a.btn |
1. Setup Project div.flow_wrapper > div.step_card > div.step_content > div.step_title |
Define product, versions & variants (trial/paid) div.flow_wrapper > div.step_card > div.step_content > div.step_text |
2. Create License File div.flow_wrapper > div.step_card > div.step_content > div.step_title |
Specify user details, features & expiry. div.flow_wrapper > div.step_card > div.step_content > div.step_text |
3. Distribute div.flow_wrapper > div.step_card > div.step_content > div.step_title |
Download file and distribute. div.flow_wrapper > div.step_card > div.step_content > div.step_text |
Offer: 2 months free included with new Pro/Cerberus purchases div.body_main > div.home_page > div#olic > div.alert |
Offer: div.home_page > div#olic > div.alert > b |
Learn More div.home_page > div#olic > div.button_group > a.btn |
Get Free Trial div.home_page > div#olic > div.button_group > a.btn |
Go to Online Encoder div.home_page > div#olenc > div.content > a.btn |
Need to run a plugin or app? div.home_page > div#loader > div.content > div.standard_subtitle |
ionCube Loader is required to run encoded PHP files and is available on many po… div.home_page > div#loader > div.content > div |
•Upload the Loader Wizard script for assisted installation
•Run it in your brow… div.home_page > div#loader > div.content > div.feature_list |
Get the Loader div.home_page > div#loader > div.content > a.btn |
Find Out More div.home_page > div#ic24 > div.content > a#ic24FOM |
These are opportunities to improve the legibility of your content.
Screen reader users rely on frame titles to describe the contents of frames. Learn more about frame titles.
Performance issues directly impact user engagement and conversion rates.
| Failing Elements |
|---|
body > div#ks4n75vfa3lc1776893915546 > iframe#ybrfv49o99ss1776893915602 body > div#ks4n75vfa3lc1776893915546 > iframe#ybrfv49o99ss1776893915602 |
These are opportunities to improve the semantics of the controls in your application. This may enhance the experience for users of assistive technology, like a screen reader.
One main landmark helps screen reader users navigate a web page. Learn more about landmarks.
Performance issues directly impact user engagement and conversion rates.
| Failing Elements |
|---|
html html |
These items highlight common accessibility best practices.
These checks ensure that your page is following basic search engine optimization advice. There are many additional factors Lighthouse does not score here that may affect your search ranking, including performance on Core Web Vitals. Learn more about Google Search Essentials.
Descriptive link text helps search engines understand your content. Learn how to make links more accessible.
Performance issues directly impact user engagement and conversion rates.
| Link destination | Link Text |
|---|---|
| www.ioncube.com/online_licensing.php | Learn More |
Format your HTML in a way that enables crawlers to better understand your app’s content.
Search engines may use `href` attributes on links to crawl websites. Ensure that the `href` attribute of anchor elements links to an appropriate destination, so more pages of the site can be discovered. Learn how to make links crawlable
Performance issues directly impact user engagement and conversion rates.
| Uncrawlable Link |
|---|
Watch Video div.home_page > div#olic > div.button_group > a.btn |
To appear in search results, crawlers need access to your app.
Industry-standard audits powered by Google Lighthouse. — Desktop
Key metrics that affect user experience. — Desktop
First Contentful Paint First Contentful Paint — how long until the browser renders the first piece of content. Under 1.8s is good.
1.61 s
Largest Contentful Paint Largest Contentful Paint — how long until the largest visible element loads. Under 2.5s is good.
3.48 s
Total Blocking Time Total Blocking Time — total time the main thread was blocked, preventing user input. Under 200ms is good.
5 ms
Cumulative Layout Shift Cumulative Layout Shift — measures visual stability. How much the page layout shifts during loading. Under 0.1 is good.
0.010
Speed Index Speed Index — how quickly content is visually displayed during load. Under 3.4s is good.
3.88 s
Time to Interactive Time to Interactive — how long until the page is fully interactive and responds to user input. Under 3.8s is good.
3.67 s
Audit breakdown by category with detailed findings.
Remove large, duplicate JavaScript modules from bundles to reduce unnecessary bytes consumed by network activity.
Performance issues directly impact user engagement and conversion rates.
Polyfills and transforms enable older browsers to use new JavaScript features. However, many aren't necessary for modern browsers. Consider modifying your JavaScript build process to not transpile Baseline features, unless you know you must support older browsers. Learn why most sites can deploy ES6+ code without transpiling
Shipping ES5 transpiled code to modern browsers wastes bytes — every user with an evergreen browser pays for compatibility you don't need.
Most users today run browsers that natively support ES6+, async/await, optional chaining, and the rest of modern JavaScript. Transpiling to ES5 'just in case' adds 20-40% to your bundle for no benefit. Configure your build to target a modern browserslist, or ship a differential bundle pair (modern + legacy) with the module/nomodule pattern.
Source: Google web.dev / Lighthouse
3rd party code can significantly impact load performance. Reduce and defer loading of 3rd party code to prioritize your page's content.
Performance issues directly impact user engagement and conversion rates.
A long cache lifetime can speed up repeat visits to your page. Learn more about caching.
Performance issues directly impact user engagement and conversion rates.
Your first network request is the most important. Reduce its latency by avoiding redirects, ensuring a fast server response, and enabling text compression.
Performance issues directly impact user engagement and conversion rates.
Consider setting font-display to swap or optional to ensure text is consistently visible. swap can be further optimized to mitigate layout shifts with font metric overrides.
Performance issues directly impact user engagement and conversion rates.
| URL | Est Savings |
|---|---|
| www.ioncube.com/font-awesome/fonts/fontawesome-webfont.woff2?v=4.6.3 | 185 ms |
HTTP/2 and HTTP/3 offer many benefits over HTTP/1.1, such as multiplexing. Learn more about using modern HTTP.
Performance issues directly impact user engagement and conversion rates.
Avoid chaining critical requests by reducing the length of chains, reducing the download size of resources, or deferring the download of unnecessary resources to improve page load.
Performance issues directly impact user engagement and conversion rates.
Requests are blocking the page's initial render, which may delay LCP. Deferring or inlining can move these network requests out of the critical path.
Performance issues directly impact user engagement and conversion rates.
| URL | Transfer Size | Duration |
|---|---|---|
| www.ioncube.com/assets/css/vendor.min.css?1704812232 | 40.1 KiB | 527 ms |
| www.ioncube.com/assets/css/styles.min.css?1771587005 | 18.6 KiB | 527 ms |
| www.ioncube.com/css/font.css?1771587005 | 628 B | 396 ms |
| www.ioncube.com/css/fonts/inter/inter.css?1771587005 | 1.6 KiB | 135 ms |
Reducing the download time of images can improve the perceived load time of the page and LCP. Learn more about optimizing image size
Performance issues directly impact user engagement and conversion rates.
| URL | Resource Size | Est Savings | |
|---|---|---|---|
ionCube24 logo div.home_page > div#ic24 > a#ic24logo > img.img-responsive | www.ioncube.com/images/ioncube24/text_logo_vert.png | 73.9 KiB | 73.5 KiB |
Distribute & Manage div.flow_wrapper > div.step_card > div.step_icon > img | www.ioncube.com/images/icons/cloud_download.png | 9.1 KiB | 7.6 KiB |
Domain icon div.license_files_wrapper > div.license_card_group > div.license_card > img.license_icon | www.ioncube.com/images/icons/domain_icon.png | 6.5 KiB | 6.2 KiB |
Create License File div.flow_wrapper > div.step_card > div.step_icon > img | www.ioncube.com/images/icons/secure_file.png | 6.8 KiB | 5.8 KiB |
IP icon div.license_files_wrapper > div.license_card_group > div.license_card > img.license_icon | www.ioncube.com/images/icons/ip_icon.png | 5.5 KiB | 5.2 KiB |
Setup Project div.flow_wrapper > div.step_card > div.step_icon > img | www.ioncube.com/images/icons/computer_setup.png | 5.7 KiB | 4.8 KiB |
These insights are also available in the Chrome DevTools Performance Panel - record a trace to view more detailed information.
Redirects introduce additional delays before the page can be loaded. Learn how to avoid page redirects.
Performance issues directly impact user engagement and conversion rates.
| URL | Time Spent |
|---|---|
| ioncube.com/ | 479 ms |
| www.ioncube.com/ | 0.0 ms |
Time to Interactive is the amount of time it takes for the page to become fully interactive. Learn more about the Time to Interactive metric.
Performance issues directly impact user engagement and conversion rates.
Reduce unused rules from stylesheets and defer CSS not used for above-the-fold content to decrease bytes consumed by network activity. Learn how to reduce unused CSS.
Performance issues directly impact user engagement and conversion rates.
| URL | Transfer Size | Est Savings |
|---|---|---|
| www.ioncube.com/assets/css/vendor.min.css?1704812232 | 39.6 KiB | 37.5 KiB |
| embed.tawk.to/_s/v4/app/69e6f4c07ce/css/max-widget.css | 21.6 KiB | 21.6 KiB |
| www.ioncube.com/assets/css/styles.min.css?1771587005 | 18.1 KiB | 15.4 KiB |
| embed.tawk.to/_s/v4/app/69e6f4c07ce/css/message-preview.css | 12.0 KiB | 12.0 KiB |
Reduce unused JavaScript and defer loading scripts until they are required to decrease bytes consumed by network activity. Learn how to reduce unused JavaScript.
Multi-megabyte JavaScript bundles delay every interactive feature on the page.
This is the Lighthouse audit fired when too much JS is shipped relative to what executes. The fix isn't a config flag — it requires bundle analysis (webpack-bundle-analyzer, rollup-plugin-visualizer), splitting routes into chunks, lazy-loading off-screen components, and removing unused dependencies. Fundamentally different from minification: minifying reduces byte count, this reduces what's downloaded at all.
Source: Google web.dev / Lighthouse
| URL | Transfer Size | Est Savings |
|---|---|---|
| s3.eu-west-1.amazonaws.com/static.ioncube.com/images/vendor.min.js?1704815250 | 563.8 KiB | 347.2 KiB |
| embed.tawk.to/_s/v4/app/69e6f4c07ce/js/twk-chunk-vendors.js | 113.8 KiB | 75.2 KiB |
| www.googletagmanager.com/gtag/js?id=G-F1KFLPF6WF | 164.2 KiB | 66.2 KiB |
| embed.tawk.to/_s/v4/app/69e6f4c07ce/js/twk-chunk-common.js | 66.7 KiB | 33.6 KiB |
Many navigations are performed by going back to a previous page, or forwards again. The back/forward cache (bfcache) can speed up these return navigations. Learn more about the bfcache
Performance issues directly impact user engagement and conversion rates.
| Failure reason | Failure type |
|---|---|
| Pages with cache-control:no-store header cannot enter back/forward cache. | Actionable |
| Pages whose main resource has cache-control:no-store cannot enter back/forward cache. | Not actionable |
| Back/forward cache is disabled because some JavaScript network request received resource with Cache-Control: no-store header. | Not actionable |
Minifying JavaScript files can reduce payload sizes and script parse time. Learn how to minify JavaScript.
Performance issues directly impact user engagement and conversion rates.
| URL | Transfer Size | Est Savings |
|---|---|---|
| www.ioncube.com/assets/js/public.live.vue.js?1774443823 | 9.8 KiB | 2.8 KiB |
Consider reducing the time spent parsing, compiling and executing JS. You may find delivering smaller JS payloads helps with this. Learn how to minimize main-thread work
Performance issues directly impact user engagement and conversion rates.
| Category | Time Spent |
|---|---|
| Other | 5.2 s |
| Script Evaluation | 1.2 s |
| Style & Layout | 322 ms |
| Rendering | 206 ms |
| Script Parsing & Compilation | 54 ms |
| Parse HTML & CSS | 32 ms |
| Garbage Collection | 26 ms |
Set an explicit width and height on image elements to reduce layout shifts and improve CLS. Learn how to set image dimensions
Performance issues directly impact user engagement and conversion rates.
| URL | |
|---|---|
ionCube24 logo div.home_page > div#ic24 > a#ic24logo > img.img-responsive | www.ioncube.com/images/ioncube24/text_logo_vert.png |
Create License File div.flow_wrapper > div.step_card > div.step_icon > img | www.ioncube.com/images/icons/secure_file.png |
Distribute & Manage div.flow_wrapper > div.step_card > div.step_icon > img | www.ioncube.com/images/icons/cloud_download.png |
Setup Project div.flow_wrapper > div.step_card > div.step_icon > img | www.ioncube.com/images/icons/computer_setup.png |
Upload file div.content > div#online_enc_strip > div.action > img | www.ioncube.com/images/icons/file_upload.png |
Complete div.content > div#online_enc_strip > div.action > img | www.ioncube.com/images/icons/checkmark_circle.png |
More information about the performance of your application. These numbers don't directly affect the Performance score.
These checks highlight opportunities to improve the accessibility of your web app. Automatic detection can only detect a subset of issues and does not guarantee the accessibility of your web app, so manual testing is also encouraged.
Low-contrast text is difficult or impossible for many users to read. Learn how to provide sufficient color contrast.
Performance issues directly impact user engagement and conversion rates.
| Failing Elements |
|---|
Products div#navbar > ul.nav > li.dropdown > a.dropdown-toggle |
Pricing div#navbar > ul.nav > li.dropdown > a.dropdown-toggle |
Online Licensing New! div#navbar > ul.nav > li.dropdown > a.dropdown-toggle |
Support div#navbar > ul.nav > li.dropdown > a.dropdown-toggle |
Purchase div.navbar-button > li > a.btn > span |
News div#navbar > ul.nav > li > a |
Login div#navbar > ul.nav > li > a.top-level |
Buy Now div.home_page > div#marquee > div.button_group > a.btn |
Find Out More div.home_page > div#marquee > div.button_group > a.btn |
Free Trial div.home_page > div#marquee > div.button_group > a.btn |
1. Setup Project div.flow_wrapper > div.step_card > div.step_content > div.step_title |
Define product,
versions & variants
(trial/paid) div.flow_wrapper > div.step_card > div.step_content > div.step_text |
2. Create License File div.flow_wrapper > div.step_card > div.step_content > div.step_title |
Specify user details,
features & expiry.
div.flow_wrapper > div.step_card > div.step_content > div.step_text |
3. Distribute div.flow_wrapper > div.step_card > div.step_content > div.step_title |
Download file and distribute. div.flow_wrapper > div.step_card > div.step_content > div.step_text |
Plan: 50 users, 3 variants div.license_files_wrapper > div.license_card_group > div.license_card > div.license_meta |
Offer: 2 months free included with new Pro/Cerberus purchases div.body_main > div.home_page > div#olic > div.alert |
Offer: div.home_page > div#olic > div.alert > b |
Learn More div.home_page > div#olic > div.button_group > a.btn |
Get Free Trial div.home_page > div#olic > div.button_group > a.btn |
Go to Online Encoder div.home_page > div#olenc > div.content > a.btn |
ionCube Loader is required to run encoded PHP files and is available on many po… div.home_page > div#loader > div.content > div |
•Upload the Loader Wizard script for assisted installation
•Run it in your brow… div.home_page > div#loader > div.content > div.feature_list |
Get the Loader div.home_page > div#loader > div.content > a.btn |
Find Out More div.home_page > div#ic24 > div.content > a#ic24FOM |
These are opportunities to improve the legibility of your content.
Screen reader users rely on frame titles to describe the contents of frames. Learn more about frame titles.
Performance issues directly impact user engagement and conversion rates.
| Failing Elements |
|---|
body > div#oddilim0eol1776893933024 > iframe#ndb5cr9umt841776893933096 body > div#oddilim0eol1776893933024 > iframe#ndb5cr9umt841776893933096 |
These are opportunities to improve the semantics of the controls in your application. This may enhance the experience for users of assistive technology, like a screen reader.
Screen readers have a specific way of announcing lists. Ensuring proper list structure aids screen reader output. Learn more about proper list structure.
Performance issues directly impact user engagement and conversion rates.
| Failing Elements |
|---|
Purchase
News
Login nav.navbar > div.container-fluid > div#navbar > ul.nav |
Screen readers require list items (`<li>`) to be contained within a parent `<ul>`, `<ol>` or `<menu>` to be announced properly. Learn more about proper list structure.
Performance issues directly impact user engagement and conversion rates.
| Failing Elements |
|---|
Purchase div#navbar > ul.nav > div.navbar-button > li |
These are opportunities to improve the experience of reading tabular or list data using assistive technology, like a screen reader.
One main landmark helps screen reader users navigate a web page. Learn more about landmarks.
Performance issues directly impact user engagement and conversion rates.
| Failing Elements |
|---|
html html |
These items highlight common accessibility best practices.
These checks ensure that your page is following basic search engine optimization advice. There are many additional factors Lighthouse does not score here that may affect your search ranking, including performance on Core Web Vitals. Learn more about Google Search Essentials.
Descriptive link text helps search engines understand your content. Learn how to make links more accessible.
Performance issues directly impact user engagement and conversion rates.
| Link destination | Link Text |
|---|---|
| www.ioncube.com/online_licensing.php | Learn More |
Format your HTML in a way that enables crawlers to better understand your app’s content.
Search engines may use `href` attributes on links to crawl websites. Ensure that the `href` attribute of anchor elements links to an appropriate destination, so more pages of the site can be discovered. Learn how to make links crawlable
Performance issues directly impact user engagement and conversion rates.
| Uncrawlable Link |
|---|
Watch Video div.home_page > div#olic > div.button_group > a.btn |
To appear in search results, crawlers need access to your app.
Send Feedback