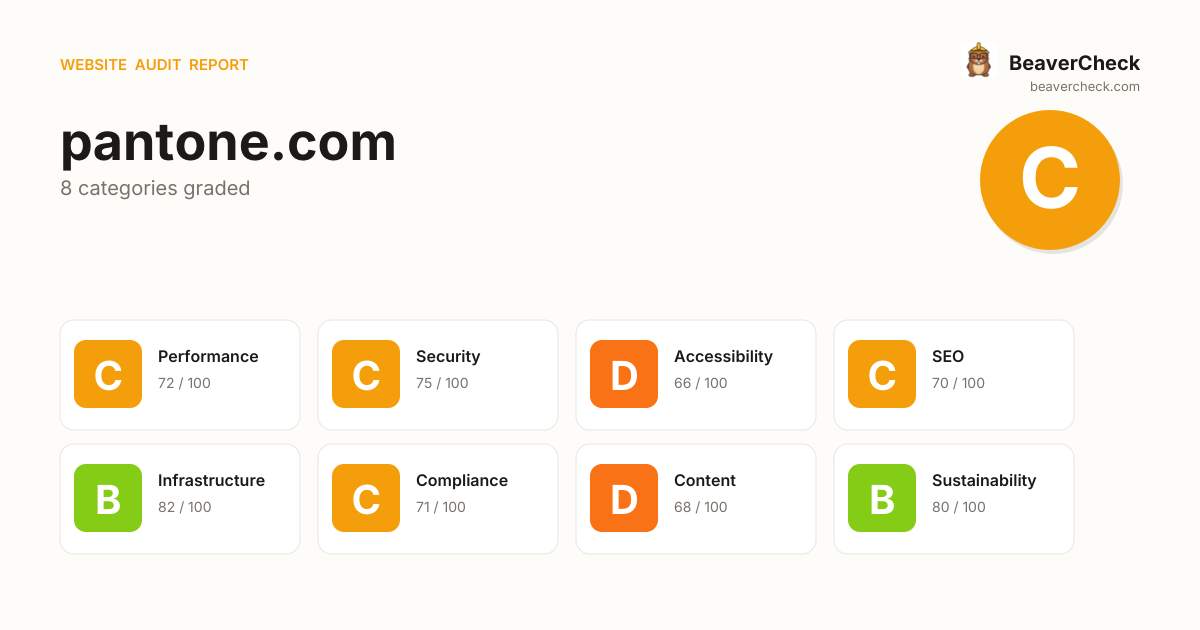
Mobile 375 × 812

Score: 73 / 100
Based on 8 categories, 0 sections
Decent speed, but optimizing further could improve engagement.
Good foundation, but a few gaps could be exploited.
Several issues make your site difficult for assistive technology users.
Solid SEO basics — a few optimizations could boost rankings.
Good server performance with room for optimization.
Mostly compliant — a few items need attention.
Missing metadata means poor previews on social media and search.
Reasonable footprint with room for optimization.
The overall score is a weighted average of individual category scores. Categories with more impact on user experience and security carry more weight.
Weights reflect general web best practices. Individual needs may differ.
Content-Security-Policy header is missing
Security gaps expose your site and users to attacks, eroding trust.
No Content-Security-Policy header found
Security gaps expose your site and users to attacks, eroding trust.
No <main> landmark found
Accessibility issues exclude users with disabilities — up to 15% of your potential audience.
167 third-party resources (100% of weight)
Performance issues directly impact user engagement and conversion rates.
168 HTTP requests — consider bundling or reducing
Performance issues directly impact user engagement and conversion rates.
High impact, low effort — start here.
High impact, requires investment.
Small gains, minimal effort.
Nothing in this quadrant — good news.
Low impact, high effort — do last.
Nothing in this quadrant — good news.
[](https://beavercheck.com/results/e16dd55e-d79a-4f2b-9729-d5c192fdb52c)<a href="https://beavercheck.com/results/e16dd55e-d79a-4f2b-9729-d5c192fdb52c"><img src="https://beavercheck.com/badge?url=https%3A%2F%2Fpantone.com" alt="BeaverCheck Score"></a>https://beavercheck.com/badge?url=https%3A%2F%2Fpantone.comThis badge auto-updates with your latest scan result.
Your site performs reasonably well, but a few targeted fixes could meaningfully improve results. Your LCP of 18.6s exceeds Google's 2.5s 'Good' threshold and the 2 performance issues below directly contribute to it. Addressing the critical issues below would have the most immediate impact on your user trust.
9 barrier(s) likely increasing bounce by ~33%.
Page takes 18.6s to load
+12% bounceUsers abandon at ~3s — you're 16.1s over the 2.5s threshold
Fix: Optimize render-blocking resources, preload the hero image, and compress images
Page feels frozen for 1.8s
+5% bounceClicks on the primary CTA are ignored while JavaScript runs
Fix: Break up long tasks; defer non-critical JavaScript to post-hydration
No HSTS header
+1% bounceReturning visitors are briefly exposed to downgrade attacks on first request
Fix: Set Strict-Transport-Security: max-age=31536000; includeSubDomains
No Content-Security-Policy header
+1% bounceHigher XSS blast radius — one compromised script can exfiltrate the checkout form
Fix: Ship a reporting-only CSP first, then enforce once violations are clean
Severe layout shift during page load
+6% bounceUsers mis-click when content jumps — converting intent into frustration
Fix: Reserve space for images, ads, and embeds with explicit width/height
No Open Graph tags
+2% bounceLinks shared on LinkedIn / Slack / Facebook show bare URLs — referral clicks drop
Fix: Add og:title, og:description, og:image, og:url to the page head
No structured data
+2% bounceNo rich-result eligibility in Google — lower SERP CTR vs competitors with stars and prices
Fix: Add JSON-LD for your page type (Product, Article, FAQPage, LocalBusiness, …)
Thin content
+3% bounceUnder 300 words — visitors bounce looking for substance, search engines rank competitors first
Fix: Add a substantive FAQ, product detail, or case-study section
No skip-to-content link
+1% bounceKeyboard and screen-reader users must tab through the entire header on every page
Fix: Add a visible-on-focus <a href="#main">Skip to content</a> as the first focusable element
Preliminary CRO audit — each barrier links to the tab with detailed analysis.
$650 investment → $0.51/month returns + USD 157,500 risk avoided
$650
6h · 5 findings
$0.51 /mo
~$6.15 / year
USD 157,500
if kept compliant
$100 — in quick wins — start here for the fastest payback
Figures combine localized regulatory fine ceilings, search/conversion value priced against local CPC, and bandwidth waste estimates. Results depend on implementation quality and audience composition. Not legal or financial advice.
6.5 developer hours at $100/hr
Based on United States rates ($100/hr)
Start here for the best return on investment
$13,126 / month at risk
~$157,506 / year if left unfixed
$157,500
+5 more
$0.51 /mo
6409.3 MB/mo × 0.080 USD/GB
Compliance figures represent the statutory maximum fine for the most severe triggered category, capped per regulation — not the sum of per-finding penalties. Based on published regulatory fine ranges. This is not legal advice.
Unique monthly visitors from your analytics
Purchases, signups, or key actions
Optional — for revenue estimation
more engaged visitors from reduced bounce
Fix 3 critical issues to capture this value
Based on Google/Deloitte research ("Milliseconds Make Millions") showing a ~7% bounce rate increase per additional second of LCP above the 2.5s "Good" threshold.
Your site's LCP: → estimated after fixes.
These are estimates based on industry research — actual results vary
Your data stays in your browser — nothing is sent to our servers
Thanks for your feedback!
We'll use a cached audit if available, or offer to scan.
Industry-standard audits powered by Google Lighthouse.
Key metrics that affect user experience.
First Contentful Paint First Contentful Paint — how long until the browser renders the first piece of content. Under 1.8s is good.
8.79 s
Largest Contentful Paint Largest Contentful Paint — how long until the largest visible element loads. Under 2.5s is good.
18.58 s
Total Blocking Time Total Blocking Time — total time the main thread was blocked, preventing user input. Under 200ms is good.
1.83 s
Cumulative Layout Shift Cumulative Layout Shift — measures visual stability. How much the page layout shifts during loading. Under 0.1 is good.
0.456
Speed Index Speed Index — how quickly content is visually displayed during load. Under 3.4s is good.
16.05 s
Time to Interactive Time to Interactive — how long until the page is fully interactive and responds to user input. Under 3.8s is good.
19.55 s
Audit breakdown by category with detailed findings.
Remove large, duplicate JavaScript modules from bundles to reduce unnecessary bytes consumed by network activity.
Performance issues directly impact user engagement and conversion rates.
Polyfills and transforms enable older browsers to use new JavaScript features. However, many aren't necessary for modern browsers. Consider modifying your JavaScript build process to not transpile Baseline features, unless you know you must support older browsers. Learn why most sites can deploy ES6+ code without transpiling
Shipping ES5 transpiled code to modern browsers wastes bytes — every user with an evergreen browser pays for compatibility you don't need.
Most users today run browsers that natively support ES6+, async/await, optional chaining, and the rest of modern JavaScript. Transpiling to ES5 'just in case' adds 20-40% to your bundle for no benefit. Configure your build to target a modern browserslist, or ship a differential bundle pair (modern + legacy) with the module/nomodule pattern.
Source: Google web.dev / Lighthouse
3rd party code can significantly impact load performance. Reduce and defer loading of 3rd party code to prioritize your page's content.
Performance issues directly impact user engagement and conversion rates.
A long cache lifetime can speed up repeat visits to your page. Learn more about caching.
Performance issues directly impact user engagement and conversion rates.
| Request | Cache TTL | Transfer Size |
|---|---|---|
| cdn.cookielaw.org/scripttemplates/202603.1.0/otBannerSdk.js | 86400.0 s | 129.9 KiB |
| static.hotjar.com/c/hotjar-797391.js?sv=7 | 60.0 s | 8.1 KiB |
| snap.licdn.com/li.lms-analytics/insight.min.js | 86400.0 s | 18.7 KiB |
| cdn.cookielaw.org/scripttemplates/otSDKStub.js | 86400.0 s | 9.1 KiB |
| /logos/c579c0d0-360f-49c0-bccc-f7b7cded31cd/baa864cc-43c3... | 86400.0 s | 3.2 KiB |
| cdn.cookielaw.org/logos/static/powered_by_logo.svg | 86400.0 s | 2.5 KiB |
| /collect?v=2&fmt=js&pid=552508&time=1776813311577&li_adsI... | 0.0 ms | 452 B |
Layout shifts occur when elements move absent any user interaction. Investigate the causes of layout shifts, such as elements being added, removed, or their fonts changing as the page loads.
Performance issues directly impact user engagement and conversion rates.
A forced reflow occurs when JavaScript queries geometric properties (such as offsetWidth) after styles have been invalidated by a change to the DOM state. This can result in poor performance. Learn more about forced reflows and possible mitigations.
Performance issues directly impact user engagement and conversion rates.
Reducing the download time of images can improve the perceived load time of the page and LCP. Learn more about optimizing image size
Performance issues directly impact user engagement and conversion rates.
| URL | Resource Size | Est Savings | |
|---|---|---|---|
FHI Color Guide, Limited Edition Color of the Year 2026 a.thumbnail > div.sc-iBYQkv > div.lazyload-wrapper > img.sc-ftTHYK | /media/catalog/product/c/o/coy-2026-fhi-guide-fhip110coy2... | 61.4 KiB | 46.1 KiB |
Formula Guide, Limited Edition Pantone Color of the Year 2026 a.thumbnail > div.sc-iBYQkv > div.lazyload-wrapper > img.sc-ftTHYK | /media/catalog/product/c/o/coy-2026-formula-guide-gp1601b... | 20.2 KiB | 4.9 KiB |
Each subpart has specific improvement strategies. Ideally, most of the LCP time should be spent on loading the resources, not within delays.
Performance issues directly impact user engagement and conversion rates.
Optimize LCP by making the LCP image discoverable from the HTML immediately, and avoiding lazy-loading
Performance issues directly impact user engagement and conversion rates.
Requests are blocking the page's initial render, which may delay LCP. Deferring or inlining can move these network requests out of the critical path.
Performance issues directly impact user engagement and conversion rates.
These insights are also available in the Chrome DevTools Performance Panel - record a trace to view more detailed information.
Redirects introduce additional delays before the page can be loaded. Learn how to avoid page redirects.
Performance issues directly impact user engagement and conversion rates.
| URL | Time Spent |
|---|---|
| pantone.com/ | 980 ms |
| www.pantone.com/ | 7.2 s |
| www.pantone.com/hk/en/ | 0.0 ms |
| www.pantone.com/hk/en/ | 0.0 ms |
These are the largest layout shifts observed on the page. Each table item represents a single layout shift, and shows the element that shifted the most. Below each item are possible root causes that led to the layout shift. Some of these layout shifts may not be included in the CLS metric value due to windowing. Learn how to improve CLS
Performance issues directly impact user engagement and conversion rates.
| Element | Layout shift score |
|---|---|
Fashion, Home + Interiors
Graphics + Digital Design
Munsell
Plastics
Recognize… body > div#root > main.pantone__sc-dfv9p6-0 > div.pantone__sc-x5v8fh-0 | 0.268 |
Fashion, Home + Interiors
Graphics + Digital Design
Munsell
Plastics
Recognize… body > div#root > main.pantone__sc-dfv9p6-0 > div.pantone__sc-x5v8fh-0 | 0.090 |
BASED ON YOUR LOCATION WE HAVE DIRECTED YOU TO THE PANTONE HONG KONG WEBSITE - … body > div#root > main.pantone__sc-dfv9p6-0 | 0.073 |
Fashion, Home + Interiors
Graphics + Digital Design
Munsell
Plastics
Recognize… body > div#root > main.pantone__sc-dfv9p6-0 > div.pantone__sc-x5v8fh-0 | 0.064 |
BASED ON YOUR LOCATION WE HAVE DIRECTED YOU TO THE PANTONE HONG KONG WEBSITE - … body > div#root > main.pantone__sc-dfv9p6-0 | 0.024 |
| 0.002 | |
Browse 15,000+ colors to find the perfect hue every time.
GO TO COLOR FINDER div.banner__item > div.overlay > div > div.row | 0.001 |
Time to Interactive is the amount of time it takes for the page to become fully interactive. Learn more about the Time to Interactive metric.
Performance issues directly impact user engagement and conversion rates.
The maximum potential First Input Delay that your users could experience is the duration of the longest task. Learn more about the Maximum Potential First Input Delay metric.
Performance issues directly impact user engagement and conversion rates.
Reduce unused rules from stylesheets and defer CSS not used for above-the-fold content to decrease bytes consumed by network activity. Learn how to reduce unused CSS.
Performance issues directly impact user engagement and conversion rates.
| URL | Transfer Size | Est Savings |
|---|---|---|
| www.pantone.com/css/form.bundle.css | 55.0 KiB | 55.0 KiB |
| www.pantone.com/dist/css/main.0b685b74.css | 25.5 KiB | 25.0 KiB |
| 21.9 KiB | 19.1 KiB | |
| www.pantone.com/css/headless.bundle.css | 15.4 KiB | 15.1 KiB |
Reduce unused JavaScript and defer loading scripts until they are required to decrease bytes consumed by network activity. Learn how to reduce unused JavaScript.
Multi-megabyte JavaScript bundles delay every interactive feature on the page.
This is the Lighthouse audit fired when too much JS is shipped relative to what executes. The fix isn't a config flag — it requires bundle analysis (webpack-bundle-analyzer, rollup-plugin-visualizer), splitting routes into chunks, lazy-loading off-screen components, and removing unused dependencies. Fundamentally different from minification: minifying reduces byte count, this reduces what's downloaded at all.
Source: Google web.dev / Lighthouse
| URL | Transfer Size | Est Savings |
|---|---|---|
| www.pantone.com/dist/js/main.06385d3c.chunk.js | 207.7 KiB | 93.8 KiB |
| cdn.cookielaw.org/scripttemplates/202603.1.0/otBannerSdk.js | 129.7 KiB | 69.1 KiB |
| www.googletagmanager.com/gtm.js?id=GTM-57ZPTXG | 124.5 KiB | 66.8 KiB |
| www.pantone.com/dist/js/client.2a086c25.chunk.js | 149.0 KiB | 62.0 KiB |
| script.hotjar.com/modules.6a0f3932cb1341a35c18.js | 56.1 KiB | 37.0 KiB |
| www.pantone.com/dist/js/runtime.a7dfb88a.chunk.js | 84.0 KiB | 24.3 KiB |
Consider reducing the time spent parsing, compiling, and executing JS. You may find delivering smaller JS payloads helps with this. Learn how to reduce Javascript execution time.
Performance issues directly impact user engagement and conversion rates.
Consider reducing the time spent parsing, compiling and executing JS. You may find delivering smaller JS payloads helps with this. Learn how to minimize main-thread work
Performance issues directly impact user engagement and conversion rates.
| Category | Time Spent |
|---|---|
| Script Evaluation | 9.5 s |
| Other | 4.8 s |
| Rendering | 1.2 s |
| Script Parsing & Compilation | 1.1 s |
| Style & Layout | 1.0 s |
| Parse HTML & CSS | 294 ms |
| Garbage Collection | 280 ms |
Set an explicit width and height on image elements to reduce layout shifts and improve CLS. Learn how to set image dimensions
Performance issues directly impact user engagement and conversion rates.
| URL | |
|---|---|
PANTONE 11-4201 Cloud Dancer: The Colour Palettes div.post-description > div.post-ftimg-hld > a > img | www.pantone.com/media/magefan_blog/coythumb_2.jpg |
Design With Pantone Color of the Year 2026 div.post-description > div.post-ftimg-hld > a > img | www.pantone.com/media/magefan_blog/thumbbb_1.jpg |
Pantone Introduces the Pantone Color of the Year 2026: PANTONE 11-4201 Cloud Da… div.post-description > div.post-ftimg-hld > a > img | www.pantone.com/media/magefan_blog/cd_thumb_1.jpg |
Bon Iver x Pantone: The Story of a Musical Makeover Told in Color div.post-description > div.post-ftimg-hld > a > img | www.pantone.com/media/magefan_blog/bi_thumb_1.jpg |
Pantone Connect div.meet__connect > div.meet__img > div > img.d-block | www.pantone.com/media/wysiwyg/pages/connect/widget2-features-pick-mobile.webp |
Large Paper Swatches (TPG Sheets), Pantone Color of the Year 2025 17-1230TPG a.thumbnail > div.sc-iBYQkv > div.lazyload-wrapper > img.sc-ftTHYK | /media/catalog/product/l/a/large-paper-swatch-17-1230-tpg... |
Formula Guide, Limited Edition Pantone Color of the Year 2026 a.thumbnail > div.sc-iBYQkv > div.lazyload-wrapper > img.sc-ftTHYK | /media/catalog/product/c/o/coy-2026-formula-guide-gp1601b... |
FHI Color Guide, Limited Edition Color of the Year 2026 a.thumbnail > div.sc-iBYQkv > div.lazyload-wrapper > img.sc-ftTHYK | /media/catalog/product/c/o/coy-2026-fhi-guide-fhip110coy2... |
FHI Color Guide, Limited Edition Color of the Year 2025 a.thumbnail > div.sc-iBYQkv > div.lazyload-wrapper > img.sc-ftTHYK | /media/catalog/product/f/h/fhip110coy25-color-of-the-year... |
Cotton Swatch Cards, Pantone Color of the Year 2025 a.thumbnail > div.sc-iBYQkv > div.lazyload-wrapper > img.sc-ftTHYK | /media/catalog/product/s/w/swcd-tcx-color-of-the-year-202... |
Pantone Color Institute - Behind the Scenes figure.image_root__49gEI > a > picture > img.image_img__3FyIe | /media/wysiwyg/pci/pantone-behind-the-scenes.webp?auto=we... |
X-Rite Logo div.column_root__1lYXu > div.html_root__2M-Wn > div#footerLogos > img | www.pantone.com/media/wysiwyg/logos/xrite.png |
Pantone Color Institute Logo div.column_root__1lYXu > figure.image_root__49gEI > picture > img.image_img__3FyIe | /media/wysiwyg/pci/pantone-color-institute-pci-logo.webp?... |
Pantone Color Institute X Cadillac div.column_root__1lYXu > figure.image_root__49gEI > picture > img.image_img__3FyIe | /media/wysiwyg/pci/pantone-color-institute-cadillac-logo.... |
Pantone Color Institute X Lacoste div.column_root__1lYXu > figure.image_root__49gEI > picture > img.image_img__3FyIe | /media/wysiwyg/pci/pantone-color-institute-lacoste-logo.w... |
Pantone Color Institute X Nickelodeon div.column_root__1lYXu > figure.image_root__49gEI > picture > img.image_img__3FyIe | /media/wysiwyg/pci/pantone-color-institute-nickelodeon-lo... |
Pantone Color Institute X Afterpay div.column_root__1lYXu > figure.image_root__49gEI > picture > img.image_img__3FyIe | /media/wysiwyg/pci/pantone-color-institute-afterpay-logo.... |
Pantone Logo div.html_root__2M-Wn > div#footerLogos > a > img | www.pantone.com/media/wysiwyg/logos/logo.png |
More information about the performance of your application. These numbers don't directly affect the Performance score.
These checks highlight opportunities to improve the accessibility of your web app. Automatic detection can only detect a subset of issues and does not guarantee the accessibility of your web app, so manual testing is also encouraged.
Low-contrast text is difficult or impossible for many users to read. Learn how to provide sufficient color contrast.
Performance issues directly impact user engagement and conversion rates.
| Failing Elements |
|---|
Extract div.meet__nav > ul > li.meet__svg > span |
Convert div.meet__nav > ul > li.meet__svg > span |
Measure div.meet__nav > ul > li.meet__svg > span |
Color Story div.meet__nav > ul > li.meet__svg > span |
Color Insider div.meet__nav > ul > li.meet__svg > span |
PANTONE 11-4201 Cloud Dancer: The Colour Palettes div.post-text-hld > div > div > h4 |
Design With Pantone Color of the Year 2026 div.post-text-hld > div > div > h4 |
Pantone Introduces the Pantone Color of the Year 2026: PANTONE 11-4201 Cloud Da… div.post-text-hld > div > div > h4 |
Bon Iver x Pantone: The Story of a Musical Makeover Told in Color div.post-text-hld > div > div > h4 |
These are opportunities to improve the legibility of your content.
Specifying a valid BCP 47 language helps screen readers announce text properly. Learn how to use the `lang` attribute.
Performance issues directly impact user engagement and conversion rates.
| Failing Elements |
|---|
html html |
These are opportunities to improve the interpretation of your content by users in different locales.
Link text (and alternate text for images, when used as links) that is discernible, unique, and focusable improves the navigation experience for screen reader users. Learn how to make links accessible.
Performance issues directly impact user engagement and conversion rates.
| Failing Elements |
|---|
div.pantone__sc-1esd4hb-0 > div.in-notice > div.container > a.close div.pantone__sc-1esd4hb-0 > div.in-notice > div.container > a.close |
These are opportunities to improve the semantics of the controls in your application. This may enhance the experience for users of assistive technology, like a screen reader.
Touch targets with sufficient size and spacing help users who may have difficulty targeting small controls to activate the targets. Learn more about touch targets.
Performance issues directly impact user engagement and conversion rates.
| Failing Elements |
|---|
GO TO COLOR FINDER div.col-12 > div.slider-cta > button > a.button-anchor |
LEARN MORE div.columnGroup_root__2mS-J > div.column_root__1lYXu > div.html_root__2M-Wn > button.pantone-btn |
LEARN MORE div.column_root__1lYXu > div.html_root__2M-Wn > button.pantone-btn > a |
GET PANTONE CONNECT NOW div.meet__connect > div.meet__nav > button.pantone-btn > a |
These items highlight common accessibility best practices.
Visible text labels that do not match the accessible name can result in a confusing experience for screen reader users. Learn more about accessible names.
Performance issues directly impact user engagement and conversion rates.
| Failing Elements |
|---|
GO TO COLOR FINDER div.col-12 > div.slider-cta > button > a.button-anchor |
Join today div.column_root__1lYXu > div.html_root__2M-Wn > p > a |
CAREERS div > ul > li > a |
PRODUCT REGISTRATION div > ul > li > a |
FOLLOW US div.html_root__2M-Wn > div#footerSocial > p > a.noClick |
California Consumer Privacy Act div.html_root__2M-Wn > div#footerCopyright > p > a |
Cookie 政策 div#onetrust-group-container > div#onetrust-policy > div#onetrust-policy-text > a.ot-cookie-policy-link |
Image natural dimensions should be proportional to the display size and the pixel ratio to maximize image clarity. Learn how to provide responsive images.
Performance issues directly impact user engagement and conversion rates.
| URL | Displayed size | Actual size | Expected size | |
|---|---|---|---|---|
Formula Guide, Limited Edition Pantone Color of the Year 2026 a.thumbnail > div.sc-iBYQkv > div.lazyload-wrapper > img.sc-ftTHYK | /media/catalog/product/c/o/coy-2026-formula-guide-gp1601b... | 307 x 307 | 307 x 307 | 461 x 461 |
Large Paper Swatches (TPG Sheets), Pantone Color of the Year 2025 17-1230TPG a.thumbnail > div.sc-iBYQkv > div.lazyload-wrapper > img.sc-ftTHYK | /media/catalog/product/l/a/large-paper-swatch-17-1230-tpg... | 307 x 307 | 307 x 307 | 461 x 461 |
Deprecated APIs will eventually be removed from the browser. Learn more about deprecated APIs.
Performance issues directly impact user engagement and conversion rates.
| Deprecation / Warning | Source |
|---|---|
| AttributionReporting |
Source maps translate minified code to the original source code. This helps developers debug in production. In addition, Lighthouse is able to provide further insights. Consider deploying source maps to take advantage of these benefits. Learn more about source maps.
Performance issues directly impact user engagement and conversion rates.
These checks ensure that your page is following basic search engine optimization advice. There are many additional factors Lighthouse does not score here that may affect your search ranking, including performance on Core Web Vitals. Learn more about Google Search Essentials.
Meta descriptions may be included in search results to concisely summarize page content. Learn more about the meta description.
Performance issues directly impact user engagement and conversion rates.
Format your HTML in a way that enables crawlers to better understand your app’s content.
Search engines may use `href` attributes on links to crawl websites. Ensure that the `href` attribute of anchor elements links to an appropriate destination, so more pages of the site can be discovered. Learn how to make links crawlable
Performance issues directly impact user engagement and conversion rates.
| Uncrawlable Link |
|---|
Click to Learn about PantoneLIVE div.nav__box > div.nav__link > div.nav__column > a |
To appear in search results, crawlers need access to your app.
Desktop audit not available for this result.
Send Feedback