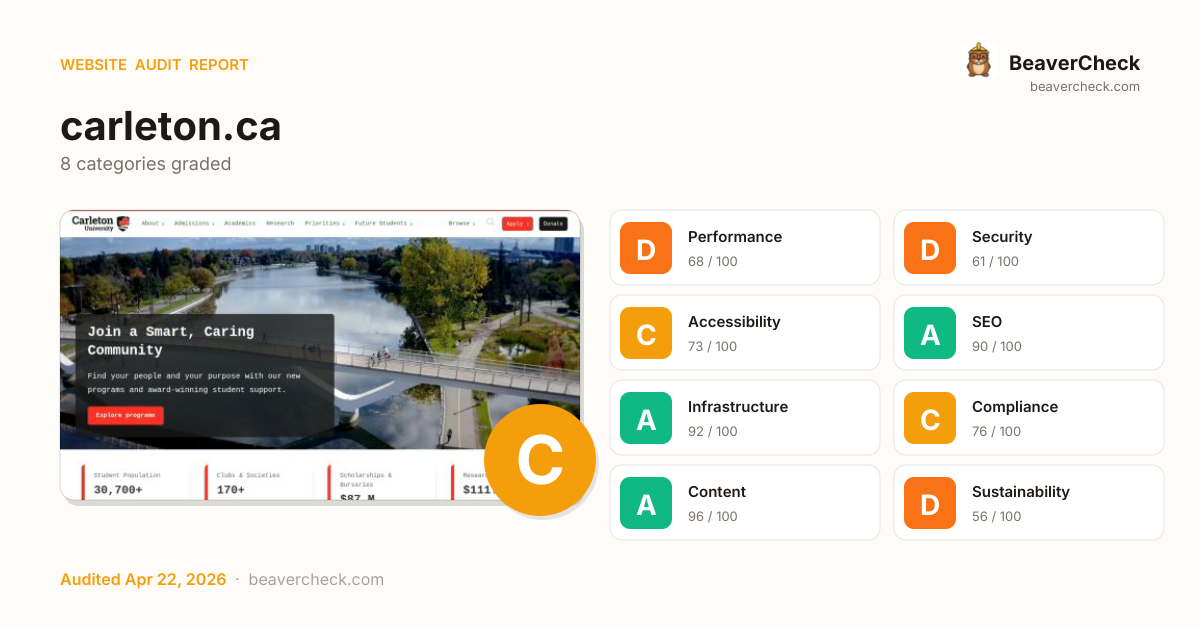
Mobile 375 × 812

Desktop 1440 × 900

Score: 73 / 100
Based on 8 categories, 0 sections
Room to improve — your 2.9s load time is above Google's 2.5s 'Good' threshold.
Several missing protections leave your users and data exposed.
Mostly accessible, but some users still face barriers.
Well-optimized for search — your content is discoverable.
Solid infrastructure — fast server responses across the board.
Mostly compliant — a few items need attention.
Rich content metadata — your pages look great everywhere.
Heavier than average — reducing page weight saves energy and bandwidth.
The overall score is a weighted average of individual category scores. Categories with more impact on user experience and security carry more weight.
Weights reflect general web best practices. Individual needs may differ.
Content-Security-Policy header is missing
Security gaps expose your site and users to attacks, eroding trust.
No Content-Security-Policy header found
Security gaps expose your site and users to attacks, eroding trust.
Page weighs 23.5 MB (13.6 MB transferred)
Performance issues directly impact user engagement and conversion rates.
123 third-party resources (90% of weight)
Performance issues directly impact user engagement and conversion rates.
143 HTTP requests — consider bundling or reducing
Performance issues directly impact user engagement and conversion rates.
High impact, low effort — start here.
High impact, requires investment.
Small gains, minimal effort.
Nothing in this quadrant — good news.
Low impact, high effort — do last.
Nothing in this quadrant — good news.
[](https://beavercheck.com/results/e2361543-0122-4a19-aa56-457756b0d712)<a href="https://beavercheck.com/results/e2361543-0122-4a19-aa56-457756b0d712"><img src="https://beavercheck.com/badge?url=https%3A%2F%2Fcarleton.ca" alt="BeaverCheck Score"></a>https://beavercheck.com/badge?url=https%3A%2F%2Fcarleton.caThis badge auto-updates with your latest scan result.
Your site performs reasonably well, but a few targeted fixes could meaningfully improve results. Your LCP of 2.9s exceeds Google's 2.5s 'Good' threshold and the 3 performance issues below directly contribute to it. Addressing the critical issues below would have the most immediate impact on your user trust.
6 barrier(s) likely increasing bounce by ~27%.
Page loads in 2.9s
+5% bounceEvery additional 100ms above 2.5s costs conversions — you're 444ms over
Fix: Target <2.5s LCP: defer non-critical scripts and optimize the hero image
Page feels frozen for 1.7s
+5% bounceClicks on the primary CTA are ignored while JavaScript runs
Fix: Break up long tasks; defer non-critical JavaScript to post-hydration
No Content-Security-Policy header
+1% bounceHigher XSS blast radius — one compromised script can exfiltrate the checkout form
Fix: Ship a reporting-only CSP first, then enforce once violations are clean
Severe layout shift during page load
+6% bounceUsers mis-click when content jumps — converting intent into frustration
Fix: Reserve space for images, ads, and embeds with explicit width/height
9 link(s) with generic text ("click here", "read more")
+1% bounceScreen-reader users navigating by link list see no context — and search engines can't infer relevance
Fix: Rewrite with descriptive phrases that identify the destination
4 broken link(s) on the page
+5% bounceClicks land on 404s — trust drops and the session often ends
Fix: Fix or remove the broken destinations surfaced on the Content tab
Preliminary CRO audit — each barrier links to the tab with detailed analysis.
CAD 665 investment → CAD 875/month returns + CAD 350,000 risk avoided
CAD 665
7h · 5 findings
CAD 875 /mo
~CAD 10,500 / year
CAD 350,000
if kept compliant
CAD 95 — in quick wins — start here for the fastest payback
Figures combine localized regulatory fine ceilings, search/conversion value priced against local CPC, and bandwidth waste estimates. Results depend on implementation quality and audience composition. Not legal or financial advice.
7.0 developer hours at CA$95/hr
Based on Canada rates (CA$95/hr)
Start here for the best return on investment
CAD 29,171 / month at risk
~CAD 350,055 / year if left unfixed
CAD 350,000
+2 more
CAD 4.62 /mo
42753.1 MB/mo × 0.108 CAD/GB
Compliance figures represent the statutory maximum fine for the most severe triggered category, capped per regulation — not the sum of per-finding penalties. Based on published regulatory fine ranges. This is not legal advice.
Unique monthly visitors from your analytics
Purchases, signups, or key actions
Optional — for revenue estimation
more engaged visitors from reduced bounce
Fix 3 critical issues to capture this value
Based on Google/Deloitte research ("Milliseconds Make Millions") showing a ~7% bounce rate increase per additional second of LCP above the 2.5s "Good" threshold.
Your site's LCP: → estimated after fixes.
These are estimates based on industry research — actual results vary
Your data stays in your browser — nothing is sent to our servers
Thanks for your feedback!
We'll use a cached audit if available, or offer to scan.
Industry-standard audits powered by Google Lighthouse.
Key metrics that affect user experience.
First Contentful Paint First Contentful Paint — how long until the browser renders the first piece of content. Under 1.8s is good.
2.70 s
Largest Contentful Paint Largest Contentful Paint — how long until the largest visible element loads. Under 2.5s is good.
2.94 s
Total Blocking Time Total Blocking Time — total time the main thread was blocked, preventing user input. Under 200ms is good.
1.69 s
Cumulative Layout Shift Cumulative Layout Shift — measures visual stability. How much the page layout shifts during loading. Under 0.1 is good.
0.900
Speed Index Speed Index — how quickly content is visually displayed during load. Under 3.4s is good.
5.25 s
Time to Interactive Time to Interactive — how long until the page is fully interactive and responds to user input. Under 3.8s is good.
29.66 s
Audit breakdown by category with detailed findings.
Remove large, duplicate JavaScript modules from bundles to reduce unnecessary bytes consumed by network activity.
Performance issues directly impact user engagement and conversion rates.
Polyfills and transforms enable older browsers to use new JavaScript features. However, many aren't necessary for modern browsers. Consider modifying your JavaScript build process to not transpile Baseline features, unless you know you must support older browsers. Learn why most sites can deploy ES6+ code without transpiling
Shipping ES5 transpiled code to modern browsers wastes bytes — every user with an evergreen browser pays for compatibility you don't need.
Most users today run browsers that natively support ES6+, async/await, optional chaining, and the rest of modern JavaScript. Transpiling to ES5 'just in case' adds 20-40% to your bundle for no benefit. Configure your build to target a modern browserslist, or ship a differential bundle pair (modern + legacy) with the module/nomodule pattern.
Source: Google web.dev / Lighthouse
3rd party code can significantly impact load performance. Reduce and defer loading of 3rd party code to prioritize your page's content.
Performance issues directly impact user engagement and conversion rates.
A long cache lifetime can speed up repeat visits to your page. Learn more about caching.
Performance issues directly impact user engagement and conversion rates.
Layout shifts occur when elements move absent any user interaction. Investigate the causes of layout shifts, such as elements being added, removed, or their fonts changing as the page loads.
Performance issues directly impact user engagement and conversion rates.
Consider setting font-display to swap or optional to ensure text is consistently visible. swap can be further optimized to mitigate layout shifts with font metric overrides.
Performance issues directly impact user engagement and conversion rates.
Optimize LCP by making the LCP image discoverable from the HTML immediately, and avoiding lazy-loading
Performance issues directly impact user engagement and conversion rates.
HTTP/2 and HTTP/3 offer many benefits over HTTP/1.1, such as multiplexing. Learn more about using modern HTTP.
Performance issues directly impact user engagement and conversion rates.
Avoid chaining critical requests by reducing the length of chains, reducing the download size of resources, or deferring the download of unnecessary resources to improve page load.
Performance issues directly impact user engagement and conversion rates.
Requests are blocking the page's initial render, which may delay LCP. Deferring or inlining can move these network requests out of the critical path.
Performance issues directly impact user engagement and conversion rates.
| URL | Transfer Size | Duration |
|---|---|---|
| /gutenberg/cutheme-twig/cutheme-styles.css.gz?ver=0.39.1 | 41.4 KiB | 1.3 s |
| carleton.ca/wp-content/themes/cutheme-twig/src/scripts/search-autosuggest.js | 2.8 KiB | 282 ms |
Reducing the download time of images can improve the perceived load time of the page and LCP. Learn more about optimizing image size
Performance issues directly impact user engagement and conversion rates.
| URL | Resource Size | Est Savings | |
|---|---|---|---|
div.cu-column > div.not-prose > figure.relative > img div.cu-column > div.not-prose > figure.relative > img | carleton.ca/wp-content/uploads/2026/04/art-in-practice-600x400-1.jpg | 130.9 KiB | 91.8 KiB |
div.cu-column > div.not-prose > figure.relative > img div.cu-column > div.not-prose > figure.relative > img | carleton.ca/wp-content/uploads/2024/11/nursing-launch-600x400-1.jpg | 117.3 KiB | 78.2 KiB |
div.cu-column > div.not-prose > figure.relative > img div.cu-column > div.not-prose > figure.relative > img | carleton.ca/wp-content/uploads/2024/10/undergradute-admissions-300x200-1.jpg | 80.3 KiB | 70.5 KiB |
div.cu-column > div.not-prose > figure.relative > img div.cu-column > div.not-prose > figure.relative > img | carleton.ca/wp-content/uploads/2024/10/continuing-education-300x200-1.jpg | 67.5 KiB | 57.7 KiB |
div.cu-column > div.not-prose > figure.relative > img div.cu-column > div.not-prose > figure.relative > img | carleton.ca/wp-content/uploads/2024/10/attend-300x200-5.jpg | 64.2 KiB | 54.5 KiB |
div.cu-column > div.not-prose > figure.relative > img div.cu-column > div.not-prose > figure.relative > img | carleton.ca/wp-content/uploads/2024/10/attend-300x200-1.jpg | 63.8 KiB | 54.1 KiB |
section.w-screen > div.space-y-6 > div.cu-imagegrid > div.relative section.w-screen > div.space-y-6 > div.cu-imagegrid > div.relative | /wp-content/uploads/2026/04/P_CarletonPhotography_Preside... | 102.6 KiB | 38.6 KiB |
div.cu-column > div.not-prose > figure.relative > img div.cu-column > div.not-prose > figure.relative > img | /wp-content/uploads/2026/03/my-afromania-1200x800-1-1024x... | 64.9 KiB | 25.9 KiB |
section.w-screen > div.space-y-6 > div.cu-imagegrid > div.relative section.w-screen > div.space-y-6 > div.cu-imagegrid > div.relative | /wp-content/uploads/2026/02/campus-life-feb-2026-1200x800... | 87.2 KiB | 23.2 KiB |
A computer monitor displays a stock market chart, with two people visible in th… div.flex > div.flex-1 > figure.wp-block-image > img.wp-image-4183 | /wp-content/uploads/2026/04/real-world-investment-lessons... | 61.6 KiB | 21.0 KiB |
section.w-screen > div.space-y-6 > div.cu-imagegrid > div.relative section.w-screen > div.space-y-6 > div.cu-imagegrid > div.relative | /wp-content/uploads/2026/04/P_CarletonPhotography_SCE_Cap... | 80.4 KiB | 16.4 KiB |
div.cu-column > div.not-prose > figure.relative > img div.cu-column > div.not-prose > figure.relative > img | /wp-content/uploads/2026/03/overcoming-the-digital-divide... | 51.2 KiB | 12.1 KiB |
These insights are also available in the Chrome DevTools Performance Panel - record a trace to view more detailed information.
Time to Interactive is the amount of time it takes for the page to become fully interactive. Learn more about the Time to Interactive metric.
Performance issues directly impact user engagement and conversion rates.
These are the largest layout shifts observed on the page. Each table item represents a single layout shift, and shows the element that shifted the most. Below each item are possible root causes that led to the layout shift. Some of these layout shifts may not be included in the CLS metric value due to windowing. Learn how to improve CLS
Performance issues directly impact user engagement and conversion rates.
| Element | Layout shift score |
|---|---|
Join a Smart, Caring Community
Find your people and your purpose with our new … body.home > main#main-content | 0.887 |
Join a Smart, Caring Community
Find your people and your purpose with our new … main#main-content > section.box-border > section.relative > div.w-full | 0.013 |
The maximum potential First Input Delay that your users could experience is the duration of the longest task. Learn more about the Maximum Potential First Input Delay metric.
Performance issues directly impact user engagement and conversion rates.
Reduce unused rules from stylesheets and defer CSS not used for above-the-fold content to decrease bytes consumed by network activity. Learn how to reduce unused CSS.
Performance issues directly impact user engagement and conversion rates.
| URL | Transfer Size | Est Savings |
|---|---|---|
| /gutenberg/cutheme-twig/cutheme-styles.css.gz?ver=0.39.1 | 41.0 KiB | 35.8 KiB |
Consider reducing the time spent parsing, compiling, and executing JS. You may find delivering smaller JS payloads helps with this. Learn how to reduce Javascript execution time.
Performance issues directly impact user engagement and conversion rates.
Consider reducing the time spent parsing, compiling and executing JS. You may find delivering smaller JS payloads helps with this. Learn how to minimize main-thread work
Performance issues directly impact user engagement and conversion rates.
| Category | Time Spent |
|---|---|
| Script Evaluation | 3.2 s |
| Other | 961 ms |
| Script Parsing & Compilation | 574 ms |
| Style & Layout | 176 ms |
| Garbage Collection | 114 ms |
| Rendering | 98 ms |
| Parse HTML & CSS | 76 ms |
Reduce unused JavaScript and defer loading scripts until they are required to decrease bytes consumed by network activity. Learn how to reduce unused JavaScript.
Multi-megabyte JavaScript bundles delay every interactive feature on the page.
This is the Lighthouse audit fired when too much JS is shipped relative to what executes. The fix isn't a config flag — it requires bundle analysis (webpack-bundle-analyzer, rollup-plugin-visualizer), splitting routes into chunks, lazy-loading off-screen components, and removing unused dependencies. Fundamentally different from minification: minifying reduces byte count, this reduces what's downloaded at all.
Source: Google web.dev / Lighthouse
| URL | Transfer Size | Est Savings |
|---|---|---|
| analytics.tiktok.com/i18n/pixel/static/main.MWE0ZWQ3ZWQwMQ.js | 109.2 KiB | 84.7 KiB |
| www.googletagmanager.com/gtag/js?id=G-BDW6WNFPJQ&cx=c>m=4e64k0 | 176.6 KiB | 69.1 KiB |
| www.googletagmanager.com/gtag/destination?id=AW-489059193&cx=c>m=4e64k0 | 144.2 KiB | 68.7 KiB |
| www.googletagmanager.com/gtag/js?id=G-9NTBQTVYKG&cx=c>m=4e64k0 | 157.3 KiB | 65.8 KiB |
| www.googletagmanager.com/gtag/js?id=G-GPRE4N72YN&cx=c>m=4e64k0 | 151.4 KiB | 63.9 KiB |
| analytics.tiktok.com/i18n/pixel/static/main.MWE0ZWQ3ZWQwOQ.js | 120.9 KiB | 63.4 KiB |
| www.googletagmanager.com/gtag/destination?id=AW-513270063&cx=c>m=4e64k0 | 133.9 KiB | 61.5 KiB |
| www.googletagmanager.com/gtm.js?id=GTM-MH632FV | 191.2 KiB | 61.1 KiB |
| www.googletagmanager.com/gtag/js?id=AW-922400606&cx=c>m=4e64k0 | 146.8 KiB | 60.9 KiB |
| connect.facebook.net/en_US/fbevents.js | 96.5 KiB | 33.0 KiB |
Large network payloads cost users real money and are highly correlated with long load times. Learn how to reduce payload sizes.
Performance issues directly impact user engagement and conversion rates.
Set an explicit width and height on image elements to reduce layout shifts and improve CLS. Learn how to set image dimensions
Performance issues directly impact user engagement and conversion rates.
| URL | |
|---|---|
Logo of Carleton University footer.cu-footerstandard > div.flex > div.grid > img.w-auto | cdn.carleton.ca/rds/assets/cu-logos/cu-logo-color-vertical-outlined.svg |
More information about the performance of your application. These numbers don't directly affect the Performance score.
These checks highlight opportunities to improve the accessibility of your web app. Automatic detection can only detect a subset of issues and does not guarantee the accessibility of your web app, so manual testing is also encouraged.
Deprecated APIs will eventually be removed from the browser. Learn more about deprecated APIs.
Performance issues directly impact user engagement and conversion rates.
| Deprecation / Warning | Source |
|---|---|
| AttributionReporting | |
| StorageType.persistent is deprecated. Please use standardized navigator.storage instead. | a.tribalfusion.com/pixel/tags/Carleton%20University/797213/pixel.js line 113, col 39 |
| Fledge | a.tribalfusion.com/pixel/tags/Carleton%20University/797213/pixel.js line 113, col 39 |
These checks ensure that your page is following basic search engine optimization advice. There are many additional factors Lighthouse does not score here that may affect your search ranking, including performance on Core Web Vitals. Learn more about Google Search Essentials.
Descriptive link text helps search engines understand your content. Learn how to make links more accessible.
Performance issues directly impact user engagement and conversion rates.
| Link destination | Link Text |
|---|---|
| carleton.ca/news/2026/obj-ottawa-forty-under-40-2026/ | Read More |
| /news/2026/carleton-researchers-lead-13-5-million-project... | Read More |
| carleton.ca/news/story/carleton-grad-catherine-sinclair-national-gallery/ | Read More |
| carleton.ca/news/story/my-afromania-international-business/ | Read More |
| /carleton-student-investment-fund-sprott/?utm_medium=webs... | Read More |
| admissions.carleton.ca/ | Learn More |
| graduate.carleton.ca/ | Learn More |
| carleton.ca/continuing-professional/ | Learn More |
| carleton.ca/future-edge/ | Learn More |
Format your HTML in a way that enables crawlers to better understand your app’s content.
Industry-standard audits powered by Google Lighthouse. — Desktop
Key metrics that affect user experience. — Desktop
First Contentful Paint First Contentful Paint — how long until the browser renders the first piece of content. Under 1.8s is good.
1.39 s
Largest Contentful Paint Largest Contentful Paint — how long until the largest visible element loads. Under 2.5s is good.
1.69 s
Total Blocking Time Total Blocking Time — total time the main thread was blocked, preventing user input. Under 200ms is good.
99 ms
Cumulative Layout Shift Cumulative Layout Shift — measures visual stability. How much the page layout shifts during loading. Under 0.1 is good.
0.281
Speed Index Speed Index — how quickly content is visually displayed during load. Under 3.4s is good.
1.88 s
Time to Interactive Time to Interactive — how long until the page is fully interactive and responds to user input. Under 3.8s is good.
5.62 s
Audit breakdown by category with detailed findings.
Remove large, duplicate JavaScript modules from bundles to reduce unnecessary bytes consumed by network activity.
Performance issues directly impact user engagement and conversion rates.
Polyfills and transforms enable older browsers to use new JavaScript features. However, many aren't necessary for modern browsers. Consider modifying your JavaScript build process to not transpile Baseline features, unless you know you must support older browsers. Learn why most sites can deploy ES6+ code without transpiling
Shipping ES5 transpiled code to modern browsers wastes bytes — every user with an evergreen browser pays for compatibility you don't need.
Most users today run browsers that natively support ES6+, async/await, optional chaining, and the rest of modern JavaScript. Transpiling to ES5 'just in case' adds 20-40% to your bundle for no benefit. Configure your build to target a modern browserslist, or ship a differential bundle pair (modern + legacy) with the module/nomodule pattern.
Source: Google web.dev / Lighthouse
3rd party code can significantly impact load performance. Reduce and defer loading of 3rd party code to prioritize your page's content.
Performance issues directly impact user engagement and conversion rates.
A long cache lifetime can speed up repeat visits to your page. Learn more about caching.
Performance issues directly impact user engagement and conversion rates.
Layout shifts occur when elements move absent any user interaction. Investigate the causes of layout shifts, such as elements being added, removed, or their fonts changing as the page loads.
Performance issues directly impact user engagement and conversion rates.
Consider setting font-display to swap or optional to ensure text is consistently visible. swap can be further optimized to mitigate layout shifts with font metric overrides.
Performance issues directly impact user engagement and conversion rates.
A forced reflow occurs when JavaScript queries geometric properties (such as offsetWidth) after styles have been invalidated by a change to the DOM state. This can result in poor performance. Learn more about forced reflows and possible mitigations.
Performance issues directly impact user engagement and conversion rates.
Reducing the download time of images can improve the perceived load time of the page and LCP. Learn more about optimizing image size
Performance issues directly impact user engagement and conversion rates.
| URL | Resource Size | Est Savings | |
|---|---|---|---|
div.cu-column > div.not-prose > figure.relative > img div.cu-column > div.not-prose > figure.relative > img | carleton.ca/wp-content/uploads/2026/04/art-in-practice-600x400-1.jpg | 130.9 KiB | 122.4 KiB |
div.cu-column > div.not-prose > figure.relative > img div.cu-column > div.not-prose > figure.relative > img | carleton.ca/wp-content/uploads/2024/11/nursing-launch-600x400-1.jpg | 117.3 KiB | 108.8 KiB |
div.cu-column > div.not-prose > figure.relative > img div.cu-column > div.not-prose > figure.relative > img | carleton.ca/wp-content/uploads/2024/10/undergradute-admissions-300x200-1.jpg | 80.3 KiB | 71.8 KiB |
section.w-screen > div.space-y-6 > div.cu-imagegrid > div.relative section.w-screen > div.space-y-6 > div.cu-imagegrid > div.relative | /wp-content/uploads/2026/03/P_CarletonPhotography_MensBas... | 135.4 KiB | 71.4 KiB |
div.cu-column > div.not-prose > figure.relative > img div.cu-column > div.not-prose > figure.relative > img | carleton.ca/wp-content/uploads/2024/10/continuing-education-300x200-1.jpg | 67.5 KiB | 59.0 KiB |
div.cu-column > div.not-prose > figure.relative > img div.cu-column > div.not-prose > figure.relative > img | /wp-content/uploads/2026/03/my-afromania-1200x800-1-1024x... | 64.9 KiB | 56.5 KiB |
div.cu-column > div.not-prose > figure.relative > img div.cu-column > div.not-prose > figure.relative > img | carleton.ca/wp-content/uploads/2024/10/attend-300x200-5.jpg | 64.2 KiB | 55.8 KiB |
div.cu-column > div.not-prose > figure.relative > img div.cu-column > div.not-prose > figure.relative > img | carleton.ca/wp-content/uploads/2024/10/attend-300x200-1.jpg | 63.8 KiB | 55.4 KiB |
section.w-screen > div.space-y-6 > div.cu-imagegrid > div.relative section.w-screen > div.space-y-6 > div.cu-imagegrid > div.relative | carleton.ca/wp-content/uploads/2026/03/Iron-Ring-Winter-Ceremony-768x512.jpg | 112.2 KiB | 48.2 KiB |
div.cu-column > div.not-prose > figure.relative > img div.cu-column > div.not-prose > figure.relative > img | /wp-content/uploads/2026/03/overcoming-the-digital-divide... | 51.2 KiB | 42.7 KiB |
section.w-screen > div.space-y-6 > div.cu-imagegrid > div.relative section.w-screen > div.space-y-6 > div.cu-imagegrid > div.relative | /wp-content/uploads/2026/04/P_CarletonPhotography_Preside... | 102.6 KiB | 38.6 KiB |
section.w-screen > div.space-y-6 > div.cu-imagegrid > div.relative section.w-screen > div.space-y-6 > div.cu-imagegrid > div.relative | /wp-content/uploads/2026/02/campus-life-feb-2026-1200x800... | 87.2 KiB | 23.2 KiB |
section.w-screen > div.space-y-6 > div.cu-imagegrid > div.relative section.w-screen > div.space-y-6 > div.cu-imagegrid > div.relative | /wp-content/uploads/2026/04/P_CarletonPhotography_SCE_Cap... | 80.4 KiB | 16.4 KiB |
A computer monitor displays a stock market chart, with two people visible in th… div.flex > div.flex-1 > figure.wp-block-image > img.wp-image-4183 | /wp-content/uploads/2026/04/real-world-investment-lessons... | 36.0 KiB | 7.6 KiB |
Optimize LCP by making the LCP image discoverable from the HTML immediately, and avoiding lazy-loading
Performance issues directly impact user engagement and conversion rates.
HTTP/2 and HTTP/3 offer many benefits over HTTP/1.1, such as multiplexing. Learn more about using modern HTTP.
Performance issues directly impact user engagement and conversion rates.
Avoid chaining critical requests by reducing the length of chains, reducing the download size of resources, or deferring the download of unnecessary resources to improve page load.
Performance issues directly impact user engagement and conversion rates.
Requests are blocking the page's initial render, which may delay LCP. Deferring or inlining can move these network requests out of the critical path.
Performance issues directly impact user engagement and conversion rates.
| URL | Transfer Size | Duration |
|---|---|---|
| /gutenberg/cutheme-twig/cutheme-styles.css.gz?ver=0.39.1 | 41.5 KiB | 660 ms |
| carleton.ca/wp-content/themes/cutheme-twig/src/scripts/search-autosuggest.js | 2.4 KiB | 170 ms |
These insights are also available in the Chrome DevTools Performance Panel - record a trace to view more detailed information.
These are the largest layout shifts observed on the page. Each table item represents a single layout shift, and shows the element that shifted the most. Below each item are possible root causes that led to the layout shift. Some of these layout shifts may not be included in the CLS metric value due to windowing. Learn how to improve CLS
Performance issues directly impact user engagement and conversion rates.
| Element | Layout shift score |
|---|---|
Feature
Celebrating Ottawa’s Rising Business Leaders
Five Carleton community … body.home > main#main-content > section.box-border > section.w-screen | 0.250 |
Join a Smart, Caring Community
Find your people and your purpose with our new … body.home > main#main-content | 0.025 |
About
Admissions
Academics
Research
Priorities
Future Students
Browse
Apply
Don… header.sticky > nav.cu-nav--top > div.flex > div.cu-nav__aside | 0.006 |
Alumna Catherine Sinclair reflects on how her Carleton education led to a leade… div.space-y-6 > div.cu-column > div.not-prose > div.flex | 0.001 |
Time to Interactive is the amount of time it takes for the page to become fully interactive. Learn more about the Time to Interactive metric.
Performance issues directly impact user engagement and conversion rates.
Reduce unused rules from stylesheets and defer CSS not used for above-the-fold content to decrease bytes consumed by network activity. Learn how to reduce unused CSS.
Performance issues directly impact user engagement and conversion rates.
| URL | Transfer Size | Est Savings |
|---|---|---|
| /gutenberg/cutheme-twig/cutheme-styles.css.gz?ver=0.39.1 | 41.0 KiB | 33.8 KiB |
Reduce unused JavaScript and defer loading scripts until they are required to decrease bytes consumed by network activity. Learn how to reduce unused JavaScript.
Multi-megabyte JavaScript bundles delay every interactive feature on the page.
This is the Lighthouse audit fired when too much JS is shipped relative to what executes. The fix isn't a config flag — it requires bundle analysis (webpack-bundle-analyzer, rollup-plugin-visualizer), splitting routes into chunks, lazy-loading off-screen components, and removing unused dependencies. Fundamentally different from minification: minifying reduces byte count, this reduces what's downloaded at all.
Source: Google web.dev / Lighthouse
| URL | Transfer Size | Est Savings |
|---|---|---|
| analytics.tiktok.com/i18n/pixel/static/main.MWE0ZWQ3ZWQwOQ.js | 120.9 KiB | 93.1 KiB |
| www.googletagmanager.com/gtag/js?id=G-BDW6WNFPJQ&cx=c>m=4e64k0 | 176.6 KiB | 70.0 KiB |
| www.googletagmanager.com/gtag/destination?id=AW-489059193&cx=c>m=4e64k0 | 144.2 KiB | 67.8 KiB |
| www.googletagmanager.com/gtag/js?id=G-9NTBQTVYKG&cx=c>m=4e64k0 | 157.3 KiB | 65.6 KiB |
| www.googletagmanager.com/gtag/js?id=G-GPRE4N72YN&cx=c>m=4e64k0 | 151.4 KiB | 63.9 KiB |
| www.googletagmanager.com/gtag/destination?id=AW-513270063&cx=c>m=4e64k0 | 133.9 KiB | 61.5 KiB |
| www.googletagmanager.com/gtm.js?id=GTM-MH632FV | 191.2 KiB | 61.2 KiB |
| www.googletagmanager.com/gtag/js?id=AW-922400606&cx=c>m=4e64k0 | 146.8 KiB | 60.7 KiB |
| analytics.tiktok.com/i18n/pixel/static/main.MWE0ZWQ3ZWQwMQ.js | 109.2 KiB | 56.3 KiB |
| connect.facebook.net/en_US/fbevents.js | 96.5 KiB | 33.8 KiB |
Large network payloads cost users real money and are highly correlated with long load times. Learn how to reduce payload sizes.
Performance issues directly impact user engagement and conversion rates.
Set an explicit width and height on image elements to reduce layout shifts and improve CLS. Learn how to set image dimensions
Performance issues directly impact user engagement and conversion rates.
| URL | |
|---|---|
Logo of Carleton University footer.cu-footerstandard > div.flex > div.grid > img.w-auto | cdn.carleton.ca/rds/assets/cu-logos/cu-logo-color-vertical-outlined.svg |
Carleton div#footer-links > div > a.w-16 > img.w-16 | cdn.carleton.ca/rds/assets/ravens-logos/ravens-logo.svg |
More information about the performance of your application. These numbers don't directly affect the Performance score.
These checks highlight opportunities to improve the accessibility of your web app. Automatic detection can only detect a subset of issues and does not guarantee the accessibility of your web app, so manual testing is also encouraged.
Deprecated APIs will eventually be removed from the browser. Learn more about deprecated APIs.
Performance issues directly impact user engagement and conversion rates.
| Deprecation / Warning | Source |
|---|---|
| StorageType.persistent is deprecated. Please use standardized navigator.storage instead. | a.tribalfusion.com/pixel/tags/Carleton%20University/797213/pixel.js line 113, col 39 |
| Fledge | a.tribalfusion.com/pixel/tags/Carleton%20University/797213/pixel.js line 113, col 39 |
| AttributionReporting |
These checks ensure that your page is following basic search engine optimization advice. There are many additional factors Lighthouse does not score here that may affect your search ranking, including performance on Core Web Vitals. Learn more about Google Search Essentials.
Descriptive link text helps search engines understand your content. Learn how to make links more accessible.
Performance issues directly impact user engagement and conversion rates.
| Link destination | Link Text |
|---|---|
| carleton.ca/news/2026/obj-ottawa-forty-under-40-2026/ | Read More |
| /news/2026/carleton-researchers-lead-13-5-million-project... | Read More |
| carleton.ca/news/story/carleton-grad-catherine-sinclair-national-gallery/ | Read More |
| carleton.ca/news/story/my-afromania-international-business/ | Read More |
| /carleton-student-investment-fund-sprott/?utm_medium=webs... | Read More |
| admissions.carleton.ca/ | Learn More |
| graduate.carleton.ca/ | Learn More |
| carleton.ca/continuing-professional/ | Learn More |
| carleton.ca/future-edge/ | Learn More |
Format your HTML in a way that enables crawlers to better understand your app’s content.
Send Feedback