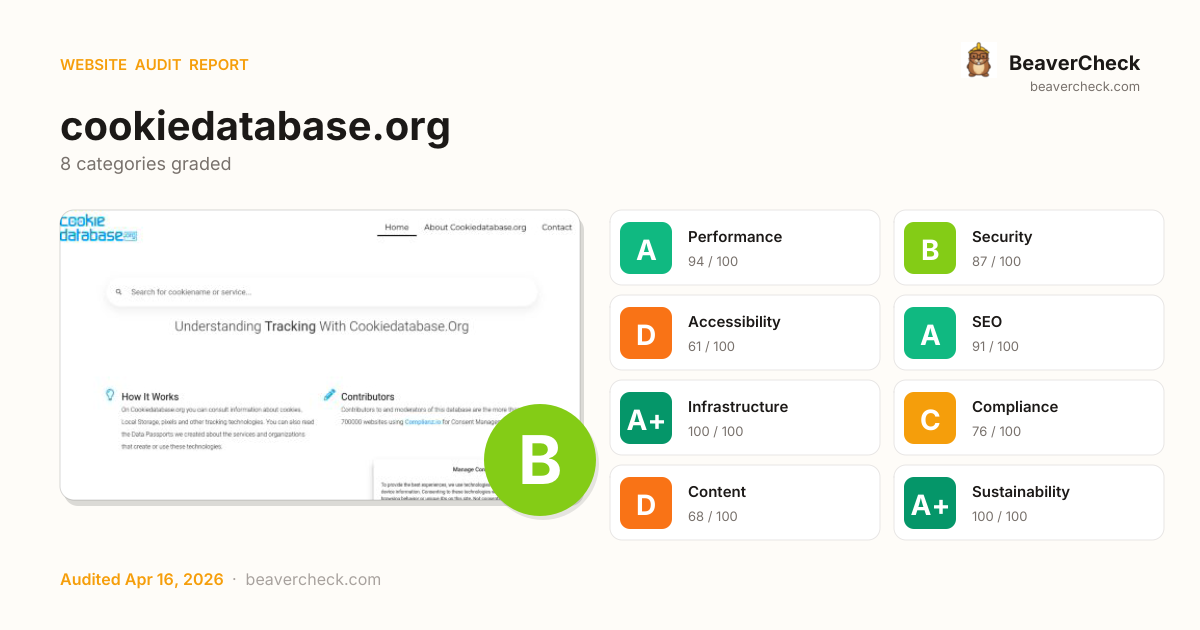
Audit overview
Accessibility and Content need attention; the other categories are in good shape.
Fix Priority Matrix
5 findingsQuick Wins
4High impact, low effort — start here.
Strategic
1High impact, requires investment.
Easy Improvements
0Small gains, minimal effort.
Nothing in this quadrant — good news.
Deprioritize
0Low impact, high effort — do last.
Nothing in this quadrant — good news.
Screenshots
Top Priorities (5)
2 link(s) with no accessible text
Links with no accessible text (empty <a></a>, image-only no alt, icon-only no aria-label) are unidentifiable to screen readers.
No <main> landmark found
Without a <main> landmark, screen-reader users can't skip past the navigation to the page content — every page starts with re-reading the menu.
Cross-Origin-Embedder-Policy header is missing
COEP enforces that all embedded resources opt-in to cross-origin embedding — required for cross-origin isolation features.
Unattributable: 291ms CPU time
Informational: CPU time spent on this resource. Total >1s is a perf budget violation.
base-uri directive is missing
Missing base-uri in CSP leaves a base-tag injection attack path open even on otherwise strict policies.
Business case
What fixing the audit's findings is worth -- and what ignoring them keeps costing.
Return on investment
$175 investment → $7,116/month returns + USD 157,500 risk avoided
Figures combine localized regulatory fine ceilings, search/conversion value priced against local CPC, and bandwidth waste estimates. Results depend on implementation quality and audience composition. Not legal or financial advice.
Conversion barriers
6 barrier(s) likely increasing bounce by ~18%.
- Page loads in 4.0sEvery additional 100ms above 2.5s costs conversions — you're 1.5s over→ Target <2.5s LCP: defer non-critical scripts and optimize the hero image
- No Content-Security-Policy headerHigher XSS blast radius — one compromised script can exfiltrate the checkout form→ Ship a reporting-only CSP first, then enforce once violations are clean
- No Open Graph tagsLinks shared on LinkedIn / Slack / Facebook show bare URLs — referral clicks drop→ Add og:title, og:description, og:image, og:url to the page head
- No structured dataNo rich-result eligibility in Google — lower SERP CTR vs competitors with stars and prices→ Add JSON-LD for your page type (Product, Article, FAQPage, LocalBusiness, …)
- Content is hard to readGraduate-level reading difficulty — limits the addressable audience for product or blog pages→ Shorten sentences; replace jargon with plain language; target Flesch ease ≥60
Preliminary CRO audit — each barrier links to the tab with detailed analysis.
Remediation cost
Start here for the best return on investment
Cost by category
Cost by effort level
Adjust assumptions
Team composition
Multiplier applied to dev hours to reflect QA, design, and PM overhead. Use Dev only for solo work; Full team for projects with formal review processes.
Rates reflect fully-loaded developer cost including overhead
Warning:Cost of inaction
Compliance Risk
$157,500
- No privacy policy link detectedCCPA/CPRA: USD 2,500 – USD 7,500
- Trackers detected but no cookie policy foundCCPA/CPRA: USD 2,500 – USD 7,500
- Trackers detected but no privacy policy foundCCPA/CPRA: USD 2,500 – USD 7,500
Bounce-Rate Cost
$4,730 /mo
+17.6pp bounce · ~1,758 lost visitors/mo
CPC: USD 2.69
Bandwidth Waste
$0.16 /mo
1958.0 MB/mo × 0.080 USD/GB
- Optimize transfer: save ~196 KB per page loadSaves $0.16/mo
Compliance figures represent the statutory maximum fine for the most severe triggered category, capped per regulation — not the sum of per-finding penalties. Based on published regulatory fine ranges. This is not legal advice.
Unique monthly visitors from your analytics
Purchases, signups, or key actions
Optional — for revenue estimation
more engaged visitors from reduced bounce
Fix 2 critical issues to capture this value
How this is calculated
Based on Google/Deloitte research ("Milliseconds Make Millions") showing a ~7% bounce rate increase per additional second of LCP above the 2.5s "Good" threshold.
Your site's LCP: → estimated after fixes.
These are estimates based on industry research — actual results vary
Your data stays in your browser — nothing is sent to our servers
Lighthouse
Mobile
First Contentful Paint First Contentful Paint — how long until the browser renders the first piece of content. Under 1.8s is good.
1.60 s
Largest Contentful Paint Largest Contentful Paint — how long until the largest visible element loads. Under 2.5s is good.
3.96 s
Total Blocking Time Total Blocking Time — total time the main thread was blocked, preventing user input. Under 200ms is good.
29 ms
Cumulative Layout Shift Cumulative Layout Shift — measures visual stability. How much the page layout shifts during loading. Under 0.1 is good.
0.000
Speed Index Speed Index — how quickly content is visually displayed during load. Under 3.4s is good.
2.48 s
Time to Interactive Time to Interactive — how long until the page is fully interactive and responds to user input. Under 3.8s is good.
4.07 s
Desktop
First Contentful Paint First Contentful Paint — how long until the browser renders the first piece of content. Under 1.8s is good.
762 ms
Largest Contentful Paint Largest Contentful Paint — how long until the largest visible element loads. Under 2.5s is good.
1.17 s
Total Blocking Time Total Blocking Time — total time the main thread was blocked, preventing user input. Under 200ms is good.
0 ms
Cumulative Layout Shift Cumulative Layout Shift — measures visual stability. How much the page layout shifts during loading. Under 0.1 is good.
0.003
Speed Index Speed Index — how quickly content is visually displayed during load. Under 3.4s is good.
985 ms
Time to Interactive Time to Interactive — how long until the page is fully interactive and responds to user input. Under 3.8s is good.
1.17 s
Categories
8Performance
Unattributable: 291ms CPU time
Security
Cross-Origin-Embedder-Policy header is missing
Accessibility
2 link(s) with no accessible text
SEO
All checks pass
Infrastructure
All checks pass
Compliance
All checks pass
Content
All checks pass
Sustainability
All checks pass
How you compare
Where this site stands against peers running the same stack.
Top 10% of WordPress sites score 97+ on Content; you're at 68 — closing this gap is the highest-leverage improvement.
Technology stack
Elementor 3.35.5, on PHP, with Cloudflare CDN
Stack Architecture
 Draftpress HFCM
  WPML 4.6.15
 Elementor 3.35.5
 WordPress
  Complianz 7.5.7.2
 Font Awesome Google Search Console Google Workspace HSTS
  HTTP/3
  Hello Elementor 3.4.6
 MySQL
MySQL  Priority Hints
  RSS
RSS  Really Simple SSL & Security
  Select2
  core-js 3.46.0
 jQuery 3.7.1 jQuery Migrate 3.4.1
 jQuery UI 1.13.3
 PHP
PHP  Cloudflare
 All Detected Technologies (22)
Cloudflare is a web-infrastructure and website-security company, providing content-delivery-network services, DDoS mitigation, Internet security, and distributed domain-name-server services.
PHP is a general-purpose scripting language used for web development.
Elementor is a website builder platform for professionals on WordPress.
WordPress is a free and open-source content management system written in PHP and paired with a MySQL or MariaDB database. Features include a plugin architecture and a template system.
Complianz is a GDPR/CCPA Cookie Consent plugin that supports GDPR, DSGVO, CCPA and PIPEDA with a conditional Cookie Notice and customized Cookie Policy based on the results of the built-in Cookie Scan.
Font Awesome is a font and icon toolkit based on CSS and Less.
HTTP Strict Transport Security (HSTS) informs browsers that the site should only be accessed using HTTPS.
HTTP/3 is the third major version of the Hypertext Transfer Protocol used to exchange information on the World Wide Web.
Hello Elementor is a WordPress theme built for the Elementor website builder platform. It uses minimal styling and scripts for maximum speed and design freedom.
MySQL is an open-source relational database management system.
Priority Hints exposes a mechanism for developers to signal a relative priority for browsers to consider when fetching resources.
RSS is a family of web feed formats used to publish frequently updated works—such as blog entries, news headlines, audio, and video—in a standardized format.
Really Simple SSL & Security is an easy to install and performant security solution for WordPress.
Select2 is a jQuery based replacement for select boxes. It supports searching, remote data sets, and infinite scrolling of results.
core-js is a modular standard library for JavaScript, with polyfills for cutting-edge ECMAScript features.
jQuery is a JavaScript library which is a free, open-source software designed to simplify HTML DOM tree traversal and manipulation, as well as event handling, CSS animation, and Ajax.
Query Migrate is a javascript library that allows you to preserve the compatibility of your jQuery code developed for versions of jQuery older than 1.9.
jQuery UI is a collection of GUI widgets, animated visual effects, and themes implemented with jQuery, Cascading Style Sheets, and HTML.
Header Footer Code Manager by Draftpress is a easy interface to add snippets to the header or footer or above or below the content of your page.
WPML plugin makes it possible to build and run fully multilingual WordPress sites.
Observations (3)
WordPress detected — review security configuration
WordPress sites benefit from: protecting wp-login.php, disabling XML-RPC if unused, restricting REST API access, and keeping all plugins and themes up to date. Check the Security tab for specific findings.
No build tool detected
A framework (Complianz) was detected but no bundler was identified. The build tool may not be detectable from output patterns, or the site may use the framework's built-in bundler.
Complex technology stack detected
22 technologies identified. A complex stack increases maintenance burden and attack surface. Consider whether all components are actively needed.
Show your score
Drop this badge on your README, marketing site, or status page. It auto-updates every time the audit re-runs and links back to this report.
This badge auto-updates with your latest scan result.
[](https://beavercheck.com/results/e3899637-3804-408b-a0f1-626e42b62400)<a href="https://beavercheck.com/results/e3899637-3804-408b-a0f1-626e42b62400"><img src="https://beavercheck.com/badge?url=https%3A%2F%2Fcookiedatabase.org" alt="BeaverCheck Score"></a>https://beavercheck.com/badge?url=https%3A%2F%2Fcookiedatabase.orgExport & share
Download the audit, share with your team, or grab a fix plan ready to copy into your tracker.
Copies markdown to clipboard
Fix Plan
Three-week roadmap to ship the audit's findings, with one-click copy targets for your tracker.
Three-week fix plan
2 sprints · 2h total → projected A (91)
Sprint 1: Quick Wins
+5Highest ROI — low effort, high impact
- · No <main> landmark found
- · 2 link(s) with no accessible text
- · Unattributable: 291ms CPU time
- · base-uri directive is missing
Sprint 2: Core Fixes
+1Medium effort, high structural impact
- · Cross-Origin-Embedder-Policy header is missing