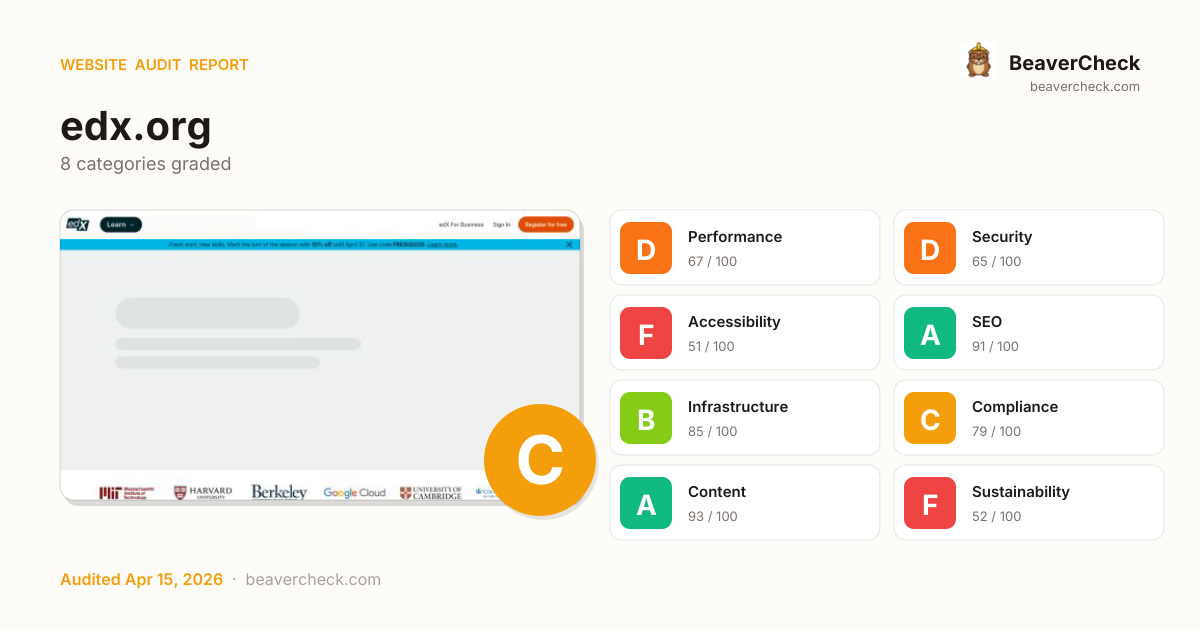
Mobile 375 × 812

Desktop 1440 × 900

Score: 70 / 100
Based on 8 categories, 0 sections
Room to improve — your 46.8s load time is above Google's 2.5s 'Good' threshold.
Several missing protections leave your users and data exposed.
Several issues make your site difficult for assistive technology users.
Well-optimized for search — your content is discoverable.
Solid infrastructure — fast server responses across the board.
Mostly compliant — a few items need attention.
Rich content metadata — your pages look great everywhere.
Heavier than average — reducing page weight saves energy and bandwidth.
The overall score is a weighted average of individual category scores. Categories with more impact on user experience and security carry more weight.
Weights reflect general web best practices. Individual needs may differ.
Content-Security-Policy header is missing
Security gaps expose your site and users to attacks, eroding trust.
HSTS header is missing
Security gaps expose your site and users to attacks, eroding trust.
No Content-Security-Policy header found
Security gaps expose your site and users to attacks, eroding trust.
Page weighs 22.9 MB (5.4 MB transferred)
Performance issues directly impact user engagement and conversion rates.
1 control(s) without accessible label
Accessibility issues exclude users with disabilities — up to 15% of your potential audience.
High impact, low effort — start here.
High impact, requires investment.
Small gains, minimal effort.
Nothing in this quadrant — good news.
Low impact, high effort — do last.
Nothing in this quadrant — good news.
[](https://beavercheck.com/results/e683c6a5-9589-4681-bbd0-8114d468e22d)<a href="https://beavercheck.com/results/e683c6a5-9589-4681-bbd0-8114d468e22d"><img src="https://beavercheck.com/badge?url=https%3A%2F%2Fedx.org" alt="BeaverCheck Score"></a>https://beavercheck.com/badge?url=https%3A%2F%2Fedx.orgThis badge auto-updates with your latest scan result.
Your site performs reasonably well, but a few targeted fixes could meaningfully improve results. Your LCP of 46.8s exceeds Google's 2.5s 'Good' threshold and the 1 performance issue below directly contributes to it. Accessibility issues exclude users who rely on assistive technology — an estimated 15% of your potential audience. Addressing the critical issues below would have the most immediate impact on your user trust.
€425 investment → €1.25/month returns + EUR 120,500,000 risk avoided
€425
5h · 5 findings
€1.25 /mo
~€15 / year
EUR 120,500,000
if kept compliant
€128 — in quick wins — start here for the fastest payback
Figures combine localized regulatory fine ceilings, search/conversion value priced against local CPC, and bandwidth waste estimates. Results depend on implementation quality and audience composition. Not legal or financial advice.
5.0 developer hours at €85/hr
Based on European Union rates (€85/hr)
Start here for the best return on investment
€10,041,668 / month at risk
~€120,500,015 / year if left unfixed
€120,500,000
+8 more
€1.25 /mo
16855.0 MB/mo × 0.074 EUR/GB
Compliance figures represent the statutory maximum fine for the most severe triggered category, capped per regulation — not the sum of per-finding penalties. Based on published regulatory fine ranges. This is not legal advice.
Unique monthly visitors from your analytics
Purchases, signups, or key actions
Optional — for revenue estimation
more engaged visitors from reduced bounce
Fix 5 critical issues to capture this value
Based on Google/Deloitte research ("Milliseconds Make Millions") showing a ~7% bounce rate increase per additional second of LCP above the 2.5s "Good" threshold.
Your site's LCP: → estimated after fixes.
These are estimates based on industry research — actual results vary
Your data stays in your browser — nothing is sent to our servers
Thanks for your feedback!
We'll use a cached audit if available, or offer to scan.
Industry-standard audits powered by Google Lighthouse.
Key metrics that affect user experience.
First Contentful Paint First Contentful Paint — how long until the browser renders the first piece of content. Under 1.8s is good.
6.48 s
Largest Contentful Paint Largest Contentful Paint — how long until the largest visible element loads. Under 2.5s is good.
46.77 s
Total Blocking Time Total Blocking Time — total time the main thread was blocked, preventing user input. Under 200ms is good.
21.32 s
Cumulative Layout Shift Cumulative Layout Shift — measures visual stability. How much the page layout shifts during loading. Under 0.1 is good.
0.168
Speed Index Speed Index — how quickly content is visually displayed during load. Under 3.4s is good.
18.10 s
Time to Interactive Time to Interactive — how long until the page is fully interactive and responds to user input. Under 3.8s is good.
51.57 s
Audit breakdown by category with detailed findings.
Remove large, duplicate JavaScript modules from bundles to reduce unnecessary bytes consumed by network activity.
Performance issues directly impact user engagement and conversion rates.
Polyfills and transforms enable older browsers to use new JavaScript features. However, many aren't necessary for modern browsers. Consider modifying your JavaScript build process to not transpile Baseline features, unless you know you must support older browsers. Learn why most sites can deploy ES6+ code without transpiling
Shipping ES5 transpiled code to modern browsers wastes bytes — every user with an evergreen browser pays for compatibility you don't need.
Most users today run browsers that natively support ES6+, async/await, optional chaining, and the rest of modern JavaScript. Transpiling to ES5 'just in case' adds 20-40% to your bundle for no benefit. Configure your build to target a modern browserslist, or ship a differential bundle pair (modern + legacy) with the module/nomodule pattern.
Source: Google web.dev / Lighthouse
3rd party code can significantly impact load performance. Reduce and defer loading of 3rd party code to prioritize your page's content.
Performance issues directly impact user engagement and conversion rates.
A long cache lifetime can speed up repeat visits to your page. Learn more about caching.
Performance issues directly impact user engagement and conversion rates.
| Request | Cache TTL | Transfer Size |
|---|---|---|
| www.edx.org/api/auto-block?id=fa169e97-be64-4cc1-bad3-9534590f9a30 | 3600.0 s | 93.4 KiB |
| /_next/image?url=https%3A%2F%2Fimages.cdn.edx.org%2Fattac... | 300.0 s | 57.9 KiB |
| beam.edx.org/scripttemplates/202407.2.0/otBannerSdk.js | 86400.0 s | 110.5 KiB |
| www.edx.org/beam.js | 0.0 ms | 35.1 KiB |
| /_next/image?url=https%3A%2F%2Fimages.cdn.edx.org%2Fattac... | 300.0 s | 18.6 KiB |
| www.edx.org/favicon.ico | 300.0 s | 10.1 KiB |
| sonic-ui.highereducation.com/latest/ucl.adapter.js | 86400.0 s | 21.2 KiB |
| beam.edx.org/scripttemplates/otSDKStub.js | 86400.0 s | 9.3 KiB |
| www.edx.org/trademark-logos/edx-by-2u-white.svg | 10.0 s | 2.8 KiB |
| www.edx.org/trademark-logos/edx-logo-elm.svg | 10.0 s | 2.6 KiB |
| edx-cdn.org/v3/prod/logo.svg | 3600.0 s | 2.4 KiB |
| sonic-ui.highereducation.com/latest/ucl.publisher.js | 86400.0 s | 4.7 KiB |
| www.edx.org/_next/image?url=%2Ficons%2Fai-icon.png&w=96&q=75 | 300.0 s | 1.8 KiB |
| /_r?sdk=web2.86.4&branch_key=key_live_kpxBY7wsvq7tp8eu5TH... | 0.0 ms | 672 B |
| beam.edx.org/logos/static/ot_close.svg | 86400.0 s | 1.1 KiB |
Layout shifts occur when elements move absent any user interaction. Investigate the causes of layout shifts, such as elements being added, removed, or their fonts changing as the page loads.
Performance issues directly impact user engagement and conversion rates.
Your first network request is the most important. Reduce its latency by avoiding redirects, ensuring a fast server response, and enabling text compression.
Performance issues directly impact user engagement and conversion rates.
A forced reflow occurs when JavaScript queries geometric properties (such as offsetWidth) after styles have been invalidated by a change to the DOM state. This can result in poor performance. Learn more about forced reflows and possible mitigations.
Performance issues directly impact user engagement and conversion rates.
Each subpart has specific improvement strategies. Ideally, most of the LCP time should be spent on loading the resources, not within delays.
Performance issues directly impact user engagement and conversion rates.
Optimize LCP by making the LCP image discoverable from the HTML immediately, and avoiding lazy-loading
Performance issues directly impact user engagement and conversion rates.
Avoid chaining critical requests by reducing the length of chains, reducing the download size of resources, or deferring the download of unnecessary resources to improve page load.
Performance issues directly impact user engagement and conversion rates.
Requests are blocking the page's initial render, which may delay LCP. Deferring or inlining can move these network requests out of the critical path.
Performance issues directly impact user engagement and conversion rates.
Reducing the download time of images can improve the perceived load time of the page and LCP. Learn more about optimizing image size
Performance issues directly impact user engagement and conversion rates.
| URL | Resource Size | Est Savings | |
|---|---|---|---|
div.container > div.lg:ml-auto > div.w-full > img.optanon-category-C0001 div.container > div.lg:ml-auto > div.w-full > img.optanon-category-C0001 | /_next/image?url=https%3A%2F%2Fimages.cdn.edx.org%2Fattac... | 56.7 KiB | 38.7 KiB |
AI for Everyone: Master the Basics a.w-full > div.text-card-foreground > div.flex > img.optanon-category-C0001 | /_next/image?url=https%3A%2F%2Fprod-discovery.edx-cdn.org... | 41.2 KiB | 21.6 KiB |
Supply Chain Fundamentals. a.w-full > div.text-card-foreground > div.flex > img.optanon-category-C0001 | /_next/image?url=https%3A%2F%2Fprod-discovery.edx-cdn.org... | 28.0 KiB | 8.4 KiB |
div.embla__container > div.embla__slide > div.relative > img.optanon-category-C0001 div.embla__container > div.embla__slide > div.relative > img.optanon-category-C0001 | /_next/image?url=https%3A%2F%2Fimages.cdn.edx.org%2Fattac... | 17.5 KiB | 5.9 KiB |
These insights are also available in the Chrome DevTools Performance Panel - record a trace to view more detailed information.
Time to Interactive is the amount of time it takes for the page to become fully interactive. Learn more about the Time to Interactive metric.
Performance issues directly impact user engagement and conversion rates.
The maximum potential First Input Delay that your users could experience is the duration of the longest task. Learn more about the Maximum Potential First Input Delay metric.
Performance issues directly impact user engagement and conversion rates.
Redirects introduce additional delays before the page can be loaded. Learn how to avoid page redirects.
Performance issues directly impact user engagement and conversion rates.
| URL | Time Spent |
|---|---|
| edx.org/ | 754 ms |
| www.edx.org/ | 0.0 ms |
These are the largest layout shifts observed on the page. Each table item represents a single layout shift, and shows the element that shifted the most. Below each item are possible root causes that led to the layout shift. Some of these layout shifts may not be included in the CLS metric value due to windowing. Learn how to improve CLS
Performance issues directly impact user engagement and conversion rates.
| Element | Layout shift score |
|---|---|
Next slide div > main#page-id-3021 > article.container > div.py-1 | 0.168 |
We and our partners use cookies to enhance your experience on our site, analyse… body.__className_f367f3 > div#onetrust-consent-sdk > div#onetrust-banner-sdk | 0.036 |
Trending on edX
Executive Education
Featured
AI & Digital Transformation
Sustai… div > main#page-id-3021 > article.container > div.py-8 | 0.025 |
We and our partners use cookies to enhance your experience on our site, analyse… body.__className_f367f3 > div#onetrust-consent-sdk > div#onetrust-banner-sdk | 0.007 |
Branch Banner Frame body.__className_f367f3 > iframe#branch-banner-iframe | 0.005 |
Branch Banner Frame body.__className_f367f3 > iframe#branch-banner-iframe | 0.003 |
We and our partners use cookies to enhance your experience on our site, analyse… body.__className_f367f3 > div#onetrust-consent-sdk > div#onetrust-banner-sdk | 0.001 |
Reduce unused rules from stylesheets and defer CSS not used for above-the-fold content to decrease bytes consumed by network activity. Learn how to reduce unused CSS.
Performance issues directly impact user engagement and conversion rates.
| URL | Transfer Size | Est Savings |
|---|---|---|
| www.edx.org/_next/static/css/c1a0daa9433fa738.css | 307.5 KiB | 305.5 KiB |
| www.edx.org/_next/static/css/8d3c32105a4dd1a6.css | 72.3 KiB | 72.2 KiB |
| www.edx.org/_next/static/css/e5fec6745b51671e.css | 13.9 KiB | 13.9 KiB |
Reduce unused JavaScript and defer loading scripts until they are required to decrease bytes consumed by network activity. Learn how to reduce unused JavaScript.
Multi-megabyte JavaScript bundles delay every interactive feature on the page.
This is the Lighthouse audit fired when too much JS is shipped relative to what executes. The fix isn't a config flag — it requires bundle analysis (webpack-bundle-analyzer, rollup-plugin-visualizer), splitting routes into chunks, lazy-loading off-screen components, and removing unused dependencies. Fundamentally different from minification: minifying reduces byte count, this reduces what's downloaded at all.
Source: Google web.dev / Lighthouse
Consider reducing the time spent parsing, compiling, and executing JS. You may find delivering smaller JS payloads helps with this. Learn how to reduce Javascript execution time.
Performance issues directly impact user engagement and conversion rates.
Consider reducing the time spent parsing, compiling and executing JS. You may find delivering smaller JS payloads helps with this. Learn how to minimize main-thread work
Performance issues directly impact user engagement and conversion rates.
| Category | Time Spent |
|---|---|
| Script Evaluation | 33.4 s |
| Other | 5.0 s |
| Script Parsing & Compilation | 2.4 s |
| Style & Layout | 2.1 s |
| Parse HTML & CSS | 1.2 s |
| Garbage Collection | 815 ms |
| Rendering | 422 ms |
Many navigations are performed by going back to a previous page, or forwards again. The back/forward cache (bfcache) can speed up these return navigations. Learn more about the bfcache
Performance issues directly impact user engagement and conversion rates.
| Failure reason | Failure type |
|---|---|
| Pages with cache-control:no-store header cannot enter back/forward cache. | Actionable |
| Pages whose main resource has cache-control:no-store cannot enter back/forward cache. | Not actionable |
| Back/forward cache is disabled because some JavaScript network request received resource with Cache-Control: no-store header. | Not actionable |
Large network payloads cost users real money and are highly correlated with long load times. Learn how to reduce payload sizes.
Performance issues directly impact user engagement and conversion rates.
More information about the performance of your application. These numbers don't directly affect the Performance score.
These checks highlight opportunities to improve the accessibility of your web app. Automatic detection can only detect a subset of issues and does not guarantee the accessibility of your web app, so manual testing is also encouraged.
Low-contrast text is difficult or impossible for many users to read. Learn how to provide sufficient color contrast.
Performance issues directly impact user engagement and conversion rates.
| Failing Elements |
|---|
Decline Optional Cookies div.ot-sdk-row > div#onetrust-button-group-parent > div#onetrust-button-group > button#onetrust-reject-all-handler |
Accept All Cookies div.ot-sdk-row > div#onetrust-button-group-parent > div#onetrust-button-group > button#onetrust-accept-btn-handler |
These are opportunities to improve the legibility of your content.
Properly ordered headings that do not skip levels convey the semantic structure of the page, making it easier to navigate and understand when using assistive technologies. Learn more about heading order.
Performance issues directly impact user engagement and conversion rates.
| Failing Elements |
|---|
Computer Science div.text-base > div.flex > a.no-underline > h4.elm-h5 |
These are opportunities to improve keyboard navigation in your application.
Visible text labels that do not match the accessible name can result in a confusing experience for screen reader users. Learn more about accessible names.
Performance issues directly impact user engagement and conversion rates.
| Failing Elements |
|---|
Cookie Policy div#onetrust-group-container > div#onetrust-policy > div#onetrust-policy-text > a.ot-cookie-policy-link |
Errors logged to the console indicate unresolved problems. They can come from network request failures and other browser concerns. Learn more about this errors in console diagnostic audit
Performance issues directly impact user engagement and conversion rates.
| Source | Description |
|---|---|
Failed to load resource: the server responded with a status of 401 () | |
Failed to load resource: the server responded with a status of 401 () |
Source maps translate minified code to the original source code. This helps developers debug in production. In addition, Lighthouse is able to provide further insights. Consider deploying source maps to take advantage of these benefits. Learn more about source maps.
Performance issues directly impact user engagement and conversion rates.
These checks ensure that your page is following basic search engine optimization advice. There are many additional factors Lighthouse does not score here that may affect your search ranking, including performance on Core Web Vitals. Learn more about Google Search Essentials.
Descriptive link text helps search engines understand your content. Learn how to make links more accessible.
Performance issues directly impact user engagement and conversion rates.
| Link destination | Link Text |
|---|---|
| www.edx.org/courses-and-programs-promo | Learn more |
| www.edx.org/courses-and-programs-promo | Learn more |
| www.edx.org/courses-and-programs-promo | Learn more |
| www.edx.org/courses-and-programs-promo | Learn more |
Format your HTML in a way that enables crawlers to better understand your app’s content.
Industry-standard audits powered by Google Lighthouse. — Desktop
Key metrics that affect user experience. — Desktop
First Contentful Paint First Contentful Paint — how long until the browser renders the first piece of content. Under 1.8s is good.
1.33 s
Largest Contentful Paint Largest Contentful Paint — how long until the largest visible element loads. Under 2.5s is good.
10.12 s
Total Blocking Time Total Blocking Time — total time the main thread was blocked, preventing user input. Under 200ms is good.
4.93 s
Cumulative Layout Shift Cumulative Layout Shift — measures visual stability. How much the page layout shifts during loading. Under 0.1 is good.
0.048
Speed Index Speed Index — how quickly content is visually displayed during load. Under 3.4s is good.
6.73 s
Time to Interactive Time to Interactive — how long until the page is fully interactive and responds to user input. Under 3.8s is good.
11.03 s
Audit breakdown by category with detailed findings.
Remove large, duplicate JavaScript modules from bundles to reduce unnecessary bytes consumed by network activity.
Performance issues directly impact user engagement and conversion rates.
Polyfills and transforms enable older browsers to use new JavaScript features. However, many aren't necessary for modern browsers. Consider modifying your JavaScript build process to not transpile Baseline features, unless you know you must support older browsers. Learn why most sites can deploy ES6+ code without transpiling
Shipping ES5 transpiled code to modern browsers wastes bytes — every user with an evergreen browser pays for compatibility you don't need.
Most users today run browsers that natively support ES6+, async/await, optional chaining, and the rest of modern JavaScript. Transpiling to ES5 'just in case' adds 20-40% to your bundle for no benefit. Configure your build to target a modern browserslist, or ship a differential bundle pair (modern + legacy) with the module/nomodule pattern.
Source: Google web.dev / Lighthouse
3rd party code can significantly impact load performance. Reduce and defer loading of 3rd party code to prioritize your page's content.
Performance issues directly impact user engagement and conversion rates.
A long cache lifetime can speed up repeat visits to your page. Learn more about caching.
Performance issues directly impact user engagement and conversion rates.
| Request | Cache TTL | Transfer Size |
|---|---|---|
| www.edx.org/api/auto-block?id=fa169e97-be64-4cc1-bad3-9534590f9a30 | 3600.0 s | 93.5 KiB |
| /_next/image?url=https%3A%2F%2Fimages.cdn.edx.org%2Fattac... | 300.0 s | 67.3 KiB |
| beam.edx.org/scripttemplates/202407.2.0/otBannerSdk.js | 86400.0 s | 110.5 KiB |
| www.edx.org/beam.js | 0.0 ms | 35.1 KiB |
| /_next/image?url=https%3A%2F%2Fimages.cdn.edx.org%2Fattac... | 300.0 s | 25.3 KiB |
| /_next/image?url=https%3A%2F%2Fimages.cdn.edx.org%2Fattac... | 300.0 s | 20.3 KiB |
| www.edx.org/favicon.ico | 300.0 s | 10.1 KiB |
| sonic-ui.highereducation.com/latest/ucl.adapter.js | 86400.0 s | 21.2 KiB |
| beam.edx.org/scripttemplates/otSDKStub.js | 86400.0 s | 9.3 KiB |
| www.edx.org/trademark-logos/edx-by-2u-white.svg | 10.0 s | 2.8 KiB |
| www.edx.org/trademark-logos/edx-logo-elm.svg | 10.0 s | 2.6 KiB |
| sonic-ui.highereducation.com/latest/ucl.publisher.js | 86400.0 s | 4.7 KiB |
| www.edx.org/_next/image?url=%2Ficons%2Fai-icon.png&w=48&q=75 | 300.0 s | 1.8 KiB |
| /_r?sdk=web2.86.4&branch_key=key_live_kpxBY7wsvq7tp8eu5TH... | 0.0 ms | 665 B |
| beam.edx.org/logos/static/ot_close.svg | 86400.0 s | 1.1 KiB |
Your first network request is the most important. Reduce its latency by avoiding redirects, ensuring a fast server response, and enabling text compression.
Performance issues directly impact user engagement and conversion rates.
A forced reflow occurs when JavaScript queries geometric properties (such as offsetWidth) after styles have been invalidated by a change to the DOM state. This can result in poor performance. Learn more about forced reflows and possible mitigations.
Performance issues directly impact user engagement and conversion rates.
Each subpart has specific improvement strategies. Ideally, most of the LCP time should be spent on loading the resources, not within delays.
Performance issues directly impact user engagement and conversion rates.
Optimize LCP by making the LCP image discoverable from the HTML immediately, and avoiding lazy-loading
Performance issues directly impact user engagement and conversion rates.
Avoid chaining critical requests by reducing the length of chains, reducing the download size of resources, or deferring the download of unnecessary resources to improve page load.
Performance issues directly impact user engagement and conversion rates.
Reducing the download time of images can improve the perceived load time of the page and LCP. Learn more about optimizing image size
Performance issues directly impact user engagement and conversion rates.
| URL | Resource Size | Est Savings | |
|---|---|---|---|
div.embla__container > div.embla__slide > div.relative > img.optanon-category-C0001 div.embla__container > div.embla__slide > div.relative > img.optanon-category-C0001 | /_next/image?url=https%3A%2F%2Fimages.cdn.edx.org%2Fattac... | 66.1 KiB | 24.3 KiB |
Undergraduate Certificate in Artificial Intelligence a.w-full > div.text-card-foreground > div.flex > img.optanon-category-C0001 | /_next/image?url=https%3A%2F%2Fprod-discovery.edx-cdn.org... | 23.2 KiB | 16.3 KiB |
div.container > div.lg:ml-auto > div.w-full > img.optanon-category-C0001 div.container > div.lg:ml-auto > div.w-full > img.optanon-category-C0001 | /_next/image?url=https%3A%2F%2Fimages.cdn.edx.org%2Fattac... | 24.1 KiB | 13.8 KiB |
MBA Essentials a.w-full > div.text-card-foreground > div.flex > img.optanon-category-C0001 | /_next/image?url=https%3A%2F%2Fprod-discovery.edx-cdn.org... | 16.9 KiB | 9.6 KiB |
AI for Everyone: Master the Basics a.w-full > div.text-card-foreground > div.flex > img.optanon-category-C0001 | /_next/image?url=https%3A%2F%2Fprod-discovery.edx-cdn.org... | 16.3 KiB | 8.3 KiB |
Supply Chain Fundamentals. a.w-full > div.text-card-foreground > div.flex > img.optanon-category-C0001 | /_next/image?url=https%3A%2F%2Fprod-discovery.edx-cdn.org... | 15.3 KiB | 8.3 KiB |
Why Data Analytics Matters a.h-full > div.text-card-foreground > div.flex > img.optanon-category-C0001 | /_next/image?url=https%3A%2F%2Fprod-discovery.edx-cdn.org... | 15.1 KiB | 7.2 KiB |
Supply Chain Design. a.h-full > div.text-card-foreground > div.flex > img.optanon-category-C0001 | /_next/image?url=https%3A%2F%2Fprod-discovery.edx-cdn.org... | 13.3 KiB | 5.4 KiB |
AI Developer a.w-full > div.text-card-foreground > div.flex > img.optanon-category-C0001 | /_next/image?url=https%3A%2F%2Fprod-discovery.edx-cdn.org... | 12.3 KiB | 5.0 KiB |
Artificial Intelligence Programme a.w-full > div.text-card-foreground > div.flex > img.optanon-category-C0001 | /_next/image?url=https%3A%2F%2Fprod-discovery.edx-cdn.org... | 11.6 KiB | 4.5 KiB |
Requests are blocking the page's initial render, which may delay LCP. Deferring or inlining can move these network requests out of the critical path.
Performance issues directly impact user engagement and conversion rates.
These insights are also available in the Chrome DevTools Performance Panel - record a trace to view more detailed information.
The maximum potential First Input Delay that your users could experience is the duration of the longest task. Learn more about the Maximum Potential First Input Delay metric.
Performance issues directly impact user engagement and conversion rates.
Redirects introduce additional delays before the page can be loaded. Learn how to avoid page redirects.
Performance issues directly impact user engagement and conversion rates.
| URL | Time Spent |
|---|---|
| edx.org/ | 205 ms |
| www.edx.org/ | 0.0 ms |
Time to Interactive is the amount of time it takes for the page to become fully interactive. Learn more about the Time to Interactive metric.
Performance issues directly impact user engagement and conversion rates.
Reduce unused rules from stylesheets and defer CSS not used for above-the-fold content to decrease bytes consumed by network activity. Learn how to reduce unused CSS.
Performance issues directly impact user engagement and conversion rates.
| URL | Transfer Size | Est Savings |
|---|---|---|
| www.edx.org/_next/static/css/c1a0daa9433fa738.css | 307.5 KiB | 304.5 KiB |
| www.edx.org/_next/static/css/8d3c32105a4dd1a6.css | 72.3 KiB | 72.2 KiB |
| www.edx.org/_next/static/css/e5fec6745b51671e.css | 13.9 KiB | 13.9 KiB |
Reduce unused JavaScript and defer loading scripts until they are required to decrease bytes consumed by network activity. Learn how to reduce unused JavaScript.
Multi-megabyte JavaScript bundles delay every interactive feature on the page.
This is the Lighthouse audit fired when too much JS is shipped relative to what executes. The fix isn't a config flag — it requires bundle analysis (webpack-bundle-analyzer, rollup-plugin-visualizer), splitting routes into chunks, lazy-loading off-screen components, and removing unused dependencies. Fundamentally different from minification: minifying reduces byte count, this reduces what's downloaded at all.
Source: Google web.dev / Lighthouse
Consider reducing the time spent parsing, compiling, and executing JS. You may find delivering smaller JS payloads helps with this. Learn how to reduce Javascript execution time.
Performance issues directly impact user engagement and conversion rates.
Consider reducing the time spent parsing, compiling and executing JS. You may find delivering smaller JS payloads helps with this. Learn how to minimize main-thread work
Performance issues directly impact user engagement and conversion rates.
| Category | Time Spent |
|---|---|
| Script Evaluation | 9.2 s |
| Other | 1.2 s |
| Style & Layout | 705 ms |
| Script Parsing & Compilation | 671 ms |
| Parse HTML & CSS | 294 ms |
| Garbage Collection | 220 ms |
| Rendering | 119 ms |
Many navigations are performed by going back to a previous page, or forwards again. The back/forward cache (bfcache) can speed up these return navigations. Learn more about the bfcache
Performance issues directly impact user engagement and conversion rates.
| Failure reason | Failure type |
|---|---|
| Pages with cache-control:no-store header cannot enter back/forward cache. | Actionable |
| Pages whose main resource has cache-control:no-store cannot enter back/forward cache. | Not actionable |
| Back/forward cache is disabled because some JavaScript network request received resource with Cache-Control: no-store header. | Not actionable |
Large network payloads cost users real money and are highly correlated with long load times. Learn how to reduce payload sizes.
Performance issues directly impact user engagement and conversion rates.
More information about the performance of your application. These numbers don't directly affect the Performance score.
These checks highlight opportunities to improve the accessibility of your web app. Automatic detection can only detect a subset of issues and does not guarantee the accessibility of your web app, so manual testing is also encouraged.
Low-contrast text is difficult or impossible for many users to read. Learn how to provide sufficient color contrast.
Performance issues directly impact user engagement and conversion rates.
| Failing Elements |
|---|
Decline Optional Cookies div.ot-sdk-row > div#onetrust-button-group-parent > div#onetrust-button-group > button#onetrust-reject-all-handler |
Accept All Cookies div.ot-sdk-row > div#onetrust-button-group-parent > div#onetrust-button-group > button#onetrust-accept-btn-handler |
These are opportunities to improve the legibility of your content.
Properly ordered headings that do not skip levels convey the semantic structure of the page, making it easier to navigate and understand when using assistive technologies. Learn more about heading order.
Performance issues directly impact user engagement and conversion rates.
| Failing Elements |
|---|
Computer Science div.text-base > div.flex > a.no-underline > h4.elm-h5 |
These are opportunities to improve keyboard navigation in your application.
Visible text labels that do not match the accessible name can result in a confusing experience for screen reader users. Learn more about accessible names.
Performance issues directly impact user engagement and conversion rates.
| Failing Elements |
|---|
Cookie Policy div#onetrust-group-container > div#onetrust-policy > div#onetrust-policy-text > a.ot-cookie-policy-link |
Errors logged to the console indicate unresolved problems. They can come from network request failures and other browser concerns. Learn more about this errors in console diagnostic audit
Performance issues directly impact user engagement and conversion rates.
| Source | Description |
|---|---|
Failed to load resource: the server responded with a status of 401 () | |
Failed to load resource: the server responded with a status of 401 () |
Source maps translate minified code to the original source code. This helps developers debug in production. In addition, Lighthouse is able to provide further insights. Consider deploying source maps to take advantage of these benefits. Learn more about source maps.
Performance issues directly impact user engagement and conversion rates.
These checks ensure that your page is following basic search engine optimization advice. There are many additional factors Lighthouse does not score here that may affect your search ranking, including performance on Core Web Vitals. Learn more about Google Search Essentials.
Descriptive link text helps search engines understand your content. Learn how to make links more accessible.
Performance issues directly impact user engagement and conversion rates.
| Link destination | Link Text |
|---|---|
| www.edx.org/courses-and-programs-promo | Learn more |
| www.edx.org/courses-and-programs-promo | Learn more |
| www.edx.org/courses-and-programs-promo | Learn more |
| www.edx.org/courses-and-programs-promo | Learn more |
Format your HTML in a way that enables crawlers to better understand your app’s content.
Send Feedback