Spain · Madrid Completed: Apr 7, 2026 20:07 UTC
Mobile 375 × 812

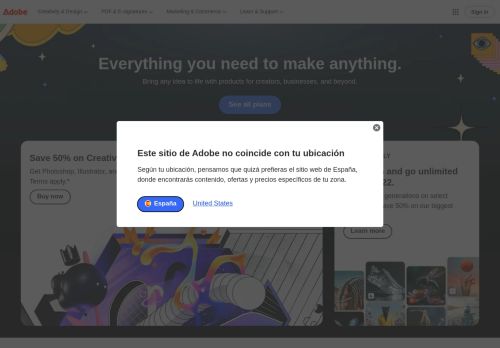
Desktop 1440 × 900
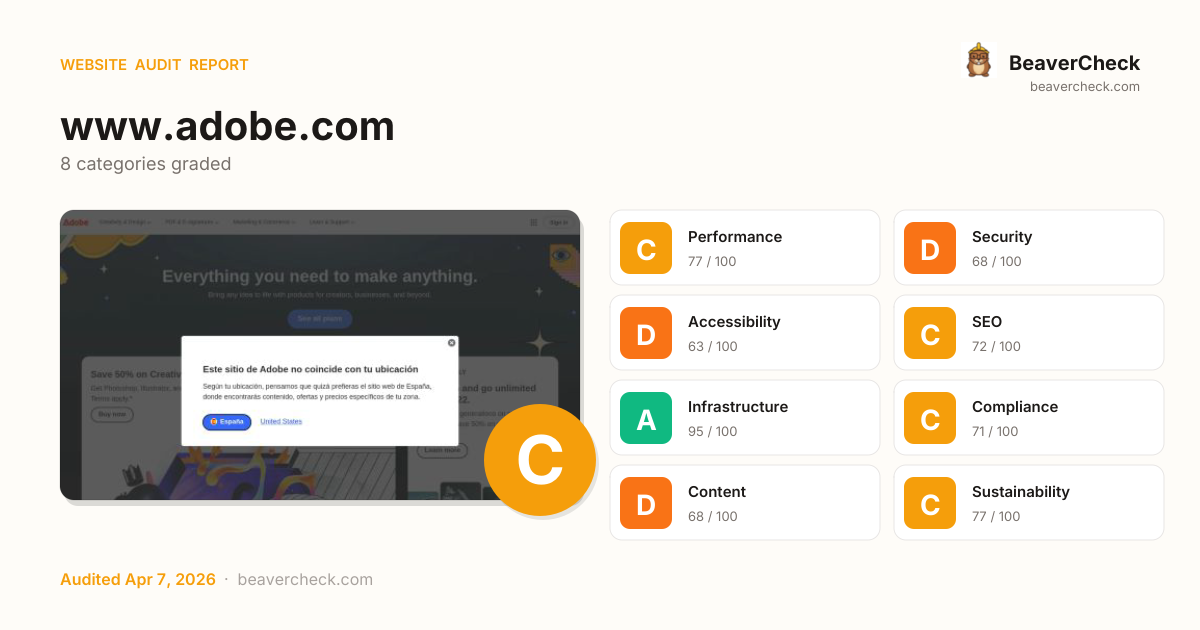
Score: 73 / 100
Based on 8 categories, 0 sections
The overall score is a weighted average of individual category scores. Categories with more impact on user experience and security carry more weight.
Weights reflect general web best practices. Individual needs may differ.
Content-Security-Policy header is missing
No Content-Security-Policy header found
Page weighs 15.3 MB (3.9 MB transferred)
2 image(s) missing alt attribute
No <main> landmark found
[](https://beavercheck.com/results/e6ca5c06-6a08-806a-c20c-df0f41b7a798)<a href="https://beavercheck.com/results/e6ca5c06-6a08-806a-c20c-df0f41b7a798"><img src="https://beavercheck.com/badge?url=https%3A%2F%2Fwww.adobe.com" alt="BeaverCheck Score"></a>https://beavercheck.com/badge?url=https%3A%2F%2Fwww.adobe.comThis badge auto-updates with your latest scan result.
Thanks for your feedback!
Industry-standard audits powered by Google Lighthouse.
Key metrics that affect user experience.
First Contentful Paint First Contentful Paint — how long until the browser renders the first piece of content. Under 1.8s is good.
1.34 s
Largest Contentful Paint Largest Contentful Paint — how long until the largest visible element loads. Under 2.5s is good.
2.67 s
Total Blocking Time Total Blocking Time — total time the main thread was blocked, preventing user input. Under 200ms is good.
206 ms
Cumulative Layout Shift Cumulative Layout Shift — measures visual stability. How much the page layout shifts during loading. Under 0.1 is good.
0.000
Speed Index Speed Index — how quickly content is visually displayed during load. Under 3.4s is good.
2.32 s
Time to Interactive Time to Interactive — how long until the page is fully interactive and responds to user input. Under 3.8s is good.
9.31 s
Audit breakdown by category with detailed findings.
Remove large, duplicate JavaScript modules from bundles to reduce unnecessary bytes consumed by network activity.
Polyfills and transforms enable older browsers to use new JavaScript features. However, many aren't necessary for modern browsers. Consider modifying your JavaScript build process to not transpile Baseline features, unless you know you must support older browsers. Learn why most sites can deploy ES6+ code without transpiling
3rd party code can significantly impact load performance. Reduce and defer loading of 3rd party code to prioritize your page's content.
A long cache lifetime can speed up repeat visits to your page. Learn more about caching.
Optimize LCP by making the LCP image discoverable from the HTML immediately, and avoiding lazy-loading
These insights are also available in the Chrome DevTools Performance Panel - record a trace to view more detailed information.
Time to Interactive is the amount of time it takes for the page to become fully interactive. Learn more about the Time to Interactive metric.
The maximum potential First Input Delay that your users could experience is the duration of the longest task. Learn more about the Maximum Potential First Input Delay metric.
Minifying JavaScript files can reduce payload sizes and script parse time. Learn how to minify JavaScript.
| URL | Transfer Size | Est Savings |
|---|---|---|
| www.adobe.com/libs/utils/utils.js | 23.2 KiB | 4.6 KiB |
| www.adobe.com/libs/blocks/global-navigation/global-navigation.js | 16.5 KiB | 4.1 KiB |
| www.adobe.com/libs/blocks/merch/merch.js | 14.8 KiB | 3.7 KiB |
| www.adobe.com/libs/features/personalization/personalization.js | 14.8 KiB | 2.9 KiB |
| www.adobe.com/libs/blocks/global-navigation/utilities/utilities.js | 11.6 KiB | 2.6 KiB |
Consider reducing the time spent parsing, compiling, and executing JS. You may find delivering smaller JS payloads helps with this. Learn how to reduce Javascript execution time.
| URL | Total CPU Time | Script Evaluation | Script Parse |
|---|---|---|---|
| www.adobe.com/ | 1.4 s | 32 ms | 0.5 ms |
| Unattributable | 1.1 s | 301 ms | 0.0 ms |
| www.adobe.com/marketingtech/d4d114c60e50/a0e989131fd5/launch-5dd5dd2177e6.min.js | 329 ms | 260 ms | 56 ms |
| www.adobe.com/libs/blocks/global-navigation/utilities/utilities.js | 326 ms | 231 ms | 0.2 ms |
| client.messaging.adobe.com/latest/AdobeMessagingClient.js | 172 ms | 125 ms | 17 ms |
| commerce.adobe.com/store/iframe/preload-optimized.html | 153 ms | 55 ms | 29 ms |
| www.adobe.com/akam/13/5f70ebe0 | 151 ms | 142 ms | 3.3 ms |
| www.adobe.com/libs/utils/utils.js | 94 ms | 51 ms | 6.2 ms |
| www.adobe.com/libs/utils/decorate.js | 93 ms | 0.0 ms | 2.0 ms |
| www.adobe.com/upp/blocks/homepage-brick/homepage-brick.js | 70 ms | 15 ms | 1.1 ms |
| www.adobe.com/libs/blocks/fragment/fragment.js | 65 ms | 54 ms | 0.1 ms |
| www.adobe.com/mas/libs/commerce.js | 56 ms | 42 ms | 0.4 ms |
| s2.go-mpulse.net/boomerang/MXSSB-A58LJ-RJPHN-5VBV8-JQ3FW | 51 ms | 32 ms | 15 ms |
Consider reducing the time spent parsing, compiling and executing JS. You may find delivering smaller JS payloads helps with this. Learn how to minimize main-thread work
| Category | Time Spent |
|---|---|
| Script Evaluation | 1.6 s |
| Other | 1.3 s |
| Style & Layout | 1.2 s |
| Script Parsing & Compilation | 169 ms |
| Parse HTML & CSS | 138 ms |
| Garbage Collection | 97 ms |
| Rendering | 61 ms |
Many navigations are performed by going back to a previous page, or forwards again. The back/forward cache (bfcache) can speed up these return navigations. Learn more about the bfcache
| Failure reason | Failure type |
|---|---|
| The page has an unload handler in a sub frame. | Actionable |
Reduce unused JavaScript and defer loading scripts until they are required to decrease bytes consumed by network activity. Learn how to reduce unused JavaScript.
| URL | Transfer Size | Est Savings |
|---|---|---|
| www.adobe.com/marketingtech/d4d114c60e50/a0e989131fd5/launch-5dd5dd2177e6.min.js | 136.5 KiB | 79.3 KiB |
| s2.go-mpulse.net/boomerang/MXSSB-A58LJ-RJPHN-5VBV8-JQ3FW | 56.1 KiB | 36.5 KiB |
| client.messaging.adobe.com/latest/AdobeMessagingClient.js | 37.0 KiB | 20.3 KiB |
Large network payloads cost users real money and are highly correlated with long load times. Learn how to reduce payload sizes.
Set an explicit width and height on image elements to reduce layout shifts and improve CLS. Learn how to set image dimensions
| URL | |
|---|---|
Adobe, Inc. div.feds-brand-container > a.feds-brand > span.feds-brand-image > img | www.adobe.com/federal/assets/svgs/adobe-logo.svg |
More information about the performance of your application. These numbers don't directly affect the Performance score.
These checks highlight opportunities to improve the accessibility of your web app. Automatic detection can only detect a subset of issues and does not guarantee the accessibility of your web app, so manual testing is also encouraged.
Deprecated APIs will eventually be removed from the browser. Learn more about deprecated APIs.
| Deprecation / Warning | Source |
|---|---|
| Unload event listeners are deprecated and will be removed. | s2.go-mpulse.net/boomerang/MXSSB-A58LJ-RJPHN-5VBV8-JQ3FW line 9, col 11504 |
Errors logged to the console indicate unresolved problems. They can come from network request failures and other browser concerns. Learn more about this errors in console diagnostic audit
| Source | Description |
|---|---|
Access to fetch at 'https://cdn.cookielaw.org/consent/7a5eb705-95ed-4cc4-a11d-0cc5760e93db/7a5eb705-95ed-4cc4-a11d-0cc5760e93db.json' from origin 'https://www.adobe.com' has been blocked by CORS policy: No 'Access-Control-Allow-Origin' header is present on the requested resource. | |
Access to script at 'https://cdn.cookielaw.org/scripttemplates/otSDKStub.js' from origin 'https://www.adobe.com' has been blocked by CORS policy: No 'Access-Control-Allow-Origin' header is present on the requested resource. | |
Event | |
Failed to load resource: net::ERR_FAILED | |
Failed to load resource: net::ERR_FAILED |
Source maps translate minified code to the original source code. This helps developers debug in production. In addition, Lighthouse is able to provide further insights. Consider deploying source maps to take advantage of these benefits. Learn more about source maps.
These checks ensure that your page is following basic search engine optimization advice. There are many additional factors Lighthouse does not score here that may affect your search ranking, including performance on Core Web Vitals. Learn more about Google Search Essentials.
Descriptive link text helps search engines understand your content. Learn how to make links more accessible.
| Link destination | Link Text |
|---|---|
| business.adobe.com/ | Learn more |
| www.adobe.com/products/firefly.html | Learn more |
Format your HTML in a way that enables crawlers to better understand your app’s content.
If your robots.txt file is malformed, crawlers may not be able to understand how you want your website to be crawled or indexed. Learn more about robots.txt.
To appear in search results, crawlers need access to your app.
Industry-standard audits powered by Google Lighthouse. — Desktop
Key metrics that affect user experience. — Desktop
First Contentful Paint First Contentful Paint — how long until the browser renders the first piece of content. Under 1.8s is good.
436 ms
Largest Contentful Paint Largest Contentful Paint — how long until the largest visible element loads. Under 2.5s is good.
1.12 s
Total Blocking Time Total Blocking Time — total time the main thread was blocked, preventing user input. Under 200ms is good.
0 ms
Cumulative Layout Shift Cumulative Layout Shift — measures visual stability. How much the page layout shifts during loading. Under 0.1 is good.
0.000
Speed Index Speed Index — how quickly content is visually displayed during load. Under 3.4s is good.
1.30 s
Time to Interactive Time to Interactive — how long until the page is fully interactive and responds to user input. Under 3.8s is good.
1.12 s
Audit breakdown by category with detailed findings.
Remove large, duplicate JavaScript modules from bundles to reduce unnecessary bytes consumed by network activity.
Polyfills and transforms enable older browsers to use new JavaScript features. However, many aren't necessary for modern browsers. Consider modifying your JavaScript build process to not transpile Baseline features, unless you know you must support older browsers. Learn why most sites can deploy ES6+ code without transpiling
3rd party code can significantly impact load performance. Reduce and defer loading of 3rd party code to prioritize your page's content.
A long cache lifetime can speed up repeat visits to your page. Learn more about caching.
Reducing the download time of images can improve the perceived load time of the page and LCP. Learn more about optimizing image size
| URL | Resource Size | Est Savings | |
|---|---|---|---|
div.background > div.desktopOnly > picture > img div.background > div.desktopOnly > picture > img | /upp-shared/media_191004308a9ddf7e72e93b1db66a55954b6b6fe... | 183.5 KiB | 175.0 KiB |
div.background > div.desktopOnly > picture > img div.background > div.desktopOnly > picture > img | /upp-shared/media_109103253402c26b30b717042bb3210471341d9... | 145.3 KiB | 69.6 KiB |
Optimize LCP by making the LCP image discoverable from the HTML immediately, and avoiding lazy-loading
These insights are also available in the Chrome DevTools Performance Panel - record a trace to view more detailed information.
Reduce unused JavaScript and defer loading scripts until they are required to decrease bytes consumed by network activity. Learn how to reduce unused JavaScript.
| URL | Transfer Size | Est Savings |
|---|---|---|
| www.adobe.com/marketingtech/d4d114c60e50/a0e989131fd5/launch-5dd5dd2177e6.min.js | 136.4 KiB | 79.3 KiB |
| s2.go-mpulse.net/boomerang/MXSSB-A58LJ-RJPHN-5VBV8-JQ3FW | 56.1 KiB | 22.8 KiB |
| client.messaging.adobe.com/latest/AdobeMessagingClient.js | 37.0 KiB | 20.3 KiB |
Many navigations are performed by going back to a previous page, or forwards again. The back/forward cache (bfcache) can speed up these return navigations. Learn more about the bfcache
| Failure reason | Failure type |
|---|---|
| The page has an unload handler in a sub frame. | Actionable |
Minifying JavaScript files can reduce payload sizes and script parse time. Learn how to minify JavaScript.
| URL | Transfer Size | Est Savings |
|---|---|---|
| www.adobe.com/libs/utils/utils.js | 23.2 KiB | 4.6 KiB |
| www.adobe.com/libs/blocks/global-navigation/global-navigation.js | 16.5 KiB | 4.1 KiB |
| www.adobe.com/libs/blocks/merch/merch.js | 14.8 KiB | 3.7 KiB |
| www.adobe.com/libs/features/personalization/personalization.js | 14.8 KiB | 2.9 KiB |
| www.adobe.com/libs/blocks/global-navigation/utilities/utilities.js | 11.6 KiB | 2.6 KiB |
Large network payloads cost users real money and are highly correlated with long load times. Learn how to reduce payload sizes.
Set an explicit width and height on image elements to reduce layout shifts and improve CLS. Learn how to set image dimensions
| URL | |
|---|---|
Adobe, Inc. div.feds-brand-container > a.feds-brand > span.feds-brand-image > img | www.adobe.com/federal/assets/svgs/adobe-logo.svg |
More information about the performance of your application. These numbers don't directly affect the Performance score.
These checks highlight opportunities to improve the accessibility of your web app. Automatic detection can only detect a subset of issues and does not guarantee the accessibility of your web app, so manual testing is also encouraged.
Deprecated APIs will eventually be removed from the browser. Learn more about deprecated APIs.
| Deprecation / Warning | Source |
|---|---|
| Unload event listeners are deprecated and will be removed. | s2.go-mpulse.net/boomerang/MXSSB-A58LJ-RJPHN-5VBV8-JQ3FW line 9, col 11504 |
Errors logged to the console indicate unresolved problems. They can come from network request failures and other browser concerns. Learn more about this errors in console diagnostic audit
| Source | Description |
|---|---|
Access to fetch at 'https://cdn.cookielaw.org/consent/7a5eb705-95ed-4cc4-a11d-0cc5760e93db/7a5eb705-95ed-4cc4-a11d-0cc5760e93db.json' from origin 'https://www.adobe.com' has been blocked by CORS policy: No 'Access-Control-Allow-Origin' header is present on the requested resource. | |
Access to script at 'https://cdn.cookielaw.org/scripttemplates/otSDKStub.js' from origin 'https://www.adobe.com' has been blocked by CORS policy: No 'Access-Control-Allow-Origin' header is present on the requested resource. | |
s2.go-mpulse.net/boomerang/MXSSB-A58LJ-RJPHN-5VBV8-JQ3FW line 9, col 28393 | Connecting to 'https://684dd326.akstat.io/' violates the following Content Security Policy directive: "connect-src 'self' p.typekit.net performance.typekit.net *.forter.com d1wix2gc2cgqis.cloudfront.net *.go-mpulse.net *.fptls.com api.fpjs.io *.api.fpjs.io". The action has been blocked. |
Event | |
Failed to load resource: net::ERR_FAILED | |
Failed to load resource: net::ERR_FAILED |
Issues logged to the `Issues` panel in Chrome Devtools indicate unresolved problems. They can come from network request failures, insufficient security controls, and other browser concerns. Open up the Issues panel in Chrome DevTools for more details on each issue.
| Issue type |
|---|
| Content security policy |
Source maps translate minified code to the original source code. This helps developers debug in production. In addition, Lighthouse is able to provide further insights. Consider deploying source maps to take advantage of these benefits. Learn more about source maps.
These checks ensure that your page is following basic search engine optimization advice. There are many additional factors Lighthouse does not score here that may affect your search ranking, including performance on Core Web Vitals. Learn more about Google Search Essentials.
Descriptive link text helps search engines understand your content. Learn how to make links more accessible.
| Link destination | Link Text |
|---|---|
| business.adobe.com/ | Learn more |
Format your HTML in a way that enables crawlers to better understand your app’s content.
If your robots.txt file is malformed, crawlers may not be able to understand how you want your website to be crawled or indexed. Learn more about robots.txt.
To appear in search results, crawlers need access to your app.
Send Feedback