Singapore · Singapore Completed: Apr 7, 2026 20:13 UTC
Mobile 375 × 812

Desktop 1440 × 900

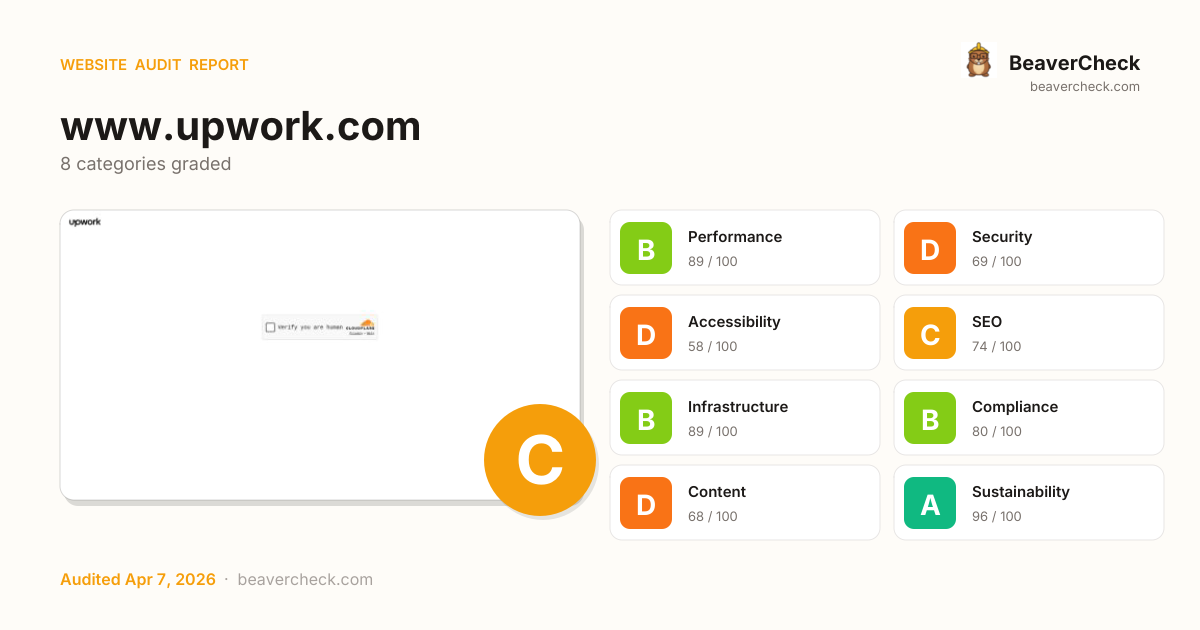
Score: 76 / 100
Based on 8 categories, 0 sections
The overall score is a weighted average of individual category scores. Categories with more impact on user experience and security carry more weight.
Weights reflect general web best practices. Individual needs may differ.
Content-Security-Policy header is missing
No Content-Security-Policy header found
No H1 heading found
Certificate expires soon (29 days remaining)
Cookie '__cf_bm' has no SameSite attribute
[](https://beavercheck.com/results/e6e728e8-c331-f46a-4004-b1508a9bec19)<a href="https://beavercheck.com/results/e6e728e8-c331-f46a-4004-b1508a9bec19"><img src="https://beavercheck.com/badge?url=https%3A%2F%2Fwww.upwork.com" alt="BeaverCheck Score"></a>https://beavercheck.com/badge?url=https%3A%2F%2Fwww.upwork.comThis badge auto-updates with your latest scan result.
Thanks for your feedback!
Industry-standard audits powered by Google Lighthouse.
Key metrics that affect user experience.
First Contentful Paint First Contentful Paint — how long until the browser renders the first piece of content. Under 1.8s is good.
1.91 s
Largest Contentful Paint Largest Contentful Paint — how long until the largest visible element loads. Under 2.5s is good.
1.91 s
Total Blocking Time Total Blocking Time — total time the main thread was blocked, preventing user input. Under 200ms is good.
1.11 s
Cumulative Layout Shift Cumulative Layout Shift — measures visual stability. How much the page layout shifts during loading. Under 0.1 is good.
0.000
Speed Index Speed Index — how quickly content is visually displayed during load. Under 3.4s is good.
1.91 s
Time to Interactive Time to Interactive — how long until the page is fully interactive and responds to user input. Under 3.8s is good.
4.22 s
Audit breakdown by category with detailed findings.
Remove large, duplicate JavaScript modules from bundles to reduce unnecessary bytes consumed by network activity.
Polyfills and transforms enable older browsers to use new JavaScript features. However, many aren't necessary for modern browsers. Consider modifying your JavaScript build process to not transpile Baseline features, unless you know you must support older browsers. Learn why most sites can deploy ES6+ code without transpiling
3rd party code can significantly impact load performance. Reduce and defer loading of 3rd party code to prioritize your page's content.
Your first network request is the most important. Reduce its latency by avoiding redirects, ensuring a fast server response, and enabling text compression.
Avoid chaining critical requests by reducing the length of chains, reducing the download size of resources, or deferring the download of unnecessary resources to improve page load.
A long cache lifetime can speed up repeat visits to your page. Learn more about caching.
| Request | Cache TTL | Transfer Size |
|---|---|---|
| challenges.cloudflare.com/cdn-cgi/challenge-platform/h/b/cmg/1 | 0.0 ms | 208 B |
These insights are also available in the Chrome DevTools Performance Panel - record a trace to view more detailed information.
Redirects introduce additional delays before the page can be loaded. Learn how to avoid page redirects.
| URL | Time Spent |
|---|---|
| www.upwork.com/ | 762 ms |
| www.upwork.com/ | 0.0 ms |
The maximum potential First Input Delay that your users could experience is the duration of the longest task. Learn more about the Maximum Potential First Input Delay metric.
Time to Interactive is the amount of time it takes for the page to become fully interactive. Learn more about the Time to Interactive metric.
Consider reducing the time spent parsing, compiling, and executing JS. You may find delivering smaller JS payloads helps with this. Learn how to reduce Javascript execution time.
| URL | Total CPU Time | Script Evaluation | Script Parse |
|---|---|---|---|
| /cdn-cgi/challenge-platform/h/b/orchestrate/chl_page/v1?r... | 1.5 s | 1.4 s | 28 ms |
| Unattributable | 330 ms | 12 ms | 0.0 ms |
| www.upwork.com/ | 198 ms | 30 ms | 5.2 ms |
Consider reducing the time spent parsing, compiling and executing JS. You may find delivering smaller JS payloads helps with this. Learn how to minimize main-thread work
| Category | Time Spent |
|---|---|
| Script Evaluation | 1.5 s |
| Other | 341 ms |
| Style & Layout | 68 ms |
| Parse HTML & CSS | 57 ms |
| Garbage Collection | 51 ms |
| Script Parsing & Compilation | 41 ms |
| Rendering | 8.6 ms |
Many navigations are performed by going back to a previous page, or forwards again. The back/forward cache (bfcache) can speed up these return navigations. Learn more about the bfcache
| Failure reason | Failure type |
|---|---|
| Pages that use WebXR are not currently eligible for back/forward cache. | Actionable |
| Only pages with a status code of 2XX can be cached. | Not actionable |
Reduce unused rules from stylesheets and defer CSS not used for above-the-fold content to decrease bytes consumed by network activity. Learn how to reduce unused CSS.
| URL | Transfer Size | Est Savings |
|---|---|---|
| @font-face { font-family: 'Neue Montreal'; src: url('data:font/woff2;base64,d09GMgABAAAAAkcgABI… | 96.5 KiB | 96.5 KiB |
| [theme=air-3-0],[design-system=air-3-0],html[theme=dark]{--ws-mobile-x:var(--ws-4x);--ws-heading:.5… | 66.7 KiB | 54.4 KiB |
More information about the performance of your application. These numbers don't directly affect the Performance score.
These checks highlight opportunities to improve the accessibility of your web app. Automatic detection can only detect a subset of issues and does not guarantee the accessibility of your web app, so manual testing is also encouraged.
Users do not expect a page to refresh automatically, and doing so will move focus back to the top of the page. This may create a frustrating or confusing experience. Learn more about the refresh meta tag.
| Failing Elements |
|---|
head > meta head > meta |
These items highlight common accessibility best practices.
Errors logged to the console indicate unresolved problems. They can come from network request failures and other browser concerns. Learn more about this errors in console diagnostic audit
| Source | Description |
|---|---|
Failed to load resource: net::ERR_BLOCKED_BY_RESPONSE.NotSameOriginAfterDefaultedToSameOriginByCoep | |
Failed to load resource: the server responded with a status of 403 () |
Issues logged to the `Issues` panel in Chrome Devtools indicate unresolved problems. They can come from network request failures, insufficient security controls, and other browser concerns. Open up the Issues panel in Chrome DevTools for more details on each issue.
| Issue type |
|---|
| Blocked by cross-origin policy |
These checks ensure that your page is following basic search engine optimization advice. There are many additional factors Lighthouse does not score here that may affect your search ranking, including performance on Core Web Vitals. Learn more about Google Search Essentials.
Meta descriptions may be included in search results to concisely summarize page content. Learn more about the meta description.
Format your HTML in a way that enables crawlers to better understand your app’s content.
Pages with unsuccessful HTTP status codes may not be indexed properly. Learn more about HTTP status codes.
To appear in search results, crawlers need access to your app.
Industry-standard audits powered by Google Lighthouse. — Desktop
Key metrics that affect user experience. — Desktop
First Contentful Paint First Contentful Paint — how long until the browser renders the first piece of content. Under 1.8s is good.
446 ms
Largest Contentful Paint Largest Contentful Paint — how long until the largest visible element loads. Under 2.5s is good.
542 ms
Total Blocking Time Total Blocking Time — total time the main thread was blocked, preventing user input. Under 200ms is good.
115 ms
Cumulative Layout Shift Cumulative Layout Shift — measures visual stability. How much the page layout shifts during loading. Under 0.1 is good.
0.000
Speed Index Speed Index — how quickly content is visually displayed during load. Under 3.4s is good.
698 ms
Time to Interactive Time to Interactive — how long until the page is fully interactive and responds to user input. Under 3.8s is good.
1.03 s
Audit breakdown by category with detailed findings.
Remove large, duplicate JavaScript modules from bundles to reduce unnecessary bytes consumed by network activity.
Polyfills and transforms enable older browsers to use new JavaScript features. However, many aren't necessary for modern browsers. Consider modifying your JavaScript build process to not transpile Baseline features, unless you know you must support older browsers. Learn why most sites can deploy ES6+ code without transpiling
3rd party code can significantly impact load performance. Reduce and defer loading of 3rd party code to prioritize your page's content.
Your first network request is the most important. Reduce its latency by avoiding redirects, ensuring a fast server response, and enabling text compression.
Avoid chaining critical requests by reducing the length of chains, reducing the download size of resources, or deferring the download of unnecessary resources to improve page load.
A long cache lifetime can speed up repeat visits to your page. Learn more about caching.
| Request | Cache TTL | Transfer Size |
|---|---|---|
| /cdn-cgi/challenge-platform/h/b/d/9e8bb14f88d9f8ca/177559... | 0.0 ms | 1.4 KiB |
| challenges.cloudflare.com/cdn-cgi/challenge-platform/h/b/cmg/1 | 0.0 ms | 208 B |
These insights are also available in the Chrome DevTools Performance Panel - record a trace to view more detailed information.
Many navigations are performed by going back to a previous page, or forwards again. The back/forward cache (bfcache) can speed up these return navigations. Learn more about the bfcache
| Failure reason | Failure type |
|---|---|
| Pages that use WebXR are not currently eligible for back/forward cache. | Actionable |
| Only pages with a status code of 2XX can be cached. | Not actionable |
Reduce unused rules from stylesheets and defer CSS not used for above-the-fold content to decrease bytes consumed by network activity. Learn how to reduce unused CSS.
| URL | Transfer Size | Est Savings |
|---|---|---|
| @font-face { font-family: 'Neue Montreal'; src: url('data:font/woff2;base64,d09GMgABAAAAAkcgABI… | 96.5 KiB | 96.5 KiB |
| [theme=air-3-0],[design-system=air-3-0],html[theme=dark]{--ws-mobile-x:var(--ws-4x);--ws-heading:.5… | 66.7 KiB | 54.6 KiB |
More information about the performance of your application. These numbers don't directly affect the Performance score.
Redirects introduce additional delays before the page can be loaded. Learn how to avoid page redirects.
| URL | Time Spent |
|---|---|
| www.upwork.com/ | 211 ms |
| www.upwork.com/ | 0.0 ms |
These checks highlight opportunities to improve the accessibility of your web app. Automatic detection can only detect a subset of issues and does not guarantee the accessibility of your web app, so manual testing is also encouraged.
Users do not expect a page to refresh automatically, and doing so will move focus back to the top of the page. This may create a frustrating or confusing experience. Learn more about the refresh meta tag.
| Failing Elements |
|---|
head > meta head > meta |
These items highlight common accessibility best practices.
Errors logged to the console indicate unresolved problems. They can come from network request failures and other browser concerns. Learn more about this errors in console diagnostic audit
| Source | Description |
|---|---|
Failed to load resource: net::ERR_BLOCKED_BY_RESPONSE.NotSameOriginAfterDefaultedToSameOriginByCoep | |
Failed to load resource: the server responded with a status of 403 () |
Issues logged to the `Issues` panel in Chrome Devtools indicate unresolved problems. They can come from network request failures, insufficient security controls, and other browser concerns. Open up the Issues panel in Chrome DevTools for more details on each issue.
| Issue type |
|---|
| Blocked by cross-origin policy |
These checks ensure that your page is following basic search engine optimization advice. There are many additional factors Lighthouse does not score here that may affect your search ranking, including performance on Core Web Vitals. Learn more about Google Search Essentials.
Meta descriptions may be included in search results to concisely summarize page content. Learn more about the meta description.
Format your HTML in a way that enables crawlers to better understand your app’s content.
Pages with unsuccessful HTTP status codes may not be indexed properly. Learn more about HTTP status codes.
To appear in search results, crawlers need access to your app.
Send Feedback