Singapore · Singapore Completed: Apr 7, 2026 20:12 UTC
Mobile 375 × 812

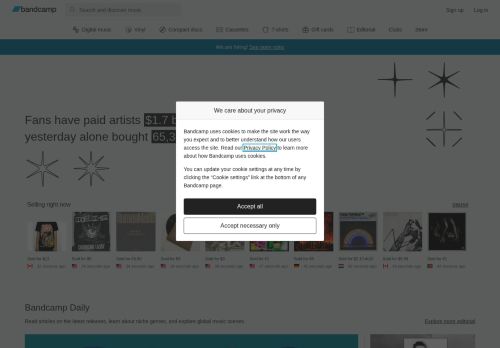
Desktop 1440 × 900
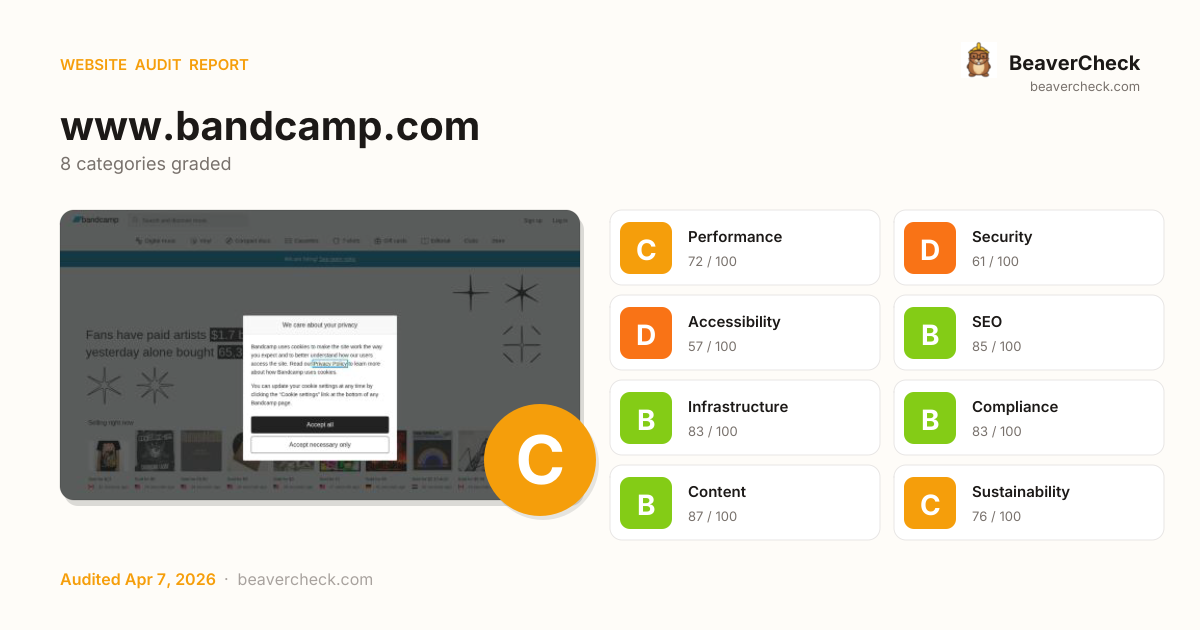
Score: 71 / 100
Based on 8 categories, 0 sections
The overall score is a weighted average of individual category scores. Categories with more impact on user experience and security carry more weight.
Weights reflect general web best practices. Individual needs may differ.
Content-Security-Policy header is missing
No Content-Security-Policy header found
Page weighs 8.6 MB (4.4 MB transferred)
1 control(s) without accessible label
1 image(s) missing alt attribute
[](https://beavercheck.com/results/eec37385-7bc8-3a5b-df58-facb197996ec)<a href="https://beavercheck.com/results/eec37385-7bc8-3a5b-df58-facb197996ec"><img src="https://beavercheck.com/badge?url=https%3A%2F%2Fwww.bandcamp.com" alt="BeaverCheck Score"></a>https://beavercheck.com/badge?url=https%3A%2F%2Fwww.bandcamp.comThis badge auto-updates with your latest scan result.
Thanks for your feedback!
Industry-standard audits powered by Google Lighthouse.
Key metrics that affect user experience.
First Contentful Paint First Contentful Paint — how long until the browser renders the first piece of content. Under 1.8s is good.
5.16 s
Largest Contentful Paint Largest Contentful Paint — how long until the largest visible element loads. Under 2.5s is good.
7.57 s
Total Blocking Time Total Blocking Time — total time the main thread was blocked, preventing user input. Under 200ms is good.
2.51 s
Cumulative Layout Shift Cumulative Layout Shift — measures visual stability. How much the page layout shifts during loading. Under 0.1 is good.
0.005
Speed Index Speed Index — how quickly content is visually displayed during load. Under 3.4s is good.
5.25 s
Time to Interactive Time to Interactive — how long until the page is fully interactive and responds to user input. Under 3.8s is good.
21.69 s
Audit breakdown by category with detailed findings.
Remove large, duplicate JavaScript modules from bundles to reduce unnecessary bytes consumed by network activity.
Polyfills and transforms enable older browsers to use new JavaScript features. However, many aren't necessary for modern browsers. Consider modifying your JavaScript build process to not transpile Baseline features, unless you know you must support older browsers. Learn why most sites can deploy ES6+ code without transpiling
3rd party code can significantly impact load performance. Reduce and defer loading of 3rd party code to prioritize your page's content.
Your first network request is the most important. Reduce its latency by avoiding redirects, ensuring a fast server response, and enabling text compression.
Reducing the download time of images can improve the perceived load time of the page and LCP. Learn more about optimizing image size
| URL | Resource Size | Est Savings | |
|---|---|---|---|
T-Shirts div.page-wrapper > ul > li > a.image-tile | /vite/homepage/client/v1/en/assets/merch-card_tshirt_2x-B... | 142.3 KiB | 102.5 KiB |
div.small-items > div.featured-editorial-item > a.g-button > img.g-image div.small-items > div.featured-editorial-item > a.g-button > img.g-image | f4.bcbits.com/img/0044155556_170.jpg | 72.4 KiB | 52.3 KiB |
div.small-items > div.featured-editorial-item > a.g-button > img.g-image div.small-items > div.featured-editorial-item > a.g-button > img.g-image | f4.bcbits.com/img/0043670458_170.jpg | 38.1 KiB | 20.4 KiB |
div.small-items > div.featured-editorial-item > a.g-button > img.g-image div.small-items > div.featured-editorial-item > a.g-button > img.g-image | f4.bcbits.com/img/0043987082_170.jpg | 29.0 KiB | 15.6 KiB |
Optimize LCP by making the LCP image discoverable from the HTML immediately, and avoiding lazy-loading
Avoid chaining critical requests by reducing the length of chains, reducing the download size of resources, or deferring the download of unnecessary resources to improve page load.
Requests are blocking the page's initial render, which may delay LCP. Deferring or inlining can move these network requests out of the critical path.
| URL | Transfer Size | Duration |
|---|---|---|
| s4.bcbits.com/vite/homepage/client/v1/en/assets/HomepageApp-DOcMBKq6.css | 48.2 KiB | 301 ms |
| /client-bundle/1/ArtistsLabelsPages_1/salesfeed_css-5828a... | 2.5 KiB | 757 ms |
A long cache lifetime can speed up repeat visits to your page. Learn more about caching.
| Request | Cache TTL | Transfer Size |
|---|---|---|
| js.stripe.com/basil/stripe.js | 120.0 s | 219.8 KiB |
| m.stripe.network/out-4.5.45.js | 300.0 s | 16.5 KiB |
| www.gstatic.com/recaptcha/api2/logo_48.png | 604800.0 s | 2.3 KiB |
Consider setting font-display to swap or optional to ensure text is consistently visible. swap can be further optimized to mitigate layout shifts with font metric overrides.
| URL | Est Savings |
|---|---|
| fonts.gstatic.com/s/roboto/v48/KFO7CnqEu92Fr1ME7kSn66aGLdTylUAMa3yUBHMdazQ.woff2 | 5.0 ms |
These insights are also available in the Chrome DevTools Performance Panel - record a trace to view more detailed information.
Redirects introduce additional delays before the page can be loaded. Learn how to avoid page redirects.
| URL | Time Spent |
|---|---|
| www.bandcamp.com/ | 981 ms |
| bandcamp.com/ | 0.0 ms |
Keep the server response time for the main document short because all other requests depend on it. Learn more about the Time to First Byte metric.
| URL | Time Spent |
|---|---|
| bandcamp.com/ | 873 ms |
Time to Interactive is the amount of time it takes for the page to become fully interactive. Learn more about the Time to Interactive metric.
The maximum potential First Input Delay that your users could experience is the duration of the longest task. Learn more about the Maximum Potential First Input Delay metric.
Reduce unused rules from stylesheets and defer CSS not used for above-the-fold content to decrease bytes consumed by network activity. Learn how to reduce unused CSS.
| URL | Transfer Size | Est Savings |
|---|---|---|
| s4.bcbits.com/vite/homepage/client/v1/en/assets/HomepageApp-DOcMBKq6.css | 48.0 KiB | 42.5 KiB |
Reduce unused JavaScript and defer loading scripts until they are required to decrease bytes consumed by network activity. Learn how to reduce unused JavaScript.
| URL | Transfer Size | Est Savings |
|---|---|---|
| www.gstatic.com/recaptcha/releases/kUYUkUlSyqkjTSMaN2w3RaOh/recaptcha__en.js | 362.6 KiB | 161.6 KiB |
| js.stripe.com/basil/stripe.js | 219.4 KiB | 159.9 KiB |
| /vite/homepage/client/v1/en/entrypoints/HomepageApp.vue_e... | 274.7 KiB | 116.5 KiB |
| www.googletagmanager.com/gtag/js?id=GT-WV86TPST&cx=c>m=4e6460 | 175.4 KiB | 68.1 KiB |
| www.googletagmanager.com/gtm.js?id=GTM-TKFS52TF | 123.2 KiB | 61.9 KiB |
Consider reducing the time spent parsing, compiling, and executing JS. You may find delivering smaller JS payloads helps with this. Learn how to reduce Javascript execution time.
| URL | Total CPU Time | Script Evaluation | Script Parse |
|---|---|---|---|
| /vite/homepage/client/v1/en/entrypoints/HomepageApp.vue_e... | 3.4 s | 3.2 s | 5.1 ms |
| Unattributable | 1.8 s | 749 ms | 0.0 ms |
| www.googletagmanager.com/gtag/js?id=GT-WV86TPST&cx=c>m=4e6460 | 564 ms | 483 ms | 73 ms |
| bandcamp.com/ | 463 ms | 8.6 ms | 0.7 ms |
| js.stripe.com/basil/stripe.js | 446 ms | 199 ms | 245 ms |
| www.gstatic.com/recaptcha/releases/kUYUkUlSyqkjTSMaN2w3RaOh/recaptcha__en.js | 408 ms | 214 ms | 121 ms |
| /client-bundle/1/ArtistsLabelsPages_1/salesfeed_js-3f3609... | 197 ms | 71 ms | 1.2 ms |
| www.googletagmanager.com/gtm.js?id=GTM-TKFS52TF | 194 ms | 146 ms | 46 ms |
| s4.bcbits.com/vite/homepage/client/v1/en/assets/HomepageApp-DOcMBKq6.css | 69 ms | 0.0 ms | 0.0 ms |
Consider reducing the time spent parsing, compiling and executing JS. You may find delivering smaller JS payloads helps with this. Learn how to minimize main-thread work
| Category | Time Spent |
|---|---|
| Script Evaluation | 5.1 s |
| Other | 1.4 s |
| Script Parsing & Compilation | 506 ms |
| Style & Layout | 361 ms |
| Garbage Collection | 148 ms |
| Parse HTML & CSS | 119 ms |
| Rendering | 69 ms |
Large network payloads cost users real money and are highly correlated with long load times. Learn how to reduce payload sizes.
More information about the performance of your application. These numbers don't directly affect the Performance score.
These checks highlight opportunities to improve the accessibility of your web app. Automatic detection can only detect a subset of issues and does not guarantee the accessibility of your web app, so manual testing is also encouraged.
These checks ensure that your page is following basic search engine optimization advice. There are many additional factors Lighthouse does not score here that may affect your search ranking, including performance on Core Web Vitals. Learn more about Google Search Essentials.
Industry-standard audits powered by Google Lighthouse. — Desktop
Key metrics that affect user experience. — Desktop
First Contentful Paint First Contentful Paint — how long until the browser renders the first piece of content. Under 1.8s is good.
1.47 s
Largest Contentful Paint Largest Contentful Paint — how long until the largest visible element loads. Under 2.5s is good.
2.44 s
Total Blocking Time Total Blocking Time — total time the main thread was blocked, preventing user input. Under 200ms is good.
337 ms
Cumulative Layout Shift Cumulative Layout Shift — measures visual stability. How much the page layout shifts during loading. Under 0.1 is good.
0.070
Speed Index Speed Index — how quickly content is visually displayed during load. Under 3.4s is good.
1.94 s
Time to Interactive Time to Interactive — how long until the page is fully interactive and responds to user input. Under 3.8s is good.
4.50 s
Audit breakdown by category with detailed findings.
Remove large, duplicate JavaScript modules from bundles to reduce unnecessary bytes consumed by network activity.
Polyfills and transforms enable older browsers to use new JavaScript features. However, many aren't necessary for modern browsers. Consider modifying your JavaScript build process to not transpile Baseline features, unless you know you must support older browsers. Learn why most sites can deploy ES6+ code without transpiling
3rd party code can significantly impact load performance. Reduce and defer loading of 3rd party code to prioritize your page's content.
Your first network request is the most important. Reduce its latency by avoiding redirects, ensuring a fast server response, and enabling text compression.
A forced reflow occurs when JavaScript queries geometric properties (such as offsetWidth) after styles have been invalidated by a change to the DOM state. This can result in poor performance. Learn more about forced reflows and possible mitigations.
Reducing the download time of images can improve the perceived load time of the page and LCP. Learn more about optimizing image size
| URL | Resource Size | Est Savings | |
|---|---|---|---|
div.container > div.featured-editorial-item > a.g-button > img.g-image div.container > div.featured-editorial-item > a.g-button > img.g-image | f4.bcbits.com/img/0043986172_0 | 421.6 KiB | 343.1 KiB |
Cassettes div.page-wrapper > ul > li > a.image-tile | /vite/homepage/client/v1/en/assets/merch-card_cassette_2x... | 380.7 KiB | 341.0 KiB |
Vinyl div.page-wrapper > ul > li > a.image-tile | s4.bcbits.com/vite/homepage/client/v1/en/assets/merch-card_vinyl_2x-T-u5UH70.jpg | 264.3 KiB | 224.6 KiB |
CDs div.page-wrapper > ul > li > a.image-tile | s4.bcbits.com/vite/homepage/client/v1/en/assets/merch-card_cd_2x-DFrFD3A1.jpg | 216.4 KiB | 176.6 KiB |
T-Shirts div.page-wrapper > ul > li > a.image-tile | /vite/homepage/client/v1/en/assets/merch-card_tshirt_2x-B... | 142.3 KiB | 102.5 KiB |
div.small-items > div.featured-editorial-item > a.g-button > img.g-image div.small-items > div.featured-editorial-item > a.g-button > img.g-image | f4.bcbits.com/img/0044155556_170.jpg | 72.4 KiB | 65.1 KiB |
li.item > a > div.item-loc > span.flag-icon li.item > a > div.item-loc > span.flag-icon | /vite/homepage/client/v1/en/assets/_sprite-country-flags-... | 71.2 KiB | 46.3 KiB |
div.small-items > div.featured-editorial-item > a.g-button > img.g-image div.small-items > div.featured-editorial-item > a.g-button > img.g-image | f4.bcbits.com/img/0043670458_170.jpg | 38.1 KiB | 31.6 KiB |
div.small-items > div.featured-editorial-item > a.g-button > img.g-image div.small-items > div.featured-editorial-item > a.g-button > img.g-image | f4.bcbits.com/img/0043987082_170.jpg | 29.0 KiB | 24.2 KiB |
Ms Nina - Pastillas (King Doudou Edit) li.item > a > div.item-img > img | f4.bcbits.com/img/a3948332483_7.jpg | 16.8 KiB | 15.0 KiB |
Last Warning li.item > a > div.item-img > img | f4.bcbits.com/img/a4254779095_7.jpg | 13.5 KiB | 11.7 KiB |
Dystopia li.item > a > div.item-img > img | f4.bcbits.com/img/a4118235707_7.jpg | 9.0 KiB | 7.2 KiB |
"Gateways To Annihilation" T shirt (Reduced for Bandcamp Friday) li.item > a > div.item-img > img | f4.bcbits.com/img/0015390058_37.jpg | 8.6 KiB | 7.2 KiB |
Salsoul Nugget (If You Wanna) [20th Anniversary Extended Klub Mix] li.item > a > div.item-img > img | f4.bcbits.com/img/a2431993523_7.jpg | 8.5 KiB | 6.6 KiB |
EP li.item > a > div.item-img > img | f4.bcbits.com/img/a0111398991_7.jpg | 8.2 KiB | 6.4 KiB |
Avoid chaining critical requests by reducing the length of chains, reducing the download size of resources, or deferring the download of unnecessary resources to improve page load.
Requests are blocking the page's initial render, which may delay LCP. Deferring or inlining can move these network requests out of the critical path.
| URL | Transfer Size | Duration |
|---|---|---|
| s4.bcbits.com/vite/homepage/client/v1/en/assets/HomepageApp-DOcMBKq6.css | 48.2 KiB | 81 ms |
| /client-bundle/1/ArtistsLabelsPages_1/salesfeed_css-5828a... | 2.5 KiB | 209 ms |
A long cache lifetime can speed up repeat visits to your page. Learn more about caching.
| Request | Cache TTL | Transfer Size |
|---|---|---|
| js.stripe.com/basil/stripe.js | 120.0 s | 219.8 KiB |
| m.stripe.network/out-4.5.45.js | 300.0 s | 16.5 KiB |
| www.gstatic.com/recaptcha/api2/logo_48.png | 604800.0 s | 2.3 KiB |
Consider setting font-display to swap or optional to ensure text is consistently visible. swap can be further optimized to mitigate layout shifts with font metric overrides.
| URL | Est Savings |
|---|---|
| fonts.gstatic.com/s/roboto/v48/KFO7CnqEu92Fr1ME7kSn66aGLdTylUAMa3yUBHMdazQ.woff2 | 10 ms |
These insights are also available in the Chrome DevTools Performance Panel - record a trace to view more detailed information.
Redirects introduce additional delays before the page can be loaded. Learn how to avoid page redirects.
| URL | Time Spent |
|---|---|
| www.bandcamp.com/ | 429 ms |
| bandcamp.com/ | 0.0 ms |
Time to Interactive is the amount of time it takes for the page to become fully interactive. Learn more about the Time to Interactive metric.
The maximum potential First Input Delay that your users could experience is the duration of the longest task. Learn more about the Maximum Potential First Input Delay metric.
Reduce unused JavaScript and defer loading scripts until they are required to decrease bytes consumed by network activity. Learn how to reduce unused JavaScript.
| URL | Transfer Size | Est Savings |
|---|---|---|
| www.gstatic.com/recaptcha/releases/kUYUkUlSyqkjTSMaN2w3RaOh/recaptcha__en.js | 362.6 KiB | 161.8 KiB |
| js.stripe.com/basil/stripe.js | 219.4 KiB | 159.9 KiB |
| /vite/homepage/client/v1/en/entrypoints/HomepageApp.vue_e... | 294.8 KiB | 125.7 KiB |
| www.googletagmanager.com/gtag/js?id=GT-WV86TPST&cx=c>m=4e6460 | 175.4 KiB | 68.1 KiB |
| www.googletagmanager.com/gtm.js?id=GTM-TKFS52TF | 123.2 KiB | 61.9 KiB |
Consider reducing the time spent parsing, compiling, and executing JS. You may find delivering smaller JS payloads helps with this. Learn how to reduce Javascript execution time.
| URL | Total CPU Time | Script Evaluation | Script Parse |
|---|---|---|---|
| /vite/homepage/client/v1/en/entrypoints/HomepageApp.vue_e... | 1.0 s | 972 ms | 1.2 ms |
| Unattributable | 612 ms | 231 ms | 0.0 ms |
| bandcamp.com/ | 271 ms | 2.5 ms | 0.2 ms |
| www.googletagmanager.com/gtag/js?id=GT-WV86TPST&cx=c>m=4e6460 | 114 ms | 95 ms | 18 ms |
| js.stripe.com/basil/stripe.js | 87 ms | 55 ms | 32 ms |
| www.gstatic.com/recaptcha/releases/kUYUkUlSyqkjTSMaN2w3RaOh/recaptcha__en.js | 86 ms | 51 ms | 29 ms |
| www.googletagmanager.com/gtm.js?id=GTM-TKFS52TF | 59 ms | 47 ms | 12 ms |
Consider reducing the time spent parsing, compiling and executing JS. You may find delivering smaller JS payloads helps with this. Learn how to minimize main-thread work
| Category | Time Spent |
|---|---|
| Script Evaluation | 1.5 s |
| Other | 442 ms |
| Style & Layout | 166 ms |
| Script Parsing & Compilation | 93 ms |
| Rendering | 61 ms |
| Garbage Collection | 58 ms |
| Parse HTML & CSS | 33 ms |
Reduce unused rules from stylesheets and defer CSS not used for above-the-fold content to decrease bytes consumed by network activity. Learn how to reduce unused CSS.
| URL | Transfer Size | Est Savings |
|---|---|---|
| s4.bcbits.com/vite/homepage/client/v1/en/assets/HomepageApp-DOcMBKq6.css | 18.2 KiB | 15.9 KiB |
Large network payloads cost users real money and are highly correlated with long load times. Learn how to reduce payload sizes.
More information about the performance of your application. These numbers don't directly affect the Performance score.
These checks highlight opportunities to improve the accessibility of your web app. Automatic detection can only detect a subset of issues and does not guarantee the accessibility of your web app, so manual testing is also encouraged.
These checks ensure that your page is following basic search engine optimization advice. There are many additional factors Lighthouse does not score here that may affect your search ranking, including performance on Core Web Vitals. Learn more about Google Search Essentials.
Send Feedback