Spain · Madrid Completed: Apr 14, 2026 22:38 UTC
Your site declined by 1 points
Compared to scan from 1 day ago
Mobile 375 × 812

Desktop 1440 × 900

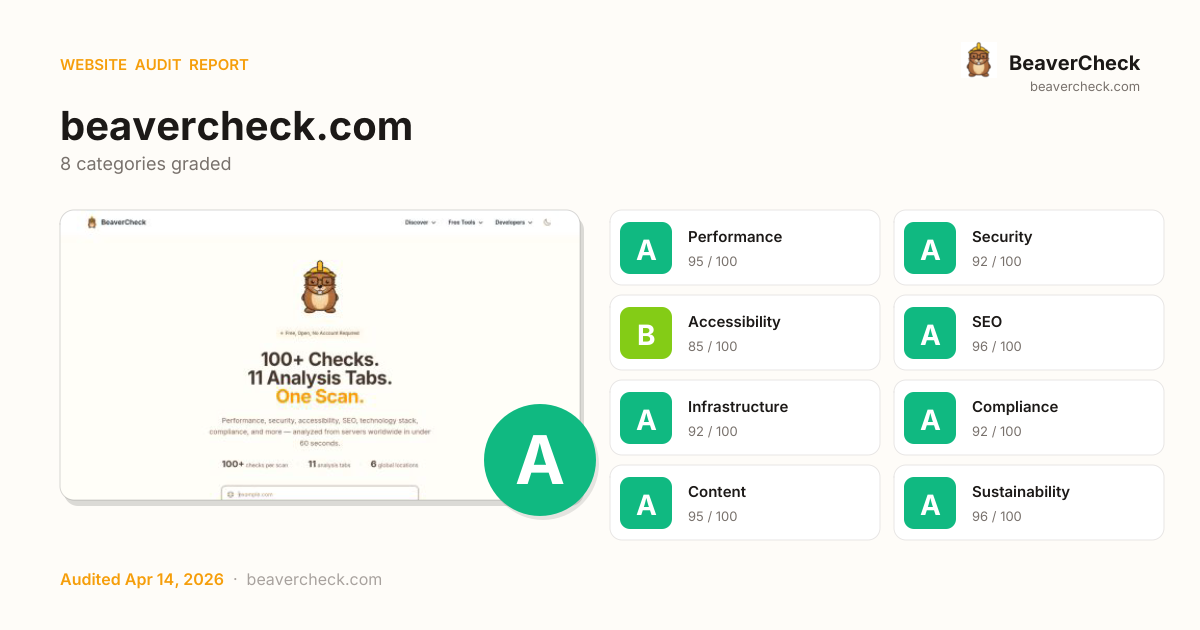
Score: 92 / 100 1
Based on 8 categories, 0 sections
Fast site — your users get a smooth experience.
Strong security — your users are well protected.
Inclusive design — your site works well for all users.
Well-optimized for search — your content is discoverable.
Solid infrastructure — fast server responses across the board.
Strong compliance posture across regulations.
Rich content metadata — your pages look great everywhere.
Lean and efficient — low environmental impact per visit.
The overall score is a weighted average of individual category scores. Categories with more impact on user experience and security carry more weight.
Weights reflect general web best practices. Individual needs may differ.
https://beavercheck.com/: 485ms CPU time
Performance issues directly impact user engagement and conversion rates.
Registrar lock is NOT enabled
Infrastructure issues create a performance ceiling that no frontend optimization can overcome.
42 of 47 links are healthy
Content issues affect how your site appears when shared and how users perceive quality.
Broken link: https://beavercheck.com/history
Content issues affect how your site appears when shared and how users perceive quality.
Broken link: https://beavercheck.com/results/17720c8c-f3cd-46e5-8bb6-8...
Content issues affect how your site appears when shared and how users perceive quality.
High impact, low effort — start here.
Nothing in this quadrant — good news.
High impact, requires investment.
Small gains, minimal effort.
Nothing in this quadrant — good news.
Low impact, high effort — do last.
Nothing in this quadrant — good news.
[](https://beavercheck.com/results/eff18ee7-8702-4e0d-8da1-6ca1ce81dd0f)<a href="https://beavercheck.com/results/eff18ee7-8702-4e0d-8da1-6ca1ce81dd0f"><img src="https://beavercheck.com/badge?url=https%3A%2F%2Fbeavercheck.com" alt="BeaverCheck Score"></a>https://beavercheck.com/badge?url=https%3A%2F%2Fbeavercheck.comThis badge auto-updates with your latest scan result.
Your site is in great shape. The remaining improvements are refinements rather than critical fixes. Your server takes 2565ms to respond — every other performance metric inherits that delay. Addressing the critical issues below would have the most immediate impact on your conversion rate.
€960 investment → €0.04/month returns
€960
12h · 5 findings
€0.04 /mo
~€0.51 / year
No applicable regulations in this jurisdiction
Figures combine localized regulatory fine ceilings, search/conversion value priced against local CPC, and bandwidth waste estimates. Results depend on implementation quality and audience composition. Not legal or financial advice.
12.0 developer hours at €80/hr
Based on France rates (€80/hr)
€0.04 / month at risk
~€0.51 / year if left unfixed
€0.04 /mo
579.1 MB/mo × 0.074 EUR/GB
Compliance figures represent the statutory maximum fine for the most severe triggered category, capped per regulation — not the sum of per-finding penalties. Based on published regulatory fine ranges. This is not legal advice.
Unique monthly visitors from your analytics
Purchases, signups, or key actions
Optional — for revenue estimation
more engaged visitors from reduced bounce
Fix 3 critical issues to capture this value
Based on Google/Deloitte research ("Milliseconds Make Millions") showing a ~7% bounce rate increase per additional second of LCP above the 2.5s "Good" threshold.
Your site's LCP: → estimated after fixes.
These are estimates based on industry research — actual results vary
Your data stays in your browser — nothing is sent to our servers
Thanks for your feedback!
We'll use a cached audit if available, or offer to scan.
Industry-standard audits powered by Google Lighthouse.
Key metrics that affect user experience.
First Contentful Paint First Contentful Paint — how long until the browser renders the first piece of content. Under 1.8s is good.
1.06 s
Largest Contentful Paint Largest Contentful Paint — how long until the largest visible element loads. Under 2.5s is good.
1.39 s
Total Blocking Time Total Blocking Time — total time the main thread was blocked, preventing user input. Under 200ms is good.
37 ms
Cumulative Layout Shift Cumulative Layout Shift — measures visual stability. How much the page layout shifts during loading. Under 0.1 is good.
0.001
Speed Index Speed Index — how quickly content is visually displayed during load. Under 3.4s is good.
2.20 s
Time to Interactive Time to Interactive — how long until the page is fully interactive and responds to user input. Under 3.8s is good.
1.89 s
Audit breakdown by category with detailed findings.
Remove large, duplicate JavaScript modules from bundles to reduce unnecessary bytes consumed by network activity.
Performance issues directly impact user engagement and conversion rates.
Polyfills and transforms enable older browsers to use new JavaScript features. However, many aren't necessary for modern browsers. Consider modifying your JavaScript build process to not transpile Baseline features, unless you know you must support older browsers. Learn why most sites can deploy ES6+ code without transpiling
Shipping ES5 transpiled code to modern browsers wastes bytes — every user with an evergreen browser pays for compatibility you don't need.
Most users today run browsers that natively support ES6+, async/await, optional chaining, and the rest of modern JavaScript. Transpiling to ES5 'just in case' adds 20-40% to your bundle for no benefit. Configure your build to target a modern browserslist, or ship a differential bundle pair (modern + legacy) with the module/nomodule pattern.
Source: Google web.dev / Lighthouse
3rd party code can significantly impact load performance. Reduce and defer loading of 3rd party code to prioritize your page's content.
Performance issues directly impact user engagement and conversion rates.
Your first network request is the most important. Reduce its latency by avoiding redirects, ensuring a fast server response, and enabling text compression.
Performance issues directly impact user engagement and conversion rates.
Avoid chaining critical requests by reducing the length of chains, reducing the download size of resources, or deferring the download of unnecessary resources to improve page load.
Performance issues directly impact user engagement and conversion rates.
Requests are blocking the page's initial render, which may delay LCP. Deferring or inlining can move these network requests out of the critical path.
Performance issues directly impact user engagement and conversion rates.
| URL | Transfer Size |
|---|---|
| beavercheck.com/static/css/output.css?v=4b4ff9b | 17.2 KiB |
These insights are also available in the Chrome DevTools Performance Panel - record a trace to view more detailed information.
Keep the server response time for the main document short because all other requests depend on it. Learn more about the Time to First Byte metric.
Performance issues directly impact user engagement and conversion rates.
| URL | Time Spent |
|---|---|
| beavercheck.com/ | 940 ms |
These checks highlight opportunities to improve the accessibility of your web app. Automatic detection can only detect a subset of issues and does not guarantee the accessibility of your web app, so manual testing is also encouraged.
Low-contrast text is difficult or impossible for many users to read. Learn how to provide sufficient color contrast.
Performance issues directly impact user engagement and conversion rates.
| Failing Elements |
|---|
One Scan. section#top > div.max-w-2xl > h1.text-4xl > span.text-amber-500 |
Run Audit div.max-w-2xl > form.max-w-md > button.flex > span.htmx-hide-on-request |
Advanced options div.max-w-2xl > form.max-w-md > div.mt-3 > button.flex |
Lab + real-user speed metrics div.bg-white > div.flex > div > p.text-xs |
SSL, headers, vulnerabilities div.bg-white > div.flex > div > p.text-xs |
WCAG compliance + visual contrast div.bg-white > div.flex > div > p.text-xs |
Search engine optimization div.bg-white > div.flex > div > p.text-xs |
Quality, readability, images div.bg-white > div.flex > div > p.text-xs |
DNS, hosting, domain intelligence div.bg-white > div.flex > div > p.text-xs |
Full technology stack detection div.bg-white > div.flex > div > p.text-xs |
GDPR, privacy, tracker detection div.bg-white > div.flex > div > p.text-xs |
Uptime, protocols, transport div.bg-white > div.flex > div > p.text-xs |
Carbon footprint & green hosting div.bg-white > div.flex > div > p.text-xs |
Google Lighthouse raw scores div.bg-white > div.flex > div > p.text-xs |
PageSpeed Insights div.max-w-3xl > div.space-y-3 > div.flex > span.text-sm |
SecurityHeaders.com div.max-w-3xl > div.space-y-3 > div.flex > span.text-sm |
SSL Labs div.max-w-3xl > div.space-y-3 > div.flex > span.text-sm |
BuiltWith div.max-w-3xl > div.space-y-3 > div.flex > span.text-sm |
GTmetrix div.max-w-3xl > div.space-y-3 > div.flex > span.text-sm |
WAVE div.max-w-3xl > div.space-y-3 > div.flex > span.text-sm |
Website Carbon div.max-w-3xl > div.space-y-3 > div.flex > span.text-sm |
Apr 14, 2026 12:19 div.space-y-2 > a.flex > div.flex-1 > p.text-xs |
Apr 13, 2026 22:48 div.space-y-2 > a.flex > div.flex-1 > p.text-xs |
Apr 13, 2026 09:24 div.space-y-2 > a.flex > div.flex-1 > p.text-xs |
Apr 12, 2026 21:45 div.space-y-2 > a.flex > div.flex-1 > p.text-xs |
Apr 12, 2026 14:13 div.space-y-2 > a.flex > div.flex-1 > p.text-xs |
Start Your Free Analysis div.max-w-2xl > form.mt-8 > div.flex > button.rounded-xl |
Built with beaver-powered love for the open web. footer.border-t > div.max-w-5xl > div.mt-8 > p.text-xs |
© 2026 BeaverCheck footer.border-t > div.max-w-5xl > div.mt-8 > p.mt-1 |
These are opportunities to improve the legibility of your content.
Deprecated APIs will eventually be removed from the browser. Learn more about deprecated APIs.
Performance issues directly impact user engagement and conversion rates.
| Deprecation / Warning | Source |
|---|---|
| SharedStorage | beavercheck.com/static/js/alpine.min.js?v=4b4ff9b line 4, col 16571 |
These checks ensure that your page is following basic search engine optimization advice. There are many additional factors Lighthouse does not score here that may affect your search ranking, including performance on Core Web Vitals. Learn more about Google Search Essentials.
Industry-standard audits powered by Google Lighthouse. — Desktop
Key metrics that affect user experience. — Desktop
First Contentful Paint First Contentful Paint — how long until the browser renders the first piece of content. Under 1.8s is good.
287 ms
Largest Contentful Paint Largest Contentful Paint — how long until the largest visible element loads. Under 2.5s is good.
372 ms
Total Blocking Time Total Blocking Time — total time the main thread was blocked, preventing user input. Under 200ms is good.
0 ms
Cumulative Layout Shift Cumulative Layout Shift — measures visual stability. How much the page layout shifts during loading. Under 0.1 is good.
0.008
Speed Index Speed Index — how quickly content is visually displayed during load. Under 3.4s is good.
806 ms
Time to Interactive Time to Interactive — how long until the page is fully interactive and responds to user input. Under 3.8s is good.
372 ms
Audit breakdown by category with detailed findings.
Remove large, duplicate JavaScript modules from bundles to reduce unnecessary bytes consumed by network activity.
Performance issues directly impact user engagement and conversion rates.
Polyfills and transforms enable older browsers to use new JavaScript features. However, many aren't necessary for modern browsers. Consider modifying your JavaScript build process to not transpile Baseline features, unless you know you must support older browsers. Learn why most sites can deploy ES6+ code without transpiling
Shipping ES5 transpiled code to modern browsers wastes bytes — every user with an evergreen browser pays for compatibility you don't need.
Most users today run browsers that natively support ES6+, async/await, optional chaining, and the rest of modern JavaScript. Transpiling to ES5 'just in case' adds 20-40% to your bundle for no benefit. Configure your build to target a modern browserslist, or ship a differential bundle pair (modern + legacy) with the module/nomodule pattern.
Source: Google web.dev / Lighthouse
3rd party code can significantly impact load performance. Reduce and defer loading of 3rd party code to prioritize your page's content.
Performance issues directly impact user engagement and conversion rates.
Your first network request is the most important. Reduce its latency by avoiding redirects, ensuring a fast server response, and enabling text compression.
Performance issues directly impact user engagement and conversion rates.
Avoid chaining critical requests by reducing the length of chains, reducing the download size of resources, or deferring the download of unnecessary resources to improve page load.
Performance issues directly impact user engagement and conversion rates.
Requests are blocking the page's initial render, which may delay LCP. Deferring or inlining can move these network requests out of the critical path.
Performance issues directly impact user engagement and conversion rates.
| URL | Transfer Size |
|---|---|
| beavercheck.com/static/css/output.css?v=4b4ff9b | 17.2 KiB |
These insights are also available in the Chrome DevTools Performance Panel - record a trace to view more detailed information.
Keep the server response time for the main document short because all other requests depend on it. Learn more about the Time to First Byte metric.
Performance issues directly impact user engagement and conversion rates.
| URL | Time Spent |
|---|---|
| beavercheck.com/ | 848 ms |
These checks highlight opportunities to improve the accessibility of your web app. Automatic detection can only detect a subset of issues and does not guarantee the accessibility of your web app, so manual testing is also encouraged.
Low-contrast text is difficult or impossible for many users to read. Learn how to provide sufficient color contrast.
Performance issues directly impact user engagement and conversion rates.
| Failing Elements |
|---|
One Scan. section#top > div.max-w-2xl > h1.text-4xl > span.text-amber-500 |
Run Audit div.max-w-2xl > form.max-w-md > button.flex > span.htmx-hide-on-request |
Advanced options div.max-w-2xl > form.max-w-md > div.mt-3 > button.flex |
Lab + real-user speed metrics div.bg-white > div.flex > div > p.text-xs |
SSL, headers, vulnerabilities div.bg-white > div.flex > div > p.text-xs |
WCAG compliance + visual contrast div.bg-white > div.flex > div > p.text-xs |
Search engine optimization div.bg-white > div.flex > div > p.text-xs |
Quality, readability, images div.bg-white > div.flex > div > p.text-xs |
DNS, hosting, domain intelligence div.bg-white > div.flex > div > p.text-xs |
Full technology stack detection div.bg-white > div.flex > div > p.text-xs |
GDPR, privacy, tracker detection div.bg-white > div.flex > div > p.text-xs |
Uptime, protocols, transport div.bg-white > div.flex > div > p.text-xs |
Carbon footprint & green hosting div.bg-white > div.flex > div > p.text-xs |
Google Lighthouse raw scores div.bg-white > div.flex > div > p.text-xs |
PageSpeed Insights div.max-w-3xl > div.space-y-3 > div.flex > span.text-sm |
SecurityHeaders.com div.max-w-3xl > div.space-y-3 > div.flex > span.text-sm |
SSL Labs div.max-w-3xl > div.space-y-3 > div.flex > span.text-sm |
BuiltWith div.max-w-3xl > div.space-y-3 > div.flex > span.text-sm |
GTmetrix div.max-w-3xl > div.space-y-3 > div.flex > span.text-sm |
WAVE div.max-w-3xl > div.space-y-3 > div.flex > span.text-sm |
Website Carbon div.max-w-3xl > div.space-y-3 > div.flex > span.text-sm |
Apr 14, 2026 12:19 div.space-y-2 > a.flex > div.flex-1 > p.text-xs |
Apr 13, 2026 22:48 div.space-y-2 > a.flex > div.flex-1 > p.text-xs |
Apr 13, 2026 09:24 div.space-y-2 > a.flex > div.flex-1 > p.text-xs |
Apr 12, 2026 21:45 div.space-y-2 > a.flex > div.flex-1 > p.text-xs |
Apr 12, 2026 14:13 div.space-y-2 > a.flex > div.flex-1 > p.text-xs |
Start Your Free Analysis div.max-w-2xl > form.mt-8 > div.flex > button.rounded-xl |
Built with beaver-powered love for the open web. footer.border-t > div.max-w-5xl > div.mt-8 > p.text-xs |
© 2026 BeaverCheck footer.border-t > div.max-w-5xl > div.mt-8 > p.mt-1 |
These are opportunities to improve the legibility of your content.
Deprecated APIs will eventually be removed from the browser. Learn more about deprecated APIs.
Performance issues directly impact user engagement and conversion rates.
| Deprecation / Warning | Source |
|---|---|
| SharedStorage | beavercheck.com/static/js/alpine.min.js?v=4b4ff9b line 4, col 16571 |
These checks ensure that your page is following basic search engine optimization advice. There are many additional factors Lighthouse does not score here that may affect your search ranking, including performance on Core Web Vitals. Learn more about Google Search Essentials.
Send Feedback