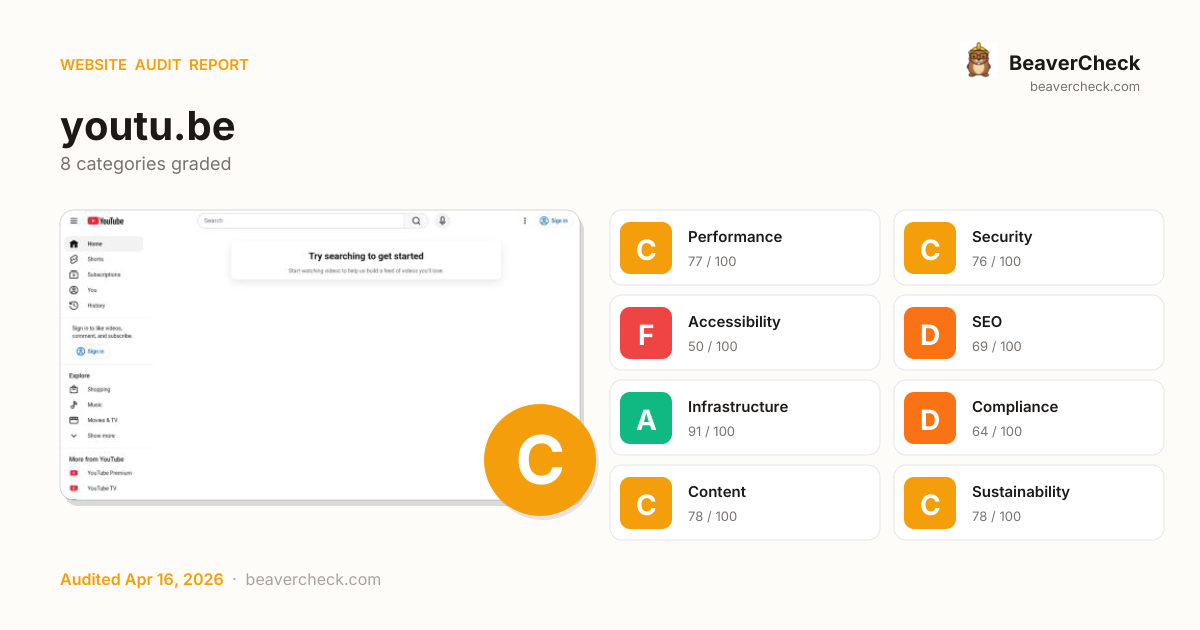
Mobile 375 × 812

Desktop 1440 × 900

Score: 72 / 100
Based on 8 categories, 0 sections
Decent speed, but optimizing further could improve engagement.
Good foundation, but a few gaps could be exploited.
Several issues make your site difficult for assistive technology users.
Missing signals may be hurting your search visibility.
Solid infrastructure — fast server responses across the board.
Several regulatory requirements are not yet met.
Good content signals with minor gaps.
Reasonable footprint with room for optimization.
The overall score is a weighted average of individual category scores. Categories with more impact on user experience and security carry more weight.
Weights reflect general web best practices. Individual needs may differ.
'unsafe-inline' found in script source
Security gaps expose your site and users to attacks, eroding trust.
1 button(s) with no accessible text
Accessibility issues exclude users with disabilities — up to 15% of your potential audience.
1 control(s) without accessible label
Accessibility issues exclude users with disabilities — up to 15% of your potential audience.
2 image(s) missing alt attribute
Accessibility issues exclude users with disabilities — up to 15% of your potential audience.
2 image-in-link without alt text
Accessibility issues exclude users with disabilities — up to 15% of your potential audience.
High impact, low effort — start here.
High impact, requires investment.
Small gains, minimal effort.
Nothing in this quadrant — good news.
Low impact, high effort — do last.
Nothing in this quadrant — good news.
[](https://beavercheck.com/results/effbbd49-5469-42fb-a7bd-c020c1f6f470)<a href="https://beavercheck.com/results/effbbd49-5469-42fb-a7bd-c020c1f6f470"><img src="https://beavercheck.com/badge?url=https%3A%2F%2Fyoutu.be" alt="BeaverCheck Score"></a>https://beavercheck.com/badge?url=https%3A%2F%2Fyoutu.beThis badge auto-updates with your latest scan result.
Your site performs reasonably well, but a few targeted fixes could meaningfully improve results. Accessibility issues exclude users who rely on assistive technology — an estimated 15% of your potential audience. Addressing the critical issues below would have the most immediate impact on your user trust.
10 barrier(s) likely increasing bounce by ~38%.
Page takes 8.3s to load
+12% bounceUsers abandon at ~3s — you're 5.8s over the 2.5s threshold
Fix: Optimize render-blocking resources, preload the hero image, and compress images
High main-thread blocking time
+2% bouncePage is non-interactive for 347ms after first paint
Fix: Defer third-party scripts and split large bundles
No HSTS header
+1% bounceReturning visitors are briefly exposed to downgrade attacks on first request
Fix: Set Strict-Transport-Security: max-age=31536000; includeSubDomains
No Content-Security-Policy header
+1% bounceHigher XSS blast radius — one compromised script can exfiltrate the checkout form
Fix: Ship a reporting-only CSP first, then enforce once violations are clean
1 form field(s) without a label
+2% bounceScreen readers skip unlabeled fields; autofill can't identify them; checkout abandonment spikes
Fix: Associate every input with a visible <label for="…">; add autocomplete attributes
No viewport meta tag
+15% bounceMobile browsers render at desktop width and shrink — text unreadable, tap targets miniature
Fix: Add <meta name="viewport" content="width=device-width, initial-scale=1">
No structured data
+2% bounceNo rich-result eligibility in Google — lower SERP CTR vs competitors with stars and prices
Fix: Add JSON-LD for your page type (Product, Article, FAQPage, LocalBusiness, …)
Thin content
+3% bounceUnder 300 words — visitors bounce looking for substance, search engines rank competitors first
Fix: Add a substantive FAQ, product detail, or case-study section
No skip-to-content link
+1% bounceKeyboard and screen-reader users must tab through the entire header on every page
Fix: Add a visible-on-focus <a href="#main">Skip to content</a> as the first focusable element
3 broken link(s) on the page
+5% bounceClicks land on 404s — trust drops and the session often ends
Fix: Fix or remove the broken destinations surfaced on the Content tab
Preliminary CRO audit — each barrier links to the tab with detailed analysis.
€520 investment → €5,084/month returns + EUR 120,500,000 risk avoided
€520
6h · 5 findings
€5,084 /mo
~€61,008 / year
EUR 120,500,000
if kept compliant
€40 — in quick wins — start here for the fastest payback
Figures combine localized regulatory fine ceilings, search/conversion value priced against local CPC, and bandwidth waste estimates. Results depend on implementation quality and audience composition. Not legal or financial advice.
6.5 developer hours at €80/hr
Based on Belgium rates (€80/hr)
Start here for the best return on investment
€10,041,667 / month at risk
~€120,500,004 / year if left unfixed
€120,500,000
+17 more
€0.29 /mo
3981.9 MB/mo × 0.074 EUR/GB
Compliance figures represent the statutory maximum fine for the most severe triggered category, capped per regulation — not the sum of per-finding penalties. Based on published regulatory fine ranges. This is not legal advice.
Unique monthly visitors from your analytics
Purchases, signups, or key actions
Optional — for revenue estimation
more engaged visitors from reduced bounce
Fix 5 critical issues to capture this value
Based on Google/Deloitte research ("Milliseconds Make Millions") showing a ~7% bounce rate increase per additional second of LCP above the 2.5s "Good" threshold.
Your site's LCP: → estimated after fixes.
These are estimates based on industry research — actual results vary
Your data stays in your browser — nothing is sent to our servers
Thanks for your feedback!
We'll use a cached audit if available, or offer to scan.
Industry-standard audits powered by Google Lighthouse.
Key metrics that affect user experience.
First Contentful Paint First Contentful Paint — how long until the browser renders the first piece of content. Under 1.8s is good.
7.11 s
Largest Contentful Paint Largest Contentful Paint — how long until the largest visible element loads. Under 2.5s is good.
8.25 s
Total Blocking Time Total Blocking Time — total time the main thread was blocked, preventing user input. Under 200ms is good.
347 ms
Cumulative Layout Shift Cumulative Layout Shift — measures visual stability. How much the page layout shifts during loading. Under 0.1 is good.
0.001
Speed Index Speed Index — how quickly content is visually displayed during load. Under 3.4s is good.
7.11 s
Time to Interactive Time to Interactive — how long until the page is fully interactive and responds to user input. Under 3.8s is good.
11.54 s
Audit breakdown by category with detailed findings.
Remove large, duplicate JavaScript modules from bundles to reduce unnecessary bytes consumed by network activity.
Performance issues directly impact user engagement and conversion rates.
Polyfills and transforms enable older browsers to use new JavaScript features. However, many aren't necessary for modern browsers. Consider modifying your JavaScript build process to not transpile Baseline features, unless you know you must support older browsers. Learn why most sites can deploy ES6+ code without transpiling
Shipping ES5 transpiled code to modern browsers wastes bytes — every user with an evergreen browser pays for compatibility you don't need.
Most users today run browsers that natively support ES6+, async/await, optional chaining, and the rest of modern JavaScript. Transpiling to ES5 'just in case' adds 20-40% to your bundle for no benefit. Configure your build to target a modern browserslist, or ship a differential bundle pair (modern + legacy) with the module/nomodule pattern.
Source: Google web.dev / Lighthouse
3rd party code can significantly impact load performance. Reduce and defer loading of 3rd party code to prioritize your page's content.
Performance issues directly impact user engagement and conversion rates.
Your first network request is the most important. Reduce its latency by avoiding redirects, ensuring a fast server response, and enabling text compression.
Performance issues directly impact user engagement and conversion rates.
Avoid chaining critical requests by reducing the length of chains, reducing the download size of resources, or deferring the download of unnecessary resources to improve page load.
Performance issues directly impact user engagement and conversion rates.
Requests are blocking the page's initial render, which may delay LCP. Deferring or inlining can move these network requests out of the critical path.
Performance issues directly impact user engagement and conversion rates.
| URL | Transfer Size | Duration |
|---|---|---|
| /s/_/ytmweb/_/js/k=ytmweb.c3_base.en_US.4A446WuLG4I.2021.... | 434.9 KiB | 3.6 s |
| m.youtube.com/static/r/072389cc/fetch_polyfill.vflset/fetch_polyfill.js | 2.6 KiB | 463 ms |
| /s/_/ytmweb/_/ss/k=ytmweb.c3_base.Nl539GGld64.L.W.O/am=AA... | 116.6 KiB | 2.0 s |
| m.youtube.com/static/r/072389cc/scheduler.vflset/scheduler.js | 3.1 KiB | 463 ms |
A long cache lifetime can speed up repeat visits to your page. Learn more about caching.
Performance issues directly impact user engagement and conversion rates.
| Request | Cache TTL | Transfer Size |
|---|---|---|
| static.doubleclick.net/instream/ad_status.js | 900.0 s | 495 B |
These insights are also available in the Chrome DevTools Performance Panel - record a trace to view more detailed information.
Redirects introduce additional delays before the page can be loaded. Learn how to avoid page redirects.
Performance issues directly impact user engagement and conversion rates.
| URL | Time Spent |
|---|---|
| youtu.be/ | 810 ms |
| www.youtube.com/?feature=youtu.be | 767 ms |
| m.youtube.com/?feature=youtu.be | 0.0 ms |
Time to Interactive is the amount of time it takes for the page to become fully interactive. Learn more about the Time to Interactive metric.
Performance issues directly impact user engagement and conversion rates.
The maximum potential First Input Delay that your users could experience is the duration of the longest task. Learn more about the Maximum Potential First Input Delay metric.
Performance issues directly impact user engagement and conversion rates.
Reduce unused rules from stylesheets and defer CSS not used for above-the-fold content to decrease bytes consumed by network activity. Learn how to reduce unused CSS.
Performance issues directly impact user engagement and conversion rates.
| URL | Transfer Size | Est Savings |
|---|---|---|
| /s/_/ytmweb/_/ss/k=ytmweb.c3_base.Nl539GGld64.L.W.O/am=AA... | 116.6 KiB | 115.0 KiB |
| m.youtube.com/s/player/b174a5bb/mobile-polymer-player-svg-ias-mweb.css | 60.1 KiB | 60.0 KiB |
Reduce unused JavaScript and defer loading scripts until they are required to decrease bytes consumed by network activity. Learn how to reduce unused JavaScript.
Multi-megabyte JavaScript bundles delay every interactive feature on the page.
This is the Lighthouse audit fired when too much JS is shipped relative to what executes. The fix isn't a config flag — it requires bundle analysis (webpack-bundle-analyzer, rollup-plugin-visualizer), splitting routes into chunks, lazy-loading off-screen components, and removing unused dependencies. Fundamentally different from minification: minifying reduces byte count, this reduces what's downloaded at all.
Source: Google web.dev / Lighthouse
| URL | Transfer Size | Est Savings |
|---|---|---|
| m.youtube.com/s/player/b174a5bb/player-plasma-es6-en_US.vflset/base.js | 417.1 KiB | 308.2 KiB |
| /s/_/ytmweb/_/js/k=ytmweb.c3_base.en_US.4A446WuLG4I.2021.... | 434.8 KiB | 234.7 KiB |
| /s/_/ytmweb/_/js/k=ytmweb.c3_base.en_US.4A446WuLG4I.2021.... | 77.3 KiB | 59.2 KiB |
Consider reducing the time spent parsing, compiling, and executing JS. You may find delivering smaller JS payloads helps with this. Learn how to reduce Javascript execution time.
Performance issues directly impact user engagement and conversion rates.
| URL | Total CPU Time | Script Evaluation | Script Parse |
|---|---|---|---|
| /s/_/ytmweb/_/js/k=ytmweb.c3_base.en_US.4A446WuLG4I.2021.... | 1.6 s | 1.3 s | 178 ms |
| Unattributable | 853 ms | 163 ms | 0.0 ms |
| m.youtube.com/?feature=youtu.be | 478 ms | 130 ms | 51 ms |
| m.youtube.com/s/player/b174a5bb/player-plasma-es6-en_US.vflset/base.js | 257 ms | 84 ms | 168 ms |
| m.youtube.com/static/r/072389cc/scheduler.vflset/scheduler.js | 151 ms | 114 ms | 1.4 ms |
| /s/_/ytmweb/_/js/k=ytmweb.c3_base.en_US.4A446WuLG4I.2021.... | 145 ms | 92 ms | 8.6 ms |
| /s/_/ytmweb/_/js/k=ytmweb.c3_base.en_US.4A446WuLG4I.2021.... | 127 ms | 74 ms | 42 ms |
| www.google.com/js/th/dTFo-KUuYlGOusziVr8u65jmcwADr_G5apr-mnW3AGs.js | 97 ms | 88 ms | 7.9 ms |
| /s/_/ytmweb/_/js/k=ytmweb.c3_base.en_US.4A446WuLG4I.2021.... | 50 ms | 44 ms | 1.3 ms |
Consider reducing the time spent parsing, compiling and executing JS. You may find delivering smaller JS payloads helps with this. Learn how to minimize main-thread work
Performance issues directly impact user engagement and conversion rates.
| Category | Time Spent |
|---|---|
| Script Evaluation | 3.0 s |
| Other | 893 ms |
| Script Parsing & Compilation | 463 ms |
| Style & Layout | 162 ms |
| Parse HTML & CSS | 136 ms |
| Garbage Collection | 107 ms |
| Rendering | 20 ms |
Many navigations are performed by going back to a previous page, or forwards again. The back/forward cache (bfcache) can speed up these return navigations. Learn more about the bfcache
Performance issues directly impact user engagement and conversion rates.
| Failure reason | Failure type |
|---|---|
| Pages whose main resource has cache-control:no-store cannot enter back/forward cache. | Not actionable |
| Back/forward cache is disabled because some JavaScript network request received resource with Cache-Control: no-store header. | Not actionable |
More information about the performance of your application. These numbers don't directly affect the Performance score.
These checks highlight opportunities to improve the accessibility of your web app. Automatic detection can only detect a subset of issues and does not guarantee the accessibility of your web app, so manual testing is also encouraged.
Low-contrast text is difficult or impossible for many users to read. Learn how to provide sufficient color contrast.
Performance issues directly impact user engagement and conversion rates.
| Failing Elements |
|---|
Search YouTube ytm-search-bar-entry-point-view-model > div.search-bar-entry-point-buttons > div.search-bar-entry-point-button > span.search-bar-entry-point-text |
These are opportunities to improve the legibility of your content.
Disabling zooming is problematic for users with low vision who rely on screen magnification to properly see the contents of a web page. Learn more about the viewport meta tag.
Performance issues directly impact user engagement and conversion rates.
| Failing Elements |
|---|
head > meta head > meta |
One main landmark helps screen reader users navigate a web page. Learn more about landmarks.
Performance issues directly impact user engagement and conversion rates.
| Failing Elements |
|---|
html html |
These items highlight common accessibility best practices.
Source maps translate minified code to the original source code. This helps developers debug in production. In addition, Lighthouse is able to provide further insights. Consider deploying source maps to take advantage of these benefits. Learn more about source maps.
Performance issues directly impact user engagement and conversion rates.
These checks ensure that your page is following basic search engine optimization advice. There are many additional factors Lighthouse does not score here that may affect your search ranking, including performance on Core Web Vitals. Learn more about Google Search Essentials.
Industry-standard audits powered by Google Lighthouse. — Desktop
Key metrics that affect user experience. — Desktop
First Contentful Paint First Contentful Paint — how long until the browser renders the first piece of content. Under 1.8s is good.
1.22 s
Largest Contentful Paint Largest Contentful Paint — how long until the largest visible element loads. Under 2.5s is good.
3.96 s
Total Blocking Time Total Blocking Time — total time the main thread was blocked, preventing user input. Under 200ms is good.
774 ms
Cumulative Layout Shift Cumulative Layout Shift — measures visual stability. How much the page layout shifts during loading. Under 0.1 is good.
0.028
Speed Index Speed Index — how quickly content is visually displayed during load. Under 3.4s is good.
3.05 s
Time to Interactive Time to Interactive — how long until the page is fully interactive and responds to user input. Under 3.8s is good.
4.95 s
Audit breakdown by category with detailed findings.
Remove large, duplicate JavaScript modules from bundles to reduce unnecessary bytes consumed by network activity.
Performance issues directly impact user engagement and conversion rates.
Polyfills and transforms enable older browsers to use new JavaScript features. However, many aren't necessary for modern browsers. Consider modifying your JavaScript build process to not transpile Baseline features, unless you know you must support older browsers. Learn why most sites can deploy ES6+ code without transpiling
Shipping ES5 transpiled code to modern browsers wastes bytes — every user with an evergreen browser pays for compatibility you don't need.
Most users today run browsers that natively support ES6+, async/await, optional chaining, and the rest of modern JavaScript. Transpiling to ES5 'just in case' adds 20-40% to your bundle for no benefit. Configure your build to target a modern browserslist, or ship a differential bundle pair (modern + legacy) with the module/nomodule pattern.
Source: Google web.dev / Lighthouse
3rd party code can significantly impact load performance. Reduce and defer loading of 3rd party code to prioritize your page's content.
Performance issues directly impact user engagement and conversion rates.
Your first network request is the most important. Reduce its latency by avoiding redirects, ensuring a fast server response, and enabling text compression.
Performance issues directly impact user engagement and conversion rates.
A forced reflow occurs when JavaScript queries geometric properties (such as offsetWidth) after styles have been invalidated by a change to the DOM state. This can result in poor performance. Learn more about forced reflows and possible mitigations.
Performance issues directly impact user engagement and conversion rates.
Each subpart has specific improvement strategies. Ideally, most of the LCP time should be spent on loading the resources, not within delays.
Performance issues directly impact user engagement and conversion rates.
Avoid chaining critical requests by reducing the length of chains, reducing the download size of resources, or deferring the download of unnecessary resources to improve page load.
Performance issues directly impact user engagement and conversion rates.
Requests are blocking the page's initial render, which may delay LCP. Deferring or inlining can move these network requests out of the critical path.
Performance issues directly impact user engagement and conversion rates.
A long cache lifetime can speed up repeat visits to your page. Learn more about caching.
Performance issues directly impact user engagement and conversion rates.
| Request | Cache TTL | Transfer Size |
|---|---|---|
| www.gstatic.com/eureka/clank/146/cast_sender.js | 86400.0 s | 13.1 KiB |
| static.doubleclick.net/instream/ad_status.js | 900.0 s | 494 B |
These insights are also available in the Chrome DevTools Performance Panel - record a trace to view more detailed information.
Redirects introduce additional delays before the page can be loaded. Learn how to avoid page redirects.
Performance issues directly impact user engagement and conversion rates.
| URL | Time Spent |
|---|---|
| youtu.be/ | 270 ms |
| www.youtube.com/?feature=youtu.be | 0.0 ms |
The maximum potential First Input Delay that your users could experience is the duration of the longest task. Learn more about the Maximum Potential First Input Delay metric.
Performance issues directly impact user engagement and conversion rates.
Time to Interactive is the amount of time it takes for the page to become fully interactive. Learn more about the Time to Interactive metric.
Performance issues directly impact user engagement and conversion rates.
Reduce unused rules from stylesheets and defer CSS not used for above-the-fold content to decrease bytes consumed by network activity. Learn how to reduce unused CSS.
Performance issues directly impact user engagement and conversion rates.
| URL | Transfer Size | Est Savings |
|---|---|---|
| /s/_/ytmainappweb/_/ss/k=ytmainappweb.kevlar_base.yAlYZ9F... | 271.7 KiB | 262.9 KiB |
| www.youtube.com/s/player/b174a5bb/www-player.css | 56.6 KiB | 56.6 KiB |
| /css2?family=Roboto:wght@300;400;500;700&family=YouTube+S... | 14.9 KiB | 14.9 KiB |
Reduce unused JavaScript and defer loading scripts until they are required to decrease bytes consumed by network activity. Learn how to reduce unused JavaScript.
Multi-megabyte JavaScript bundles delay every interactive feature on the page.
This is the Lighthouse audit fired when too much JS is shipped relative to what executes. The fix isn't a config flag — it requires bundle analysis (webpack-bundle-analyzer, rollup-plugin-visualizer), splitting routes into chunks, lazy-loading off-screen components, and removing unused dependencies. Fundamentally different from minification: minifying reduces byte count, this reduces what's downloaded at all.
Source: Google web.dev / Lighthouse
| URL | Transfer Size | Est Savings |
|---|---|---|
| /s/_/ytmainappweb/_/js/k=ytmainappweb.kevlar_base.en_US.I... | 1.8 MiB | 1.1 MiB |
| www.youtube.com/s/player/b174a5bb/player_es6.vflset/en_US/base.js | 639.4 KiB | 476.2 KiB |
| www.youtube.com/s/player/b174a5bb/player_es6.vflset/en_US/remote.js | 34.3 KiB | 26.8 KiB |
Consider reducing the time spent parsing, compiling, and executing JS. You may find delivering smaller JS payloads helps with this. Learn how to reduce Javascript execution time.
Performance issues directly impact user engagement and conversion rates.
| URL | Total CPU Time | Script Evaluation | Script Parse |
|---|---|---|---|
| /s/_/ytmainappweb/_/js/k=ytmainappweb.kevlar_base.en_US.I... | 1.9 s | 1.5 s | 280 ms |
| /s/desktop/4329498d/jsbin/web-animations-next-lite.min.vf... | 460 ms | 372 ms | 1.6 ms |
| Unattributable | 445 ms | 129 ms | 0.0 ms |
| www.youtube.com/?feature=youtu.be | 260 ms | 25 ms | 27 ms |
| www.youtube.com/s/player/b174a5bb/player_es6.vflset/en_US/base.js | 171 ms | 72 ms | 75 ms |
Consider reducing the time spent parsing, compiling and executing JS. You may find delivering smaller JS payloads helps with this. Learn how to minimize main-thread work
Performance issues directly impact user engagement and conversion rates.
| Category | Time Spent |
|---|---|
| Script Evaluation | 2.5 s |
| Other | 406 ms |
| Script Parsing & Compilation | 402 ms |
| Style & Layout | 196 ms |
| Parse HTML & CSS | 177 ms |
| Garbage Collection | 66 ms |
| Rendering | 17 ms |
Many navigations are performed by going back to a previous page, or forwards again. The back/forward cache (bfcache) can speed up these return navigations. Learn more about the bfcache
Performance issues directly impact user engagement and conversion rates.
| Failure reason | Failure type |
|---|---|
| Pages with cache-control:no-store header cannot enter back/forward cache. | Actionable |
| Pages whose main resource has cache-control:no-store cannot enter back/forward cache. | Not actionable |
| Back/forward cache is disabled because some JavaScript network request received resource with Cache-Control: no-store header. | Not actionable |
Large network payloads cost users real money and are highly correlated with long load times. Learn how to reduce payload sizes.
Performance issues directly impact user engagement and conversion rates.
More information about the performance of your application. These numbers don't directly affect the Performance score.
These checks highlight opportunities to improve the accessibility of your web app. Automatic detection can only detect a subset of issues and does not guarantee the accessibility of your web app, so manual testing is also encouraged.
Touch targets with sufficient size and spacing help users who may have difficulty targeting small controls to activate the targets. Learn more about touch targets.
Performance issues directly impact user engagement and conversion rates.
| Failing Elements |
|---|
About ytd-guide-renderer#guide-renderer > div#footer > div#guide-links-primary > a |
Press ytd-guide-renderer#guide-renderer > div#footer > div#guide-links-primary > a |
Copyright ytd-guide-renderer#guide-renderer > div#footer > div#guide-links-primary > a |
Contact us ytd-guide-renderer#guide-renderer > div#footer > div#guide-links-primary > a |
Creators ytd-guide-renderer#guide-renderer > div#footer > div#guide-links-primary > a |
Developers ytd-guide-renderer#guide-renderer > div#footer > div#guide-links-primary > a |
Terms ytd-guide-renderer#guide-renderer > div#footer > div#guide-links-secondary > a |
Privacy ytd-guide-renderer#guide-renderer > div#footer > div#guide-links-secondary > a |
How YouTube works ytd-guide-renderer#guide-renderer > div#footer > div#guide-links-secondary > a |
Test new features ytd-guide-renderer#guide-renderer > div#footer > div#guide-links-secondary > a |
NFL Sunday Ticket ytd-guide-renderer#guide-renderer > div#footer > div#guide-links-secondary > a |
These items highlight common accessibility best practices.
Errors logged to the console indicate unresolved problems. They can come from network request failures and other browser concerns. Learn more about this errors in console diagnostic audit
Performance issues directly impact user engagement and conversion rates.
| Source | Description |
|---|---|
Failed to load resource: the server responded with a status of 403 () | |
Failed to load resource: the server responded with a status of 403 () |
Source maps translate minified code to the original source code. This helps developers debug in production. In addition, Lighthouse is able to provide further insights. Consider deploying source maps to take advantage of these benefits. Learn more about source maps.
Performance issues directly impact user engagement and conversion rates.
These checks ensure that your page is following basic search engine optimization advice. There are many additional factors Lighthouse does not score here that may affect your search ranking, including performance on Core Web Vitals. Learn more about Google Search Essentials.
Search engines may use `href` attributes on links to crawl websites. Ensure that the `href` attribute of anchor elements links to an appropriate destination, so more pages of the site can be discovered. Learn how to make links crawlable
Performance issues directly impact user engagement and conversion rates.
| Uncrawlable Link |
|---|
div.ytp-title-expanded-overlay > div.ytp-title-expanded-heading > div.ytp-title-expanded-title > a div.ytp-title-expanded-overlay > div.ytp-title-expanded-heading > div.ytp-title-expanded-title > a |
div.ytp-chrome-top > div.ytp-title > div.ytp-title-text > a.ytp-title-link div.ytp-chrome-top > div.ytp-title > div.ytp-title-text > a.ytp-title-link |
div.ytp-overlays-container > div.ytp-overlay-top-left > div.ytp-paid-content-overlay > a.ytp-paid-content-overlay-link div.ytp-overlays-container > div.ytp-overlay-top-left > div.ytp-paid-content-overlay > a.ytp-paid-content-overlay-link |
div#ytp-id-6 > div.ytp-playlist-menu-header > div.ytp-playlist-menu-title > a.ytp-playlist-menu-title-name div#ytp-id-6 > div.ytp-playlist-menu-header > div.ytp-playlist-menu-title > a.ytp-playlist-menu-title-name |
div#movie_player > div#ytp-id-9 > div.ytp-share-panel-inner-content > a.ytp-share-panel-link div#movie_player > div#ytp-id-9 > div.ytp-share-panel-inner-content > a.ytp-share-panel-link |
To appear in search results, crawlers need access to your app.
Send Feedback