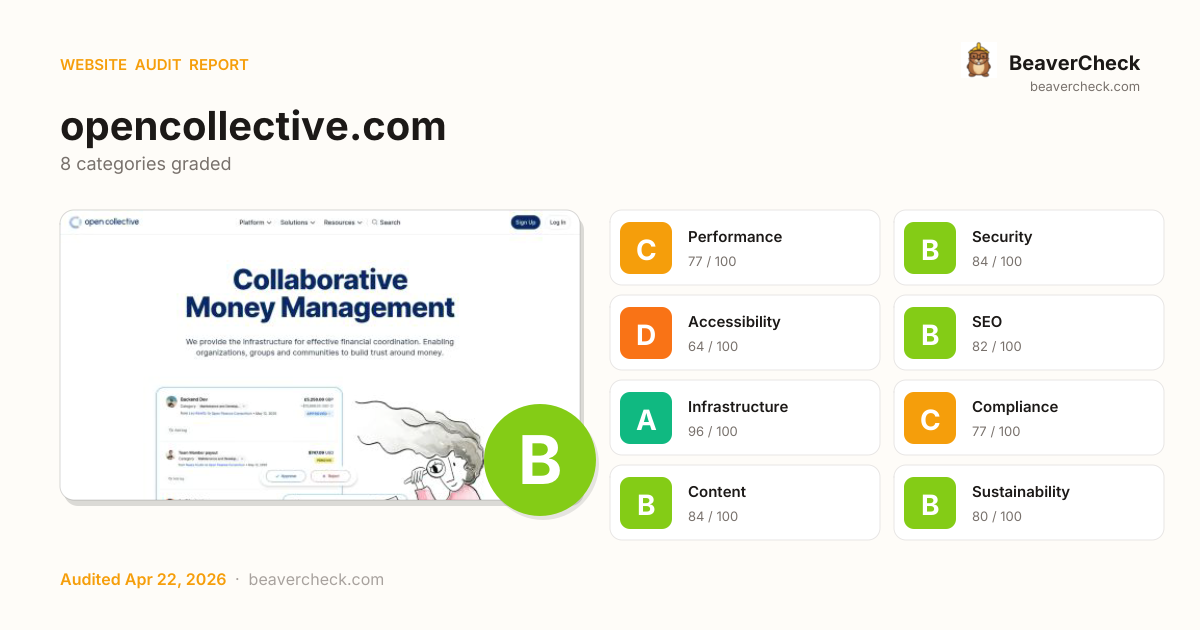
Mobile 375 × 812

Desktop 1440 × 900

Score: 80 / 100
Based on 8 categories, 0 sections
Decent speed, but optimizing further could improve engagement.
Good foundation, but a few gaps could be exploited.
Several issues make your site difficult for assistive technology users.
Solid SEO basics — a few optimizations could boost rankings.
Solid infrastructure — fast server responses across the board.
Mostly compliant — a few items need attention.
Good content signals with minor gaps.
Reasonable footprint with room for optimization.
The overall score is a weighted average of individual category scores. Categories with more impact on user experience and security carry more weight.
Weights reflect general web best practices. Individual needs may differ.
Cross-Origin-Embedder-Policy header is missing
Security gaps expose your site and users to attacks, eroding trust.
Cross-Origin-Opener-Policy header is missing
Security gaps expose your site and users to attacks, eroding trust.
Images are 1.6 MB — compress or use modern formats
Performance issues directly impact user engagement and conversion rates.
JavaScript is 963 KB — consider code splitting or lazy loading
Performance issues directly impact user engagement and conversion rates.
No Permissions-Policy header
Permissions-Policy locks down browser APIs you don't use, shrinking the attack surface.
High impact, low effort — start here.
High impact, requires investment.
Small gains, minimal effort.
Nothing in this quadrant — good news.
Low impact, high effort — do last.
Nothing in this quadrant — good news.
[](https://beavercheck.com/results/f1e67f47-c217-4a3e-8e19-315ba01793c3)<a href="https://beavercheck.com/results/f1e67f47-c217-4a3e-8e19-315ba01793c3"><img src="https://beavercheck.com/badge?url=https%3A%2F%2Fopencollective.com" alt="BeaverCheck Score"></a>https://beavercheck.com/badge?url=https%3A%2F%2Fopencollective.comThis badge auto-updates with your latest scan result.
Your site performs reasonably well, but a few targeted fixes could meaningfully improve results. Your LCP of 16.6s exceeds Google's 2.5s 'Good' threshold and the 2 performance issues below directly contribute to it. Addressing the critical issues below would have the most immediate impact on your user trust.
7 barrier(s) likely increasing bounce by ~28%.
Page takes 16.6s to load
+12% bounceUsers abandon at ~3s — you're 14.1s over the 2.5s threshold
Fix: Optimize render-blocking resources, preload the hero image, and compress images
Page feels frozen for 880ms
+5% bounceClicks on the primary CTA are ignored while JavaScript runs
Fix: Break up long tasks; defer non-critical JavaScript to post-hydration
No Content-Security-Policy header
+1% bounceHigher XSS blast radius — one compromised script can exfiltrate the checkout form
Fix: Ship a reporting-only CSP first, then enforce once violations are clean
Viewport disables user zoom
+2% bounceVisitors with low vision can't read the page — and some jurisdictions treat this as a legal risk
Fix: Remove user-scalable=no; drop maximum-scale if it's below 2
No structured data
+2% bounceNo rich-result eligibility in Google — lower SERP CTR vs competitors with stars and prices
Fix: Add JSON-LD for your page type (Product, Article, FAQPage, LocalBusiness, …)
Content is hard to read
+2% bounceGraduate-level reading difficulty — limits the addressable audience for product or blog pages
Fix: Shorten sentences; replace jargon with plain language; target Flesch ease ≥60
No skip-to-content link
+1% bounceKeyboard and screen-reader users must tab through the entire header on every page
Fix: Add a visible-on-focus <a href="#main">Skip to content</a> as the first focusable element
Preliminary CRO audit — each barrier links to the tab with detailed analysis.
€446 investment → €0.71/month returns + EUR 120,500,000 risk avoided
€446
5h · 5 findings
€0.71 /mo
~€8.50 / year
EUR 120,500,000
if kept compliant
€106 — in quick wins — start here for the fastest payback
Figures combine localized regulatory fine ceilings, search/conversion value priced against local CPC, and bandwidth waste estimates. Results depend on implementation quality and audience composition. Not legal or financial advice.
5.3 developer hours at €85/hr
Based on European Union rates (€85/hr)
Start here for the best return on investment
€10,041,667 / month at risk
~€120,500,009 / year if left unfixed
€120,500,000
+4 more
€0.71 /mo
9564.9 MB/mo × 0.074 EUR/GB
Compliance figures represent the statutory maximum fine for the most severe triggered category, capped per regulation — not the sum of per-finding penalties. Based on published regulatory fine ranges. This is not legal advice.
Unique monthly visitors from your analytics
Purchases, signups, or key actions
Optional — for revenue estimation
more engaged visitors from reduced bounce
Based on Google/Deloitte research ("Milliseconds Make Millions") showing a ~7% bounce rate increase per additional second of LCP above the 2.5s "Good" threshold.
Your site's LCP: → estimated after fixes.
These are estimates based on industry research — actual results vary
Your data stays in your browser — nothing is sent to our servers
Thanks for your feedback!
We'll use a cached audit if available, or offer to scan.
Industry-standard audits powered by Google Lighthouse.
Key metrics that affect user experience.
First Contentful Paint First Contentful Paint — how long until the browser renders the first piece of content. Under 1.8s is good.
1.43 s
Largest Contentful Paint Largest Contentful Paint — how long until the largest visible element loads. Under 2.5s is good.
16.62 s
Total Blocking Time Total Blocking Time — total time the main thread was blocked, preventing user input. Under 200ms is good.
880 ms
Cumulative Layout Shift Cumulative Layout Shift — measures visual stability. How much the page layout shifts during loading. Under 0.1 is good.
0.048
Speed Index Speed Index — how quickly content is visually displayed during load. Under 3.4s is good.
1.43 s
Time to Interactive Time to Interactive — how long until the page is fully interactive and responds to user input. Under 3.8s is good.
16.94 s
Audit breakdown by category with detailed findings.
Remove large, duplicate JavaScript modules from bundles to reduce unnecessary bytes consumed by network activity.
Performance issues directly impact user engagement and conversion rates.
Polyfills and transforms enable older browsers to use new JavaScript features. However, many aren't necessary for modern browsers. Consider modifying your JavaScript build process to not transpile Baseline features, unless you know you must support older browsers. Learn why most sites can deploy ES6+ code without transpiling
Shipping ES5 transpiled code to modern browsers wastes bytes — every user with an evergreen browser pays for compatibility you don't need.
Most users today run browsers that natively support ES6+, async/await, optional chaining, and the rest of modern JavaScript. Transpiling to ES5 'just in case' adds 20-40% to your bundle for no benefit. Configure your build to target a modern browserslist, or ship a differential bundle pair (modern + legacy) with the module/nomodule pattern.
Source: Google web.dev / Lighthouse
3rd party code can significantly impact load performance. Reduce and defer loading of 3rd party code to prioritize your page's content.
Performance issues directly impact user engagement and conversion rates.
A forced reflow occurs when JavaScript queries geometric properties (such as offsetWidth) after styles have been invalidated by a change to the DOM state. This can result in poor performance. Learn more about forced reflows and possible mitigations.
Performance issues directly impact user engagement and conversion rates.
Reducing the download time of images can improve the perceived load time of the page and LCP. Learn more about optimizing image size
Performance issues directly impact user engagement and conversion rates.
| URL | Resource Size | Est Savings | |
|---|---|---|---|
main.sc-8eca4c6e-0 > div.relative > div.absolute > img.h-full main.sc-8eca4c6e-0 > div.relative > div.absolute > img.h-full | /_next/image?url=%2Fstatic%2Fimages%2Fblue-watercolor-bg.... | 848.5 KiB | 812.0 KiB |
Collaborative Money Management div.mt-20 > div.flex > div.my-4 > img | /_next/image?url=%2Fstatic%2Fimages%2Fhero-illustration.p... | 411.4 KiB | 384.2 KiB |
div.mx-auto > h2.mb-8 > a.underline > div.sc-d3b1f0c-0 div.mx-auto > h2.mb-8 > a.underline > div.sc-d3b1f0c-0 | opencollective.com/static/images/ofico/ofico-logo.png | 97.4 KiB | 86.8 KiB |
div.mx-auto > div.relative > div.absolute > img.object-cover div.mx-auto > div.relative > div.absolute > img.object-cover | /_next/image?url=%2Fstatic%2Fimages%2Fgreen-watercolor-bg... | 31.1 KiB | 19.0 KiB |
a.w-full > div.relative > div.relative > div.sc-d3b1f0c-0 a.w-full > div.relative > div.relative > div.sc-d3b1f0c-0 | opencollective.com/static/images/ofico/raft-logo.png | 60.0 KiB | 17.3 KiB |
div.flex > div.relative > div.absolute > img.h-6 div.flex > div.relative > div.absolute > img.h-6 | /_next/image?url=%2Fstatic%2Fimages%2Fsubtitle-green.png&... | 22.2 KiB | 14.7 KiB |
Social Change Nest background div.mb-12 > a.w-full > div.relative > img.object-cover | /_next/image?url=%2Fstatic%2Fimages%2Fofico%2Fscn-bg.png&... | 25.7 KiB | 5.9 KiB |
div.flex > div.relative > div.absolute > img.w-full div.flex > div.relative > div.absolute > img.w-full | /_next/image?url=%2Fstatic%2Fimages%2Fsubtitle-pink.png&w... | 12.4 KiB | 4.9 KiB |
a.w-full > div.relative > div.relative > div.sc-d3b1f0c-0 a.w-full > div.relative > div.relative > div.sc-d3b1f0c-0 | opencollective.com/static/images/ofico/oce-logo.png | 15.4 KiB | 4.7 KiB |
Optimize LCP by making the LCP image discoverable from the HTML immediately, and avoiding lazy-loading
Performance issues directly impact user engagement and conversion rates.
A long cache lifetime can speed up repeat visits to your page. Learn more about caching.
Performance issues directly impact user engagement and conversion rates.
| Request | Cache TTL | Transfer Size |
|---|---|---|
| opencollective.com/static/images/ofico/ofico-logo.png | 86400.0 s | 98.3 KiB |
| opencollective.com/static/images/ofico/raft-logo.png | 86400.0 s | 60.8 KiB |
| opencollective.com/static/images/ofico/giftcollective-logo.png | 86400.0 s | 43.7 KiB |
| opencollective.com/static/images/ofico/scn-logo.png | 86400.0 s | 28.2 KiB |
| opencollective.com/static/images/ofico/oce-logo.png | 86400.0 s | 16.2 KiB |
| /beacon.min.js/v8c78df7c7c0f484497ecbca7046644da177152312... | 86400.0 s | 10.7 KiB |
| opencollective.com/static/images/ofico/osc-logo.png | 86400.0 s | 7.1 KiB |
These insights are also available in the Chrome DevTools Performance Panel - record a trace to view more detailed information.
The maximum potential First Input Delay that your users could experience is the duration of the longest task. Learn more about the Maximum Potential First Input Delay metric.
Performance issues directly impact user engagement and conversion rates.
Time to Interactive is the amount of time it takes for the page to become fully interactive. Learn more about the Time to Interactive metric.
Performance issues directly impact user engagement and conversion rates.
Reduce unused JavaScript and defer loading scripts until they are required to decrease bytes consumed by network activity. Learn how to reduce unused JavaScript.
Multi-megabyte JavaScript bundles delay every interactive feature on the page.
This is the Lighthouse audit fired when too much JS is shipped relative to what executes. The fix isn't a config flag — it requires bundle analysis (webpack-bundle-analyzer, rollup-plugin-visualizer), splitting routes into chunks, lazy-loading off-screen components, and removing unused dependencies. Fundamentally different from minification: minifying reduces byte count, this reduces what's downloaded at all.
Source: Google web.dev / Lighthouse
| URL | Transfer Size | Est Savings |
|---|---|---|
| opencollective.com/_next/static/chunks/appCommon-8ef9f2ad60d02f5d.js | 469.8 KiB | 297.3 KiB |
| opencollective.com/_next/static/chunks/framework-859673bda8a51a7d.js | 114.0 KiB | 78.6 KiB |
| opencollective.com/_next/static/chunks/1321-d9be0253e305e9b9.js | 122.6 KiB | 56.3 KiB |
| opencollective.com/_next/static/chunks/1586-19927f5c8b6f7147.js | 30.0 KiB | 24.2 KiB |
| opencollective.com/_next/static/chunks/435-859c19df3b862776.js | 25.9 KiB | 21.2 KiB |
| opencollective.com/_next/static/chunks/8160-a466f96e1bf8db74.js | 23.1 KiB | 20.1 KiB |
Consider reducing the time spent parsing, compiling, and executing JS. You may find delivering smaller JS payloads helps with this. Learn how to reduce Javascript execution time.
Performance issues directly impact user engagement and conversion rates.
| URL | Total CPU Time | Script Evaluation | Script Parse |
|---|---|---|---|
| opencollective.com/_next/static/chunks/framework-859673bda8a51a7d.js | 812 ms | 657 ms | 107 ms |
| opencollective.com/ | 652 ms | 15 ms | 0.5 ms |
| opencollective.com/_next/static/chunks/pages/_app-f01c383910bb7bc5.js | 599 ms | 579 ms | 20 ms |
| Unattributable | 405 ms | 9.0 ms | 0.0 ms |
| opencollective.com/_next/static/chunks/appCommon-8ef9f2ad60d02f5d.js | 303 ms | 106 ms | 186 ms |
| opencollective.com/_next/static/chunks/pages/index-fb503a85d698341e.js | 181 ms | 180 ms | 0.4 ms |
| opencollective.com/_next/static/chunks/main-509d937f6c6b2d75.js | 144 ms | 121 ms | 18 ms |
| opencollective.com/_next/static/chunks/i18n-messages-en-json.18046a978ba7d5a6.js | 88 ms | 1.4 ms | 86 ms |
| opencollective.com/_next/static/chunks/1321-d9be0253e305e9b9.js | 87 ms | 72 ms | 15 ms |
Consider reducing the time spent parsing, compiling and executing JS. You may find delivering smaller JS payloads helps with this. Learn how to minimize main-thread work
Performance issues directly impact user engagement and conversion rates.
| Category | Time Spent |
|---|---|
| Script Evaluation | 1.8 s |
| Other | 667 ms |
| Script Parsing & Compilation | 504 ms |
| Style & Layout | 353 ms |
| Parse HTML & CSS | 51 ms |
| Rendering | 44 ms |
| Garbage Collection | 24 ms |
Large network payloads cost users real money and are highly correlated with long load times. Learn how to reduce payload sizes.
Performance issues directly impact user engagement and conversion rates.
More information about the performance of your application. These numbers don't directly affect the Performance score.
These checks highlight opportunities to improve the accessibility of your web app. Automatic detection can only detect a subset of issues and does not guarantee the accessibility of your web app, so manual testing is also encouraged.
When a button doesn't have an accessible name, screen readers announce it as "button", making it unusable for users who rely on screen readers. Learn how to make buttons more accessible.
Performance issues directly impact user engagement and conversion rates.
| Failing Elements |
|---|
English
(100%) div.xl:flex > div.max-w-xs > div.relative > button.flex |
These are opportunities to improve the semantics of the controls in your application. This may enhance the experience for users of assistive technology, like a screen reader.
Disabling zooming is problematic for users with low vision who rely on screen magnification to properly see the contents of a web page. Learn more about the viewport meta tag.
Performance issues directly impact user engagement and conversion rates.
| Failing Elements |
|---|
head > meta head > meta |
These items highlight common accessibility best practices.
Image display dimensions should match natural aspect ratio. Learn more about image aspect ratio.
Performance issues directly impact user engagement and conversion rates.
| URL | Aspect Ratio (Displayed) | Aspect Ratio (Actual) | |
|---|---|---|---|
div.flex > div.relative > div.absolute > img.h-6 div.flex > div.relative > div.absolute > img.h-6 | /_next/image?url=%2Fstatic%2Fimages%2Fsubtitle-green.png&... | 314 x 24 (13.08) | 720 x 64 (11.25) |
Source maps translate minified code to the original source code. This helps developers debug in production. In addition, Lighthouse is able to provide further insights. Consider deploying source maps to take advantage of these benefits. Learn more about source maps.
Performance issues directly impact user engagement and conversion rates.
These checks ensure that your page is following basic search engine optimization advice. There are many additional factors Lighthouse does not score here that may affect your search ranking, including performance on Core Web Vitals. Learn more about Google Search Essentials.
Industry-standard audits powered by Google Lighthouse. — Desktop
Key metrics that affect user experience. — Desktop
First Contentful Paint First Contentful Paint — how long until the browser renders the first piece of content. Under 1.8s is good.
468 ms
Largest Contentful Paint Largest Contentful Paint — how long until the largest visible element loads. Under 2.5s is good.
3.15 s
Total Blocking Time Total Blocking Time — total time the main thread was blocked, preventing user input. Under 200ms is good.
101 ms
Cumulative Layout Shift Cumulative Layout Shift — measures visual stability. How much the page layout shifts during loading. Under 0.1 is good.
0.184
Speed Index Speed Index — how quickly content is visually displayed during load. Under 3.4s is good.
540 ms
Time to Interactive Time to Interactive — how long until the page is fully interactive and responds to user input. Under 3.8s is good.
3.34 s
Audit breakdown by category with detailed findings.
Remove large, duplicate JavaScript modules from bundles to reduce unnecessary bytes consumed by network activity.
Performance issues directly impact user engagement and conversion rates.
Polyfills and transforms enable older browsers to use new JavaScript features. However, many aren't necessary for modern browsers. Consider modifying your JavaScript build process to not transpile Baseline features, unless you know you must support older browsers. Learn why most sites can deploy ES6+ code without transpiling
Shipping ES5 transpiled code to modern browsers wastes bytes — every user with an evergreen browser pays for compatibility you don't need.
Most users today run browsers that natively support ES6+, async/await, optional chaining, and the rest of modern JavaScript. Transpiling to ES5 'just in case' adds 20-40% to your bundle for no benefit. Configure your build to target a modern browserslist, or ship a differential bundle pair (modern + legacy) with the module/nomodule pattern.
Source: Google web.dev / Lighthouse
3rd party code can significantly impact load performance. Reduce and defer loading of 3rd party code to prioritize your page's content.
Performance issues directly impact user engagement and conversion rates.
A long cache lifetime can speed up repeat visits to your page. Learn more about caching.
Performance issues directly impact user engagement and conversion rates.
| Request | Cache TTL | Transfer Size |
|---|---|---|
| opencollective.com/static/images/ofico/ofico-logo.png | 86400.0 s | 98.3 KiB |
| opencollective.com/static/images/ofico/raft-logo.png | 86400.0 s | 60.8 KiB |
| opencollective.com/static/images/ofico/giftcollective-logo.png | 86400.0 s | 43.7 KiB |
| opencollective.com/static/images/ofico/scn-logo.png | 86400.0 s | 28.2 KiB |
| opencollective.com/static/images/ofico/oce-logo.png | 86400.0 s | 16.2 KiB |
| /beacon.min.js/v8c78df7c7c0f484497ecbca7046644da177152312... | 86400.0 s | 10.7 KiB |
| opencollective.com/static/images/ofico/osc-logo.png | 86400.0 s | 7.1 KiB |
| opencollective.com/static/images/opencollectivelogo-footer-n.svg | 86400.0 s | 3.9 KiB |
| opencollective.com/static/images/logotype.svg | 86400.0 s | 3.7 KiB |
Layout shifts occur when elements move absent any user interaction. Investigate the causes of layout shifts, such as elements being added, removed, or their fonts changing as the page loads.
Performance issues directly impact user engagement and conversion rates.
A forced reflow occurs when JavaScript queries geometric properties (such as offsetWidth) after styles have been invalidated by a change to the DOM state. This can result in poor performance. Learn more about forced reflows and possible mitigations.
Performance issues directly impact user engagement and conversion rates.
Reducing the download time of images can improve the perceived load time of the page and LCP. Learn more about optimizing image size
Performance issues directly impact user engagement and conversion rates.
| URL | Resource Size | Est Savings | |
|---|---|---|---|
main.sc-8eca4c6e-0 > div.relative > div.absolute > img.h-full main.sc-8eca4c6e-0 > div.relative > div.absolute > img.h-full | /_next/image?url=%2Fstatic%2Fimages%2Fblue-watercolor-bg.... | 848.5 KiB | 679.4 KiB |
Collaborative Money Management div.mt-20 > div.flex > div.my-4 > img | /_next/image?url=%2Fstatic%2Fimages%2Fhero-illustration.p... | 411.4 KiB | 362.0 KiB |
Raft Foundation background div.mb-12 > a.w-full > div.relative > img.object-cover | /_next/image?url=%2Fstatic%2Fimages%2Fofico%2Fraft-bg.png... | 197.7 KiB | 185.5 KiB |
div.mx-auto > h2.mb-8 > a.underline > div.sc-d3b1f0c-0 div.mx-auto > h2.mb-8 > a.underline > div.sc-d3b1f0c-0 | opencollective.com/static/images/ofico/ofico-logo.png | 97.4 KiB | 86.8 KiB |
div.mx-auto > div.relative > div.absolute > img.object-cover div.mx-auto > div.relative > div.absolute > img.object-cover | /_next/image?url=%2Fstatic%2Fimages%2Fgreen-watercolor-bg... | 90.8 KiB | 27.0 KiB |
div.flex > div.relative > div.absolute > img.h-6 div.flex > div.relative > div.absolute > img.h-6 | /_next/image?url=%2Fstatic%2Fimages%2Fsubtitle-green.png&... | 22.2 KiB | 20.6 KiB |
a.w-full > div.relative > div.relative > div.sc-d3b1f0c-0 a.w-full > div.relative > div.relative > div.sc-d3b1f0c-0 | opencollective.com/static/images/ofico/raft-logo.png | 60.0 KiB | 17.3 KiB |
Social Change Nest background div.mb-12 > a.w-full > div.relative > img.object-cover | /_next/image?url=%2Fstatic%2Fimages%2Fofico%2Fscn-bg.png&... | 18.6 KiB | 6.7 KiB |
div.flex > div.relative > div.absolute > img.w-full div.flex > div.relative > div.absolute > img.w-full | /_next/image?url=%2Fstatic%2Fimages%2Fsubtitle-pink.png&w... | 12.4 KiB | 4.9 KiB |
a.w-full > div.relative > div.relative > div.sc-d3b1f0c-0 a.w-full > div.relative > div.relative > div.sc-d3b1f0c-0 | opencollective.com/static/images/ofico/oce-logo.png | 15.4 KiB | 4.7 KiB |
Optimize LCP by making the LCP image discoverable from the HTML immediately, and avoiding lazy-loading
Performance issues directly impact user engagement and conversion rates.
These insights are also available in the Chrome DevTools Performance Panel - record a trace to view more detailed information.
These are the largest layout shifts observed on the page. Each table item represents a single layout shift, and shows the element that shifted the most. Below each item are possible root causes that led to the layout shift. Some of these layout shifts may not be included in the CLS metric value due to windowing. Learn how to improve CLS
Performance issues directly impact user engagement and conversion rates.
| Element | Layout shift score |
|---|---|
Collaborative Money Management
We provide the infrastructure for effective fin… div.flex > main.sc-8eca4c6e-0 > div.mt-20 > div.flex | 0.184 |
Sign Up
Log In header > div.grid > div.flex > div.flex | 0.000 |
Time to Interactive is the amount of time it takes for the page to become fully interactive. Learn more about the Time to Interactive metric.
Performance issues directly impact user engagement and conversion rates.
The maximum potential First Input Delay that your users could experience is the duration of the longest task. Learn more about the Maximum Potential First Input Delay metric.
Performance issues directly impact user engagement and conversion rates.
Reduce unused JavaScript and defer loading scripts until they are required to decrease bytes consumed by network activity. Learn how to reduce unused JavaScript.
Multi-megabyte JavaScript bundles delay every interactive feature on the page.
This is the Lighthouse audit fired when too much JS is shipped relative to what executes. The fix isn't a config flag — it requires bundle analysis (webpack-bundle-analyzer, rollup-plugin-visualizer), splitting routes into chunks, lazy-loading off-screen components, and removing unused dependencies. Fundamentally different from minification: minifying reduces byte count, this reduces what's downloaded at all.
Source: Google web.dev / Lighthouse
| URL | Transfer Size | Est Savings |
|---|---|---|
| opencollective.com/_next/static/chunks/appCommon-8ef9f2ad60d02f5d.js | 469.8 KiB | 297.3 KiB |
| opencollective.com/_next/static/chunks/framework-859673bda8a51a7d.js | 114.0 KiB | 78.6 KiB |
| opencollective.com/_next/static/chunks/1321-d9be0253e305e9b9.js | 122.6 KiB | 56.3 KiB |
| opencollective.com/_next/static/chunks/1586-19927f5c8b6f7147.js | 30.0 KiB | 24.2 KiB |
| opencollective.com/_next/static/chunks/435-859c19df3b862776.js | 25.9 KiB | 21.2 KiB |
| opencollective.com/_next/static/chunks/8160-a466f96e1bf8db74.js | 23.1 KiB | 20.1 KiB |
Large network payloads cost users real money and are highly correlated with long load times. Learn how to reduce payload sizes.
Performance issues directly impact user engagement and conversion rates.
More information about the performance of your application. These numbers don't directly affect the Performance score.
These checks highlight opportunities to improve the accessibility of your web app. Automatic detection can only detect a subset of issues and does not guarantee the accessibility of your web app, so manual testing is also encouraged.
When a button doesn't have an accessible name, screen readers announce it as "button", making it unusable for users who rely on screen readers. Learn how to make buttons more accessible.
Performance issues directly impact user engagement and conversion rates.
| Failing Elements |
|---|
English
(100%) div.xl:flex > div.max-w-xs > div.relative > button.flex |
These are opportunities to improve the semantics of the controls in your application. This may enhance the experience for users of assistive technology, like a screen reader.
Screen readers have a specific way of announcing lists. Ensuring proper list structure aids screen reader output. Learn more about proper list structure.
Performance issues directly impact user engagement and conversion rates.
| Failing Elements |
|---|
Platform
Solutions
Resources
Search div.grid > div.flex > div.hidden > ul.m-0 |
These are opportunities to improve the experience of reading tabular or list data using assistive technology, like a screen reader.
Disabling zooming is problematic for users with low vision who rely on screen magnification to properly see the contents of a web page. Learn more about the viewport meta tag.
Performance issues directly impact user engagement and conversion rates.
| Failing Elements |
|---|
head > meta head > meta |
These items highlight common accessibility best practices.
Image display dimensions should match natural aspect ratio. Learn more about image aspect ratio.
Performance issues directly impact user engagement and conversion rates.
| URL | Aspect Ratio (Displayed) | Aspect Ratio (Actual) | |
|---|---|---|---|
div.flex > div.relative > div.absolute > img.h-6 div.flex > div.relative > div.absolute > img.h-6 | /_next/image?url=%2Fstatic%2Fimages%2Fsubtitle-green.png&... | 410 x 24 (17.08) | 720 x 64 (11.25) |
Source maps translate minified code to the original source code. This helps developers debug in production. In addition, Lighthouse is able to provide further insights. Consider deploying source maps to take advantage of these benefits. Learn more about source maps.
Performance issues directly impact user engagement and conversion rates.
These checks ensure that your page is following basic search engine optimization advice. There are many additional factors Lighthouse does not score here that may affect your search ranking, including performance on Core Web Vitals. Learn more about Google Search Essentials.
Send Feedback