United Stated · Santa Clara Completed: Apr 4, 2026 16:23 UTC
Mobile 375 × 812
Desktop 1440 × 900
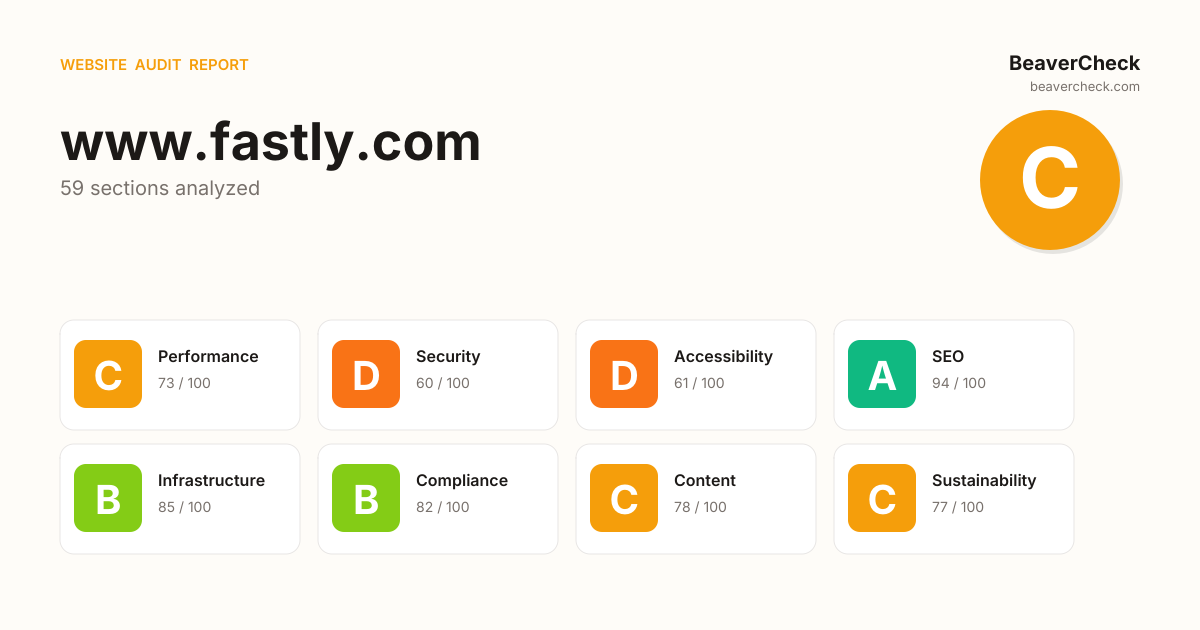
Score: 72 / 100
Based on 8 categories, 0 sections
The overall score is a weighted average of individual category scores. Categories with more impact on user experience and security carry more weight.
Weights reflect general web best practices. Individual needs may differ.
Content-Security-Policy header is missing
No Content-Security-Policy header found
10 button(s) with no accessible text
7 link(s) with no accessible text
165 HTTP requests — consider bundling or reducing
[](https://beavercheck.com/results/f2e91a06-3972-4a87-b1a2-a6f49114941a)<a href="https://beavercheck.com/results/f2e91a06-3972-4a87-b1a2-a6f49114941a"><img src="https://beavercheck.com/badge?url=https%3A%2F%2Fwww.fastly.com" alt="BeaverCheck Score"></a>https://beavercheck.com/badge?url=https%3A%2F%2Fwww.fastly.comThis badge auto-updates with your latest scan result.
Thanks for your feedback!
Industry-standard audits powered by Google Lighthouse.
Key metrics that affect user experience.
First Contentful Paint First Contentful Paint — how long until the browser renders the first piece of content. Under 1.8s is good.
3.33 s
Largest Contentful Paint Largest Contentful Paint — how long until the largest visible element loads. Under 2.5s is good.
16.09 s
Total Blocking Time Total Blocking Time — total time the main thread was blocked, preventing user input. Under 200ms is good.
2.18 s
Cumulative Layout Shift Cumulative Layout Shift — measures visual stability. How much the page layout shifts during loading. Under 0.1 is good.
0.041
Speed Index Speed Index — how quickly content is visually displayed during load. Under 3.4s is good.
6.23 s
Time to Interactive Time to Interactive — how long until the page is fully interactive and responds to user input. Under 3.8s is good.
22.26 s
Audit breakdown by category with detailed findings.
Remove large, duplicate JavaScript modules from bundles to reduce unnecessary bytes consumed by network activity.
Polyfills and transforms enable older browsers to use new JavaScript features. However, many aren't necessary for modern browsers. Consider modifying your JavaScript build process to not transpile Baseline features, unless you know you must support older browsers. Learn why most sites can deploy ES6+ code without transpiling
3rd party code can significantly impact load performance. Reduce and defer loading of 3rd party code to prioritize your page's content.
A long cache lifetime can speed up repeat visits to your page. Learn more about caching.
A forced reflow occurs when JavaScript queries geometric properties (such as offsetWidth) after styles have been invalidated by a change to the DOM state. This can result in poor performance. Learn more about forced reflows and possible mitigations.
Reducing the download time of images can improve the perceived load time of the page and LCP. Learn more about optimizing image size
| URL | Resource Size | Est Savings | |
|---|---|---|---|
div.kj3auh1 > div.kj3auh2 > div.kj3auh9 > img.kj3auha div.kj3auh1 > div.kj3auh2 > div.kj3auh9 > img.kj3auha | /cimages/ocb1q9kflo7k/lTEV5zKHt0yMaC6wyjhWa/bc75913d91489... | 85.0 KiB | 32.7 KiB |
fastly-globe div.kxsh863 > div.ebwo3s0 > div.ebwo3s1 > img | /cimages/ocb1q9kflo7k/1r4vSqbB26Qxu3LWfQ96ik/102e711409f6... | 32.6 KiB | 17.0 KiB |
Avoid chaining critical requests by reducing the length of chains, reducing the download size of resources, or deferring the download of unnecessary resources to improve page load.
Consider setting font-display to swap or optional to ensure text is consistently visible. swap can be further optimized to mitigate layout shifts with font metric overrides.
| URL | Est Savings |
|---|---|
| fastlyinc.widget.insent.ai/Rubik.woff2 | 5.0 ms |
These insights are also available in the Chrome DevTools Performance Panel - record a trace to view more detailed information.
Time to Interactive is the amount of time it takes for the page to become fully interactive. Learn more about the Time to Interactive metric.
The maximum potential First Input Delay that your users could experience is the duration of the longest task. Learn more about the Maximum Potential First Input Delay metric.
Reduce unused JavaScript and defer loading scripts until they are required to decrease bytes consumed by network activity. Learn how to reduce unused JavaScript.
| URL | Transfer Size | Est Savings |
|---|---|---|
| www.fastly.com/metrics/gtm/?id=G-ETDRC9QJ6S&cx=c>m=4e6411 | 178.5 KiB | 69.7 KiB |
| cdn.cookielaw.org/scripttemplates/202601.1.0/otBannerSdk.js | 126.9 KiB | 67.7 KiB |
| www.fastly.com/metrics/gtm/?id=GTM-W9FKFHD | 182.5 KiB | 67.0 KiB |
| www.fastly.com/metrics/gtm/?id=AW-982297532&cx=c>m=4e6411 | 150.9 KiB | 61.1 KiB |
| www.fastly.com/b5d5c390-03644ae6f4353bedd82b.js | 67.2 KiB | 55.2 KiB |
| www.fastly.com/96a5c58d-064da3f07aef95a05dea.js | 84.8 KiB | 50.6 KiB |
| connect.facebook.net/en_US/fbevents.js | 94.8 KiB | 36.4 KiB |
| cdn.intellimize.co/snippet/117419923.js | 103.2 KiB | 35.2 KiB |
| www.fastly.com/app-15c697f1dd9686141621.js | 70.4 KiB | 23.2 KiB |
Consider reducing the time spent parsing, compiling, and executing JS. You may find delivering smaller JS payloads helps with this. Learn how to reduce Javascript execution time.
Consider reducing the time spent parsing, compiling and executing JS. You may find delivering smaller JS payloads helps with this. Learn how to minimize main-thread work
| Category | Time Spent |
|---|---|
| Script Evaluation | 4.9 s |
| Other | 2.1 s |
| Style & Layout | 1.0 s |
| Script Parsing & Compilation | 608 ms |
| Rendering | 184 ms |
| Parse HTML & CSS | 178 ms |
| Garbage Collection | 131 ms |
Many navigations are performed by going back to a previous page, or forwards again. The back/forward cache (bfcache) can speed up these return navigations. Learn more about the bfcache
| Failure reason | Failure type |
|---|---|
| The page has an unload handler in the main frame. | Actionable |
Reduce unused rules from stylesheets and defer CSS not used for above-the-fold content to decrease bytes consumed by network activity. Learn how to reduce unused CSS.
| URL | Transfer Size | Est Savings |
|---|---|---|
| .mh9g3z0{bottom:0;box-sizing:content-box;padding:1rem;position:fixed;z-index:1001} … | 81.6 KiB | 71.7 KiB |
| 21.4 KiB | 18.5 KiB |
Large network payloads cost users real money and are highly correlated with long load times. Learn how to reduce payload sizes.
More information about the performance of your application. These numbers don't directly affect the Performance score.
These checks highlight opportunities to improve the accessibility of your web app. Automatic detection can only detect a subset of issues and does not guarantee the accessibility of your web app, so manual testing is also encouraged.
When a button doesn't have an accessible name, screen readers announce it as "button", making it unusable for users who rely on screen readers. Learn how to make buttons more accessible.
| Failing Elements |
|---|
div._3p4evt0 > div._3p4evt1 > div._3p4evt2 > button._3p4evt4 div._3p4evt0 > div._3p4evt1 > div._3p4evt2 > button._3p4evt4 |
div._3p4evt0 > div._3p4evt1 > div._3p4evt2 > button._3p4evt4 div._3p4evt0 > div._3p4evt1 > div._3p4evt2 > button._3p4evt4 |
div._3p4evt0 > div._3p4evt1 > div._3p4evt2 > button._3p4evt4 div._3p4evt0 > div._3p4evt1 > div._3p4evt2 > button._3p4evt4 |
div._3p4evt0 > div._3p4evt1 > div._3p4evt2 > button._3p4evt4 div._3p4evt0 > div._3p4evt1 > div._3p4evt2 > button._3p4evt4 |
div.xg4goqs > div.xg4goqw > div.jjcfm4 > button.jjcfm5 div.xg4goqs > div.xg4goqw > div.jjcfm4 > button.jjcfm5 |
div.xg4goqs > div.xg4goqw > div.jjcfm4 > button.jjcfm5 div.xg4goqs > div.xg4goqw > div.jjcfm4 > button.jjcfm5 |
Link text (and alternate text for images, when used as links) that is discernible, unique, and focusable improves the navigation experience for screen reader users. Learn how to make links accessible.
| Failing Elements |
|---|
div.xg4goqd > div.xg4goqg > div.xg4goqj > a.jxvqufi div.xg4goqd > div.xg4goqg > div.xg4goqj > a.jxvqufi |
These are opportunities to improve the semantics of the controls in your application. This may enhance the experience for users of assistive technology, like a screen reader.
Low-contrast text is difficult or impossible for many users to read. Learn how to provide sufficient color contrast.
| Failing Elements |
|---|
as of December 31, 2022 div.j1bsna4 > ul.j1bsna0 > li._6twr8h6 > div._1j2kes810y |
as of July 31, 2023 div.j1bsna4 > ul.j1bsna0 > li._6twr8h6 > div._1j2kes810y |
as of March 2023 div.j1bsna4 > ul.j1bsna0 > li._6twr8h6 > div._1j2kes810y |
as of December 31, 2025 div.j1bsna4 > ul.j1bsna0 > li._6twr8h6 > div._1j2kes810y |
These are opportunities to improve the legibility of your content.
Properly ordered headings that do not skip levels convey the semantic structure of the page, making it easier to navigate and understand when using assistive technologies. Learn more about heading order.
| Failing Elements |
|---|
More announcements main > div._1y3v4p30 > div._1y3v4p31 > h6.nbbs0e9 |
These are opportunities to improve keyboard navigation in your application.
Visible text labels that do not match the accessible name can result in a confusing experience for screen reader users. Learn more about accessible names.
| Failing Elements |
|---|
Cookie Policy div.ot-sdk-eight > div#onetrust-policy > div#onetrust-policy-text > a.ot-cookie-policy-link |
Deprecated APIs will eventually be removed from the browser. Learn more about deprecated APIs.
| Deprecation / Warning | Source |
|---|---|
| AttributionReporting | |
| Unload event listeners are deprecated and will be removed. |
Source maps translate minified code to the original source code. This helps developers debug in production. In addition, Lighthouse is able to provide further insights. Consider deploying source maps to take advantage of these benefits. Learn more about source maps.
These checks ensure that your page is following basic search engine optimization advice. There are many additional factors Lighthouse does not score here that may affect your search ranking, including performance on Core Web Vitals. Learn more about Google Search Essentials.
Descriptive link text helps search engines understand your content. Learn how to make links more accessible.
| Link destination | Link Text |
|---|---|
| learn.fastly.com/gartner-peer-insights-voice-of-customer-waap | Learn more |
Format your HTML in a way that enables crawlers to better understand your app’s content.
Industry-standard audits powered by Google Lighthouse. — Desktop
Key metrics that affect user experience. — Desktop
First Contentful Paint First Contentful Paint — how long until the browser renders the first piece of content. Under 1.8s is good.
907 ms
Largest Contentful Paint Largest Contentful Paint — how long until the largest visible element loads. Under 2.5s is good.
2.30 s
Total Blocking Time Total Blocking Time — total time the main thread was blocked, preventing user input. Under 200ms is good.
199 ms
Cumulative Layout Shift Cumulative Layout Shift — measures visual stability. How much the page layout shifts during loading. Under 0.1 is good.
0.008
Speed Index Speed Index — how quickly content is visually displayed during load. Under 3.4s is good.
1.66 s
Time to Interactive Time to Interactive — how long until the page is fully interactive and responds to user input. Under 3.8s is good.
4.73 s
Audit breakdown by category with detailed findings.
Remove large, duplicate JavaScript modules from bundles to reduce unnecessary bytes consumed by network activity.
Polyfills and transforms enable older browsers to use new JavaScript features. However, many aren't necessary for modern browsers. Consider modifying your JavaScript build process to not transpile Baseline features, unless you know you must support older browsers. Learn why most sites can deploy ES6+ code without transpiling
3rd party code can significantly impact load performance. Reduce and defer loading of 3rd party code to prioritize your page's content.
A long cache lifetime can speed up repeat visits to your page. Learn more about caching.
A forced reflow occurs when JavaScript queries geometric properties (such as offsetWidth) after styles have been invalidated by a change to the DOM state. This can result in poor performance. Learn more about forced reflows and possible mitigations.
Optimize LCP by making the LCP image discoverable from the HTML immediately, and avoiding lazy-loading
Consider setting font-display to swap or optional to ensure text is consistently visible. swap can be further optimized to mitigate layout shifts with font metric overrides.
| URL | Est Savings |
|---|---|
| fastlyinc.widget.insent.ai/Rubik.woff2 | 10 ms |
Reducing the download time of images can improve the perceived load time of the page and LCP. Learn more about optimizing image size
| URL | Resource Size | Est Savings | |
|---|---|---|---|
div.kj3auh1 > div.kj3auh2 > div.kj3auh9 > img.kj3auha div.kj3auh1 > div.kj3auh2 > div.kj3auh9 > img.kj3auha | /cimages/ocb1q9kflo7k/lTEV5zKHt0yMaC6wyjhWa/bc75913d91489... | 85.0 KiB | 42.2 KiB |
div._1v7xp385 > div#5LUhl92675DwlUmQWNreZE > div._1v7xp38d > img div._1v7xp385 > div#5LUhl92675DwlUmQWNreZE > div._1v7xp38d > img | /cimages/ocb1q9kflo7k/2T9oU8g7aGx09vfElGe4fk/0ae920a41dfd... | 38.1 KiB | 34.6 KiB |
fastly-globe div.kxsh863 > div.ebwo3s0 > div.ebwo3s1 > img | /cimages/ocb1q9kflo7k/1r4vSqbB26Qxu3LWfQ96ik/102e711409f6... | 32.6 KiB | 15.4 KiB |
These insights are also available in the Chrome DevTools Performance Panel - record a trace to view more detailed information.
Time to Interactive is the amount of time it takes for the page to become fully interactive. Learn more about the Time to Interactive metric.
Reduce unused JavaScript and defer loading scripts until they are required to decrease bytes consumed by network activity. Learn how to reduce unused JavaScript.
| URL | Transfer Size | Est Savings |
|---|---|---|
| www.fastly.com/metrics/gtm/?id=G-ETDRC9QJ6S&cx=c>m=4e6411 | 178.4 KiB | 69.3 KiB |
| cdn.cookielaw.org/scripttemplates/202601.1.0/otBannerSdk.js | 126.9 KiB | 67.7 KiB |
| www.fastly.com/metrics/gtm/?id=GTM-W9FKFHD | 182.5 KiB | 67.0 KiB |
| www.fastly.com/metrics/gtm/?id=AW-982297532&cx=c>m=4e6411 | 150.9 KiB | 61.1 KiB |
| www.fastly.com/b5d5c390-03644ae6f4353bedd82b.js | 67.2 KiB | 55.2 KiB |
| www.fastly.com/96a5c58d-064da3f07aef95a05dea.js | 84.8 KiB | 50.6 KiB |
| connect.facebook.net/en_US/fbevents.js | 94.8 KiB | 36.8 KiB |
| cdn.intellimize.co/snippet/117419923.js | 103.2 KiB | 35.1 KiB |
| www.fastly.com/app-15c697f1dd9686141621.js | 70.4 KiB | 23.8 KiB |
Consider reducing the time spent parsing, compiling and executing JS. You may find delivering smaller JS payloads helps with this. Learn how to minimize main-thread work
| Category | Time Spent |
|---|---|
| Script Evaluation | 1.2 s |
| Other | 659 ms |
| Style & Layout | 425 ms |
| Rendering | 234 ms |
| Script Parsing & Compilation | 156 ms |
| Parse HTML & CSS | 46 ms |
| Garbage Collection | 32 ms |
Many navigations are performed by going back to a previous page, or forwards again. The back/forward cache (bfcache) can speed up these return navigations. Learn more about the bfcache
| Failure reason | Failure type |
|---|---|
| The page has an unload handler in the main frame. | Actionable |
Reduce unused rules from stylesheets and defer CSS not used for above-the-fold content to decrease bytes consumed by network activity. Learn how to reduce unused CSS.
| URL | Transfer Size | Est Savings |
|---|---|---|
| .mh9g3z0{bottom:0;box-sizing:content-box;padding:1rem;position:fixed;z-index:1001} … | 81.6 KiB | 69.7 KiB |
| 21.4 KiB | 18.4 KiB |
Large network payloads cost users real money and are highly correlated with long load times. Learn how to reduce payload sizes.
More information about the performance of your application. These numbers don't directly affect the Performance score.
These checks highlight opportunities to improve the accessibility of your web app. Automatic detection can only detect a subset of issues and does not guarantee the accessibility of your web app, so manual testing is also encouraged.
Low-contrast text is difficult or impossible for many users to read. Learn how to provide sufficient color contrast.
| Failing Elements |
|---|
as of December 31, 2022 div.j1bsna4 > ul.j1bsna0 > li._6twr8h6 > div._1j2kes810y |
as of July 31, 2023 div.j1bsna4 > ul.j1bsna0 > li._6twr8h6 > div._1j2kes810y |
as of March 2023 div.j1bsna4 > ul.j1bsna0 > li._6twr8h6 > div._1j2kes810y |
as of December 31, 2025 div.j1bsna4 > ul.j1bsna0 > li._6twr8h6 > div._1j2kes810y |
These are opportunities to improve the legibility of your content.
Properly ordered headings that do not skip levels convey the semantic structure of the page, making it easier to navigate and understand when using assistive technologies. Learn more about heading order.
| Failing Elements |
|---|
More announcements main > div._1y3v4p30 > div._1y3v4p31 > h6.nbbs0e9 |
These are opportunities to improve keyboard navigation in your application.
Link text (and alternate text for images, when used as links) that is discernible, unique, and focusable improves the navigation experience for screen reader users. Learn how to make links accessible.
| Failing Elements |
|---|
div.xg4goqd > div.xg4goqg > div.xg4goqj > a.jxvqufi div.xg4goqd > div.xg4goqg > div.xg4goqj > a.jxvqufi |
These are opportunities to improve the semantics of the controls in your application. This may enhance the experience for users of assistive technology, like a screen reader.
Visible text labels that do not match the accessible name can result in a confusing experience for screen reader users. Learn more about accessible names.
| Failing Elements |
|---|
SaaS/PaaS div.xg4goqb > div.xg4goqs > div.xg4goqx > button.xg4goqt |
Digital publishing div.xg4goqb > div.xg4goqs > div.xg4goqx > button.xg4goqt |
Digital publishing div.xg4goqb > div.xg4goqs > div.xg4goqx > button.xg4goqt |
eCommerce div.xg4goqb > div.xg4goqs > div.xg4goqx > button.xg4goqt |
Cookie Policy div.ot-sdk-eight > div#onetrust-policy > div#onetrust-policy-text > a.ot-cookie-policy-link |
Deprecated APIs will eventually be removed from the browser. Learn more about deprecated APIs.
| Deprecation / Warning | Source |
|---|---|
| AttributionReporting | |
| Unload event listeners are deprecated and will be removed. |
Source maps translate minified code to the original source code. This helps developers debug in production. In addition, Lighthouse is able to provide further insights. Consider deploying source maps to take advantage of these benefits. Learn more about source maps.
These checks ensure that your page is following basic search engine optimization advice. There are many additional factors Lighthouse does not score here that may affect your search ranking, including performance on Core Web Vitals. Learn more about Google Search Essentials.
Descriptive link text helps search engines understand your content. Learn how to make links more accessible.
| Link destination | Link Text |
|---|---|
| learn.fastly.com/gartner-peer-insights-voice-of-customer-waap | Learn more |
Format your HTML in a way that enables crawlers to better understand your app’s content.
Send Feedback