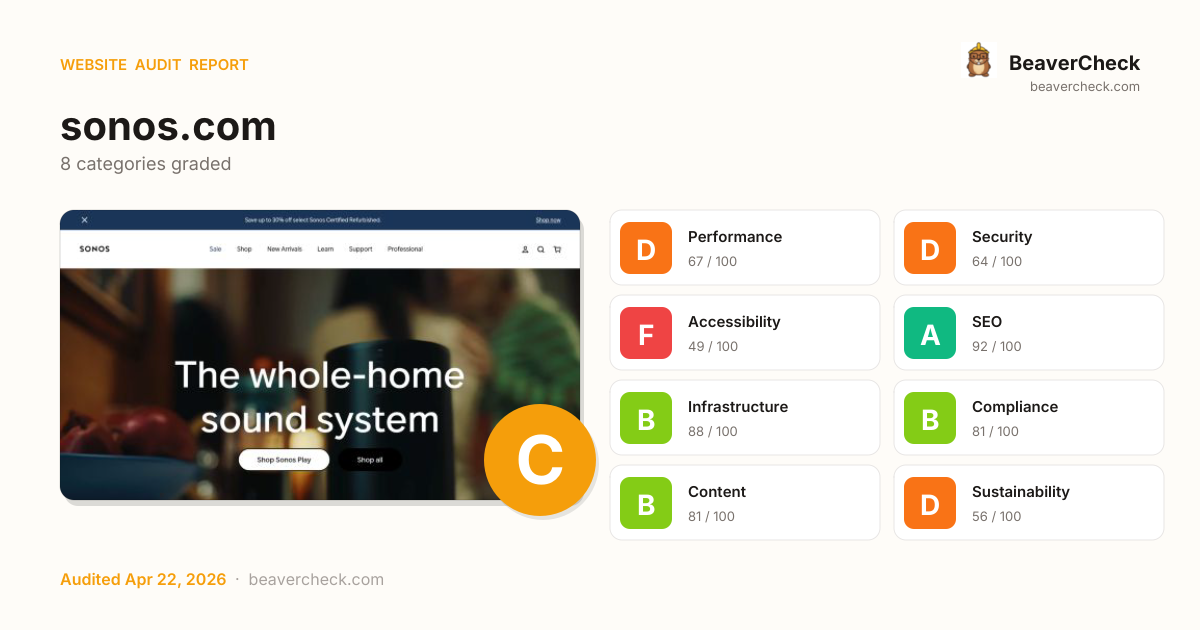
Mobile 375 × 812

Desktop 1440 × 900

Score: 70 / 100
Based on 8 categories, 0 sections
Room to improve — your 4.2s load time is above Google's 2.5s 'Good' threshold.
Several missing protections leave your users and data exposed.
Major barriers for users with disabilities — up to 15% of your audience.
Well-optimized for search — your content is discoverable.
Solid infrastructure — fast server responses across the board.
Mostly compliant — a few items need attention.
Good content signals with minor gaps.
Heavier than average — reducing page weight saves energy and bandwidth.
The overall score is a weighted average of individual category scores. Categories with more impact on user experience and security carry more weight.
Weights reflect general web best practices. Individual needs may differ.
Content-Security-Policy header is missing
Security gaps expose your site and users to attacks, eroding trust.
Cookie 'bm_sz' is missing the Secure flag
Security gaps expose your site and users to attacks, eroding trust.
No Content-Security-Policy header found
Security gaps expose your site and users to attacks, eroding trust.
Page weighs 14.1 MB (5.6 MB transferred)
Performance issues directly impact user engagement and conversion rates.
2 image(s) missing alt attribute
Accessibility issues exclude users with disabilities — up to 15% of your potential audience.
High impact, low effort — start here.
High impact, requires investment.
Small gains, minimal effort.
Nothing in this quadrant — good news.
Low impact, high effort — do last.
Nothing in this quadrant — good news.
[](https://beavercheck.com/results/f42ca4d7-094d-4829-acfe-115faf08c538)<a href="https://beavercheck.com/results/f42ca4d7-094d-4829-acfe-115faf08c538"><img src="https://beavercheck.com/badge?url=https%3A%2F%2Fsonos.com" alt="BeaverCheck Score"></a>https://beavercheck.com/badge?url=https%3A%2F%2Fsonos.comThis badge auto-updates with your latest scan result.
Your site performs reasonably well, but a few targeted fixes could meaningfully improve results. Your LCP of 4.2s exceeds Google's 2.5s 'Good' threshold and the 1 performance issue below directly contributes to it. Accessibility issues exclude users who rely on assistive technology — an estimated 15% of your potential audience. Addressing the critical issues below would have the most immediate impact on your user trust.
6 barrier(s) likely increasing bounce by ~29%.
Page takes 4.2s to load
+12% bounceUsers abandon at ~3s — you're 1.7s over the 2.5s threshold
Fix: Optimize render-blocking resources, preload the hero image, and compress images
Page feels frozen for 6.8s
+5% bounceClicks on the primary CTA are ignored while JavaScript runs
Fix: Break up long tasks; defer non-critical JavaScript to post-hydration
No Content-Security-Policy header
+1% bounceHigher XSS blast radius — one compromised script can exfiltrate the checkout form
Fix: Ship a reporting-only CSP first, then enforce once violations are clean
No structured data
+2% bounceNo rich-result eligibility in Google — lower SERP CTR vs competitors with stars and prices
Fix: Add JSON-LD for your page type (Product, Article, FAQPage, LocalBusiness, …)
7 link(s) with generic text ("click here", "read more")
+1% bounceScreen-reader users navigating by link list see no context — and search engines can't infer relevance
Fix: Rewrite with descriptive phrases that identify the destination
5 broken link(s) on the page
+5% bounceClicks land on 404s — trust drops and the session often ends
Fix: Fix or remove the broken destinations surfaced on the Content tab
Preliminary CRO audit — each barrier links to the tab with detailed analysis.
$500 investment → $3,113/month returns + USD 157,500 risk avoided
$500
5h · 5 findings
$3,113 /mo
~$37,350 / year
USD 157,500
if kept compliant
$150 — in quick wins — start here for the fastest payback
Figures combine localized regulatory fine ceilings, search/conversion value priced against local CPC, and bandwidth waste estimates. Results depend on implementation quality and audience composition. Not legal or financial advice.
5.0 developer hours at $100/hr
Based on United States rates ($100/hr)
Start here for the best return on investment
$13,126 / month at risk
~$157,517 / year if left unfixed
$157,500
+10 more
$1.42 /mo
17747.7 MB/mo × 0.080 USD/GB
Compliance figures represent the statutory maximum fine for the most severe triggered category, capped per regulation — not the sum of per-finding penalties. Based on published regulatory fine ranges. This is not legal advice.
Unique monthly visitors from your analytics
Purchases, signups, or key actions
Optional — for revenue estimation
more engaged visitors from reduced bounce
Fix 5 critical issues to capture this value
Based on Google/Deloitte research ("Milliseconds Make Millions") showing a ~7% bounce rate increase per additional second of LCP above the 2.5s "Good" threshold.
Your site's LCP: → estimated after fixes.
These are estimates based on industry research — actual results vary
Your data stays in your browser — nothing is sent to our servers
Thanks for your feedback!
We'll use a cached audit if available, or offer to scan.
Industry-standard audits powered by Google Lighthouse.
Key metrics that affect user experience.
First Contentful Paint First Contentful Paint — how long until the browser renders the first piece of content. Under 1.8s is good.
2.70 s
Largest Contentful Paint Largest Contentful Paint — how long until the largest visible element loads. Under 2.5s is good.
4.15 s
Total Blocking Time Total Blocking Time — total time the main thread was blocked, preventing user input. Under 200ms is good.
6.79 s
Cumulative Layout Shift Cumulative Layout Shift — measures visual stability. How much the page layout shifts during loading. Under 0.1 is good.
0.002
Speed Index Speed Index — how quickly content is visually displayed during load. Under 3.4s is good.
14.41 s
Time to Interactive Time to Interactive — how long until the page is fully interactive and responds to user input. Under 3.8s is good.
30.07 s
Audit breakdown by category with detailed findings.
Remove large, duplicate JavaScript modules from bundles to reduce unnecessary bytes consumed by network activity.
Performance issues directly impact user engagement and conversion rates.
Polyfills and transforms enable older browsers to use new JavaScript features. However, many aren't necessary for modern browsers. Consider modifying your JavaScript build process to not transpile Baseline features, unless you know you must support older browsers. Learn why most sites can deploy ES6+ code without transpiling
Shipping ES5 transpiled code to modern browsers wastes bytes — every user with an evergreen browser pays for compatibility you don't need.
Most users today run browsers that natively support ES6+, async/await, optional chaining, and the rest of modern JavaScript. Transpiling to ES5 'just in case' adds 20-40% to your bundle for no benefit. Configure your build to target a modern browserslist, or ship a differential bundle pair (modern + legacy) with the module/nomodule pattern.
Source: Google web.dev / Lighthouse
3rd party code can significantly impact load performance. Reduce and defer loading of 3rd party code to prioritize your page's content.
Performance issues directly impact user engagement and conversion rates.
Your first network request is the most important. Reduce its latency by avoiding redirects, ensuring a fast server response, and enabling text compression.
Performance issues directly impact user engagement and conversion rates.
A forced reflow occurs when JavaScript queries geometric properties (such as offsetWidth) after styles have been invalidated by a change to the DOM state. This can result in poor performance. Learn more about forced reflows and possible mitigations.
Performance issues directly impact user engagement and conversion rates.
Optimize LCP by making the LCP image discoverable from the HTML immediately, and avoiding lazy-loading
Performance issues directly impact user engagement and conversion rates.
Avoid chaining critical requests by reducing the length of chains, reducing the download size of resources, or deferring the download of unnecessary resources to improve page load.
Performance issues directly impact user engagement and conversion rates.
A long cache lifetime can speed up repeat visits to your page. Learn more about caching.
Performance issues directly impact user engagement and conversion rates.
Reducing the download time of images can improve the perceived load time of the page and LCP. Learn more about optimizing image size
Performance issues directly impact user engagement and conversion rates.
| URL | Resource Size | Est Savings | |
|---|---|---|---|
Person riding a bicycle with a black Sonos Play speaker in the front basket div > div#_0108f2b45991 > figure.relative > img | /images/znqtjj88/production/effaa2a79865dd4b84e2a471da38e... | 86.4 KiB | 48.4 KiB |
Person handing a white Sonos Play speaker over a balcony down to a friend section.order-none > div#_b13b7a50b991 > figure.relative > img | /images/znqtjj88/production/0f65872c89f9cc87473f175f7518a... | 63.4 KiB | 13.2 KiB |
These insights are also available in the Chrome DevTools Performance Panel - record a trace to view more detailed information.
Time to Interactive is the amount of time it takes for the page to become fully interactive. Learn more about the Time to Interactive metric.
Performance issues directly impact user engagement and conversion rates.
Redirects introduce additional delays before the page can be loaded. Learn how to avoid page redirects.
Performance issues directly impact user engagement and conversion rates.
| URL | Time Spent |
|---|---|
| sonos.com/ | 768 ms |
| www.sonos.com/en/home | 0.0 ms |
The maximum potential First Input Delay that your users could experience is the duration of the longest task. Learn more about the Maximum Potential First Input Delay metric.
Performance issues directly impact user engagement and conversion rates.
Reduce unused rules from stylesheets and defer CSS not used for above-the-fold content to decrease bytes consumed by network activity. Learn how to reduce unused CSS.
Performance issues directly impact user engagement and conversion rates.
| URL | Transfer Size | Est Savings |
|---|---|---|
| /_next/static/css/4be42307400234d4.css?dpl=dpl_HR77npGmmW... | 30.9 KiB | 26.9 KiB |
| 21.2 KiB | 20.9 KiB |
Reduce unused JavaScript and defer loading scripts until they are required to decrease bytes consumed by network activity. Learn how to reduce unused JavaScript.
Multi-megabyte JavaScript bundles delay every interactive feature on the page.
This is the Lighthouse audit fired when too much JS is shipped relative to what executes. The fix isn't a config flag — it requires bundle analysis (webpack-bundle-analyzer, rollup-plugin-visualizer), splitting routes into chunks, lazy-loading off-screen components, and removing unused dependencies. Fundamentally different from minification: minifying reduces byte count, this reduces what's downloaded at all.
Source: Google web.dev / Lighthouse
Consider reducing the time spent parsing, compiling, and executing JS. You may find delivering smaller JS payloads helps with this. Learn how to reduce Javascript execution time.
Performance issues directly impact user engagement and conversion rates.
Consider reducing the time spent parsing, compiling and executing JS. You may find delivering smaller JS payloads helps with this. Learn how to minimize main-thread work
Performance issues directly impact user engagement and conversion rates.
| Category | Time Spent |
|---|---|
| Script Evaluation | 13.2 s |
| Other | 2.6 s |
| Script Parsing & Compilation | 1.6 s |
| Style & Layout | 1.1 s |
| Parse HTML & CSS | 448 ms |
| Garbage Collection | 346 ms |
| Rendering | 155 ms |
Many navigations are performed by going back to a previous page, or forwards again. The back/forward cache (bfcache) can speed up these return navigations. Learn more about the bfcache
Performance issues directly impact user engagement and conversion rates.
| Failure reason | Failure type |
|---|---|
| Pages with cache-control:no-store header cannot enter back/forward cache. | Actionable |
| The page has an unload handler in a sub frame. | Actionable |
| Pages whose main resource has cache-control:no-store cannot enter back/forward cache. | Not actionable |
| Back/forward cache is disabled because some JavaScript network request received resource with Cache-Control: no-store header. | Not actionable |
Minifying JavaScript files can reduce payload sizes and script parse time. Learn how to minify JavaScript.
Performance issues directly impact user engagement and conversion rates.
| URL | Transfer Size | Est Savings |
|---|---|---|
| analytics.sonos.com/p.js | 120.0 KiB | 47.9 KiB |
Large network payloads cost users real money and are highly correlated with long load times. Learn how to reduce payload sizes.
Performance issues directly impact user engagement and conversion rates.
More information about the performance of your application. These numbers don't directly affect the Performance score.
These checks highlight opportunities to improve the accessibility of your web app. Automatic detection can only detect a subset of issues and does not guarantee the accessibility of your web app, so manual testing is also encouraged.
When a button doesn't have an accessible name, screen readers announce it as "button", making it unusable for users who rely on screen readers. Learn how to make buttons more accessible.
Performance issues directly impact user engagement and conversion rates.
| Failing Elements |
|---|
div.basis-full > div#q3fy26-earth-day-refurb > div.w-2 > button.flex div.basis-full > div#q3fy26-earth-day-refurb > div.w-2 > button.flex |
Search nav#right > ul.inline-flex > li.flex > button.flex |
Menu nav#right > ul.inline-flex > li.flex > button.flex |
Link text (and alternate text for images, when used as links) that is discernible, unique, and focusable improves the navigation experience for screen reader users. Learn how to make links accessible.
Performance issues directly impact user engagement and conversion rates.
| Failing Elements |
|---|
div.flex > ul.flex > li > a div.flex > ul.flex > li > a |
These are opportunities to improve the semantics of the controls in your application. This may enhance the experience for users of assistive technology, like a screen reader.
Properly ordered headings that do not skip levels convey the semantic structure of the page, making it easier to navigate and understand when using assistive technologies. Learn more about heading order.
Performance issues directly impact user engagement and conversion rates.
| Failing Elements |
|---|
Astonishingly clear section.lg:order-none > section.w-full > div > h3.tw-typography-h3 |
4000+ div > div.border > div.flex > h5.block |
Mix and match speakers section.order-none > section.w-full > div.mb-4 > h5.block |
Sets nav.flex > div.flex > a.flex > h6.block |
These are opportunities to improve keyboard navigation in your application.
Screen readers have a specific way of announcing lists. Ensuring proper list structure aids screen reader output. Learn more about proper list structure.
Performance issues directly impact user engagement and conversion rates.
| Failing Elements |
|---|
Home body.has-cookie-banner > header.tw-header-nav-spacing > nav#left > ul.inline-flex |
My Account body.has-cookie-banner > header.tw-header-nav-spacing > nav#right > ul.inline-flex |
These are opportunities to improve the experience of reading tabular or list data using assistive technology, like a screen reader.
Deprecated APIs will eventually be removed from the browser. Learn more about deprecated APIs.
Performance issues directly impact user engagement and conversion rates.
| Deprecation / Warning | Source |
|---|---|
| Unload event listeners are deprecated and will be removed. | |
| AttributionReporting |
Errors logged to the console indicate unresolved problems. They can come from network request failures and other browser concerns. Learn more about this errors in console diagnostic audit
Performance issues directly impact user engagement and conversion rates.
| Source | Description |
|---|---|
BrazeBanner: Error handling banner update: TypeError: t.getBooleanProperty is not a function
at https://www.sonos.com/_next/static/chunks/6186-2d88942abde18679.js?dpl=dpl_HR77npGmmWfDQznR71rQzE97oiSB:1:426
at https://www.sonos.com/_next/static/chunks/6186-2d88942abde18679.js?dpl=dpl_HR77npGmmWfDQznR71rQzE97oiSB:1:599
at iy (https://www.sonos.com/_next/static/chunks/61b5e853-8430af891c2cc329.js?dpl=dpl_HR77npGmmWfDQznR71rQzE97oiSB:1:92247)
at i8 (https://www.sonos.com/_next/static/chunks/61b5e853-8430af891c2cc329.js?dpl=dpl_HR77npGmmWfDQznR71rQzE97oiSB:1:102314)
at uc (https://www.sonos.com/_next/static/chunks/61b5e853-8430af891c2cc329.js?dpl=dpl_HR77npGmmWfDQznR71rQzE97oiSB:1:115205)
at i8 (https://www.sonos.com/_next/static/chunks/61b5e853-8430af891c2cc329.js?dpl=dpl_HR77npGmmWfDQznR71rQzE97oiSB:1:102845)
at uc (https://www.sonos.com/_next/static/chunks/61b5e853-8430af891c2cc329.js?dpl=dpl_HR77npGmmWfDQznR71rQzE97oiSB:1:115205)
at i8 (https://www.sonos.com/_next/static/chunks/61b5e853-8430af891c2cc329.js?dpl=dpl_HR77npGmmWfDQznR71rQzE97oiSB:1:102845)
at uc (https://www.sonos.com/_next/static/chunks/61b5e853-8430af891c2cc329.js?dpl=dpl_HR77npGmmWfDQznR71rQzE97oiSB:1:115205)
at i8 (https://www.sonos.com/_next/static/chunks/61b5e853-8430af891c2cc329.js?dpl=dpl_HR77npGmmWfDQznR71rQzE97oiSB:1:102301) | |
BrazeBanner: Error handling banner update: TypeError: t.getBooleanProperty is not a function
at https://www.sonos.com/_next/static/chunks/6186-2d88942abde18679.js?dpl=dpl_HR77npGmmWfDQznR71rQzE97oiSB:1:426
at https://www.sonos.com/_next/static/chunks/6186-2d88942abde18679.js?dpl=dpl_HR77npGmmWfDQznR71rQzE97oiSB:1:599
at iy (https://www.sonos.com/_next/static/chunks/61b5e853-8430af891c2cc329.js?dpl=dpl_HR77npGmmWfDQznR71rQzE97oiSB:1:92247)
at i8 (https://www.sonos.com/_next/static/chunks/61b5e853-8430af891c2cc329.js?dpl=dpl_HR77npGmmWfDQznR71rQzE97oiSB:1:102314)
at uc (https://www.sonos.com/_next/static/chunks/61b5e853-8430af891c2cc329.js?dpl=dpl_HR77npGmmWfDQznR71rQzE97oiSB:1:115205)
at i8 (https://www.sonos.com/_next/static/chunks/61b5e853-8430af891c2cc329.js?dpl=dpl_HR77npGmmWfDQznR71rQzE97oiSB:1:104534)
at uc (https://www.sonos.com/_next/static/chunks/61b5e853-8430af891c2cc329.js?dpl=dpl_HR77npGmmWfDQznR71rQzE97oiSB:1:115205)
at i8 (https://www.sonos.com/_next/static/chunks/61b5e853-8430af891c2cc329.js?dpl=dpl_HR77npGmmWfDQznR71rQzE97oiSB:1:102301)
at uc (https://www.sonos.com/_next/static/chunks/61b5e853-8430af891c2cc329.js?dpl=dpl_HR77npGmmWfDQznR71rQzE97oiSB:1:115205)
at i8 (https://www.sonos.com/_next/static/chunks/61b5e853-8430af891c2cc329.js?dpl=dpl_HR77npGmmWfDQznR71rQzE97oiSB:1:102301) | |
Error: Minified React error #418; visit https://react.dev/errors/418?args[]=HTML&args[]= for the full message or use the non-minified dev environment for full errors and additional helpful warnings.
at rX (https://www.sonos.com/_next/static/chunks/61b5e853-8430af891c2cc329.js?dpl=dpl_HR77npGmmWfDQznR71rQzE97oiSB:1:36657)
at is (https://www.sonos.com/_next/static/chunks/61b5e853-8430af891c2cc329.js?dpl=dpl_HR77npGmmWfDQznR71rQzE97oiSB:1:87558)
at sp (https://www.sonos.com/_next/static/chunks/61b5e853-8430af891c2cc329.js?dpl=dpl_HR77npGmmWfDQznR71rQzE97oiSB:1:128029)
at https://www.sonos.com/_next/static/chunks/61b5e853-8430af891c2cc329.js?dpl=dpl_HR77npGmmWfDQznR71rQzE97oiSB:1:122919
at sn (https://www.sonos.com/_next/static/chunks/61b5e853-8430af891c2cc329.js?dpl=dpl_HR77npGmmWfDQznR71rQzE97oiSB:1:123020)
at sQ (https://www.sonos.com/_next/static/chunks/61b5e853-8430af891c2cc329.js?dpl=dpl_HR77npGmmWfDQznR71rQzE97oiSB:1:149408)
at MessagePort.M (https://www.sonos.com/_next/static/chunks/3528-22399f527ed2dbbd.js?dpl=dpl_HR77npGmmWfDQznR71rQzE97oiSB:2:131186) | |
Failed to load resource: the server responded with a status of 401 () | |
js.appboycdn.com/web-sdk/6.1/braze.no-module.min.js line 339, col 149 | Uncaught TypeError: 'caller', 'callee', and 'arguments' properties may not be accessed on strict mode functions or the arguments objects for calls to them |
Source maps translate minified code to the original source code. This helps developers debug in production. In addition, Lighthouse is able to provide further insights. Consider deploying source maps to take advantage of these benefits. Learn more about source maps.
Performance issues directly impact user engagement and conversion rates.
These checks ensure that your page is following basic search engine optimization advice. There are many additional factors Lighthouse does not score here that may affect your search ranking, including performance on Core Web Vitals. Learn more about Google Search Essentials.
Descriptive link text helps search engines understand your content. Learn how to make links more accessible.
Performance issues directly impact user engagement and conversion rates.
| Link destination | Link Text |
|---|---|
| www.sonos.com/en/controller-app | Learn more |
| www.sonos.com/en/sonos-radio | Learn more |
| www.sonos.com/en/controller-app | Learn more |
| www.sonos.com/legal/privacy | More information |
Format your HTML in a way that enables crawlers to better understand your app’s content.
Industry-standard audits powered by Google Lighthouse. — Desktop
Key metrics that affect user experience. — Desktop
First Contentful Paint First Contentful Paint — how long until the browser renders the first piece of content. Under 1.8s is good.
745 ms
Largest Contentful Paint Largest Contentful Paint — how long until the largest visible element loads. Under 2.5s is good.
1.09 s
Total Blocking Time Total Blocking Time — total time the main thread was blocked, preventing user input. Under 200ms is good.
931 ms
Cumulative Layout Shift Cumulative Layout Shift — measures visual stability. How much the page layout shifts during loading. Under 0.1 is good.
0.003
Speed Index Speed Index — how quickly content is visually displayed during load. Under 3.4s is good.
3.17 s
Time to Interactive Time to Interactive — how long until the page is fully interactive and responds to user input. Under 3.8s is good.
10.27 s
Audit breakdown by category with detailed findings.
Remove large, duplicate JavaScript modules from bundles to reduce unnecessary bytes consumed by network activity.
Performance issues directly impact user engagement and conversion rates.
Polyfills and transforms enable older browsers to use new JavaScript features. However, many aren't necessary for modern browsers. Consider modifying your JavaScript build process to not transpile Baseline features, unless you know you must support older browsers. Learn why most sites can deploy ES6+ code without transpiling
Shipping ES5 transpiled code to modern browsers wastes bytes — every user with an evergreen browser pays for compatibility you don't need.
Most users today run browsers that natively support ES6+, async/await, optional chaining, and the rest of modern JavaScript. Transpiling to ES5 'just in case' adds 20-40% to your bundle for no benefit. Configure your build to target a modern browserslist, or ship a differential bundle pair (modern + legacy) with the module/nomodule pattern.
Source: Google web.dev / Lighthouse
3rd party code can significantly impact load performance. Reduce and defer loading of 3rd party code to prioritize your page's content.
Performance issues directly impact user engagement and conversion rates.
Your first network request is the most important. Reduce its latency by avoiding redirects, ensuring a fast server response, and enabling text compression.
Performance issues directly impact user engagement and conversion rates.
A forced reflow occurs when JavaScript queries geometric properties (such as offsetWidth) after styles have been invalidated by a change to the DOM state. This can result in poor performance. Learn more about forced reflows and possible mitigations.
Performance issues directly impact user engagement and conversion rates.
Optimize LCP by making the LCP image discoverable from the HTML immediately, and avoiding lazy-loading
Performance issues directly impact user engagement and conversion rates.
Avoid chaining critical requests by reducing the length of chains, reducing the download size of resources, or deferring the download of unnecessary resources to improve page load.
Performance issues directly impact user engagement and conversion rates.
A long cache lifetime can speed up repeat visits to your page. Learn more about caching.
Performance issues directly impact user engagement and conversion rates.
Reducing the download time of images can improve the perceived load time of the page and LCP. Learn more about optimizing image size
Performance issues directly impact user engagement and conversion rates.
| URL | Resource Size | Est Savings | |
|---|---|---|---|
A white Sonos Ray on a credenza beneath a TV div > div#_0108f2b45991 > figure.relative > img | /images/znqtjj88/production/450055a719c987960f6687fcd8e7f... | 1.4 MiB | 1.4 MiB |
Person riding a bicycle with a black Sonos Play speaker in the front basket div > div#_0108f2b45991 > figure.relative > img | /images/znqtjj88/production/effaa2a79865dd4b84e2a471da38e... | 350.1 KiB | 228.2 KiB |
Person outside listening to music on white Sonos Ace headphones with blue sky a… div > div#_0108f2b45991 > figure.relative > img | /images/znqtjj88/production/fefba3c63bdadf7c6eacb6fbb0c6e... | 84.0 KiB | 54.7 KiB |
Giles Martin section.lg:order-none > div#_29192a56f169 > figure.relative > img | /images/znqtjj88/production/accad8cf4db6cc8cef8454c2ce5c8... | 33.5 KiB | 13.0 KiB |
These insights are also available in the Chrome DevTools Performance Panel - record a trace to view more detailed information.
Redirects introduce additional delays before the page can be loaded. Learn how to avoid page redirects.
Performance issues directly impact user engagement and conversion rates.
| URL | Time Spent |
|---|---|
| sonos.com/ | 243 ms |
| www.sonos.com/en/home | 0.0 ms |
Time to Interactive is the amount of time it takes for the page to become fully interactive. Learn more about the Time to Interactive metric.
Performance issues directly impact user engagement and conversion rates.
The maximum potential First Input Delay that your users could experience is the duration of the longest task. Learn more about the Maximum Potential First Input Delay metric.
Performance issues directly impact user engagement and conversion rates.
Reduce unused rules from stylesheets and defer CSS not used for above-the-fold content to decrease bytes consumed by network activity. Learn how to reduce unused CSS.
Performance issues directly impact user engagement and conversion rates.
| URL | Transfer Size | Est Savings |
|---|---|---|
| /_next/static/css/4be42307400234d4.css?dpl=dpl_HR77npGmmW... | 30.9 KiB | 24.9 KiB |
| 21.2 KiB | 20.9 KiB |
Consider reducing the time spent parsing, compiling, and executing JS. You may find delivering smaller JS payloads helps with this. Learn how to reduce Javascript execution time.
Performance issues directly impact user engagement and conversion rates.
Consider reducing the time spent parsing, compiling and executing JS. You may find delivering smaller JS payloads helps with this. Learn how to minimize main-thread work
Performance issues directly impact user engagement and conversion rates.
| Category | Time Spent |
|---|---|
| Script Evaluation | 4.1 s |
| Other | 905 ms |
| Script Parsing & Compilation | 497 ms |
| Style & Layout | 331 ms |
| Garbage Collection | 134 ms |
| Parse HTML & CSS | 116 ms |
| Rendering | 33 ms |
Many navigations are performed by going back to a previous page, or forwards again. The back/forward cache (bfcache) can speed up these return navigations. Learn more about the bfcache
Performance issues directly impact user engagement and conversion rates.
| Failure reason | Failure type |
|---|---|
| Pages with cache-control:no-store header cannot enter back/forward cache. | Actionable |
| The page has an unload handler in a sub frame. | Actionable |
| Pages whose main resource has cache-control:no-store cannot enter back/forward cache. | Not actionable |
| Back/forward cache is disabled because some JavaScript network request received resource with Cache-Control: no-store header. | Not actionable |
Minifying JavaScript files can reduce payload sizes and script parse time. Learn how to minify JavaScript.
Performance issues directly impact user engagement and conversion rates.
| URL | Transfer Size | Est Savings |
|---|---|---|
| analytics.sonos.com/p.js | 120.0 KiB | 47.9 KiB |
Reduce unused JavaScript and defer loading scripts until they are required to decrease bytes consumed by network activity. Learn how to reduce unused JavaScript.
Multi-megabyte JavaScript bundles delay every interactive feature on the page.
This is the Lighthouse audit fired when too much JS is shipped relative to what executes. The fix isn't a config flag — it requires bundle analysis (webpack-bundle-analyzer, rollup-plugin-visualizer), splitting routes into chunks, lazy-loading off-screen components, and removing unused dependencies. Fundamentally different from minification: minifying reduces byte count, this reduces what's downloaded at all.
Source: Google web.dev / Lighthouse
Large network payloads cost users real money and are highly correlated with long load times. Learn how to reduce payload sizes.
Performance issues directly impact user engagement and conversion rates.
More information about the performance of your application. These numbers don't directly affect the Performance score.
These checks highlight opportunities to improve the accessibility of your web app. Automatic detection can only detect a subset of issues and does not guarantee the accessibility of your web app, so manual testing is also encouraged.
When a button doesn't have an accessible name, screen readers announce it as "button", making it unusable for users who rely on screen readers. Learn how to make buttons more accessible.
Performance issues directly impact user engagement and conversion rates.
| Failing Elements |
|---|
div.basis-full > div#q3fy26-earth-day-refurb > div.w-2 > button.flex div.basis-full > div#q3fy26-earth-day-refurb > div.w-2 > button.flex |
Search nav#right > ul.inline-flex > li.flex > button.flex |
div.relative > div.absolute > div.z-[9] > button.border-none div.relative > div.absolute > div.z-[9] > button.border-none |
Informative elements should aim for short, descriptive alternate text. Decorative elements can be ignored with an empty alt attribute. Learn more about the `alt` attribute.
Performance issues directly impact user engagement and conversion rates.
| Failing Elements |
|---|
body.has-cookie-banner > img body.has-cookie-banner > img |
Link text (and alternate text for images, when used as links) that is discernible, unique, and focusable improves the navigation experience for screen reader users. Learn how to make links accessible.
Performance issues directly impact user engagement and conversion rates.
| Failing Elements |
|---|
div.flex > ul.flex > li > a div.flex > ul.flex > li > a |
These are opportunities to improve the semantics of the controls in your application. This may enhance the experience for users of assistive technology, like a screen reader.
Properly ordered headings that do not skip levels convey the semantic structure of the page, making it easier to navigate and understand when using assistive technologies. Learn more about heading order.
Performance issues directly impact user engagement and conversion rates.
| Failing Elements |
|---|
Astonishingly clear section.lg:order-none > section.w-full > div > h3.tw-typography-h3 |
4000+ div > div.border > div.flex > h5.block |
Mix and match speakers section.lg:order-none > section.w-full > div > h4.block |
Sets nav.flex > div.flex > a.flex > h6.block |
These are opportunities to improve keyboard navigation in your application.
Screen readers have a specific way of announcing lists. Ensuring proper list structure aids screen reader output. Learn more about proper list structure.
Performance issues directly impact user engagement and conversion rates.
| Failing Elements |
|---|
Home body.has-cookie-banner > header.tw-header-nav-spacing > nav#left > ul.inline-flex |
Sale
Shop
New Arrivals
Learn
Support
Professional body.has-cookie-banner > header.tw-header-nav-spacing > nav#center > ul.inline-flex |
My Account body.has-cookie-banner > header.tw-header-nav-spacing > nav#right > ul.inline-flex |
These are opportunities to improve the experience of reading tabular or list data using assistive technology, like a screen reader.
Deprecated APIs will eventually be removed from the browser. Learn more about deprecated APIs.
Performance issues directly impact user engagement and conversion rates.
| Deprecation / Warning | Source |
|---|---|
| Unload event listeners are deprecated and will be removed. | |
| AttributionReporting |
Errors logged to the console indicate unresolved problems. They can come from network request failures and other browser concerns. Learn more about this errors in console diagnostic audit
Performance issues directly impact user engagement and conversion rates.
| Source | Description |
|---|---|
Error: Minified React error #418; visit https://react.dev/errors/418?args[]=HTML&args[]= for the full message or use the non-minified dev environment for full errors and additional helpful warnings.
at rX (https://www.sonos.com/_next/static/chunks/61b5e853-8430af891c2cc329.js?dpl=dpl_HR77npGmmWfDQznR71rQzE97oiSB:1:36657)
at is (https://www.sonos.com/_next/static/chunks/61b5e853-8430af891c2cc329.js?dpl=dpl_HR77npGmmWfDQznR71rQzE97oiSB:1:87558)
at sp (https://www.sonos.com/_next/static/chunks/61b5e853-8430af891c2cc329.js?dpl=dpl_HR77npGmmWfDQznR71rQzE97oiSB:1:128029)
at https://www.sonos.com/_next/static/chunks/61b5e853-8430af891c2cc329.js?dpl=dpl_HR77npGmmWfDQznR71rQzE97oiSB:1:122919
at sn (https://www.sonos.com/_next/static/chunks/61b5e853-8430af891c2cc329.js?dpl=dpl_HR77npGmmWfDQznR71rQzE97oiSB:1:123020)
at sQ (https://www.sonos.com/_next/static/chunks/61b5e853-8430af891c2cc329.js?dpl=dpl_HR77npGmmWfDQznR71rQzE97oiSB:1:149408)
at MessagePort.M (https://www.sonos.com/_next/static/chunks/3528-22399f527ed2dbbd.js?dpl=dpl_HR77npGmmWfDQznR71rQzE97oiSB:2:131186) | |
Failed to load resource: the server responded with a status of 401 () |
Source maps translate minified code to the original source code. This helps developers debug in production. In addition, Lighthouse is able to provide further insights. Consider deploying source maps to take advantage of these benefits. Learn more about source maps.
Performance issues directly impact user engagement and conversion rates.
These checks ensure that your page is following basic search engine optimization advice. There are many additional factors Lighthouse does not score here that may affect your search ranking, including performance on Core Web Vitals. Learn more about Google Search Essentials.
Descriptive link text helps search engines understand your content. Learn how to make links more accessible.
Performance issues directly impact user engagement and conversion rates.
| Link destination | Link Text |
|---|---|
| www.sonos.com/en/controller-app | Learn more |
| www.sonos.com/en/sonos-radio | Learn more |
| www.sonos.com/en/controller-app | Learn more |
| www.sonos.com/legal/privacy | More information |
Informative elements should aim for short, descriptive alternate text. Decorative elements can be ignored with an empty alt attribute. Learn more about the `alt` attribute.
Performance issues directly impact user engagement and conversion rates.
| Failing Elements |
|---|
body.has-cookie-banner > img body.has-cookie-banner > img |
Format your HTML in a way that enables crawlers to better understand your app’s content.
Send Feedback