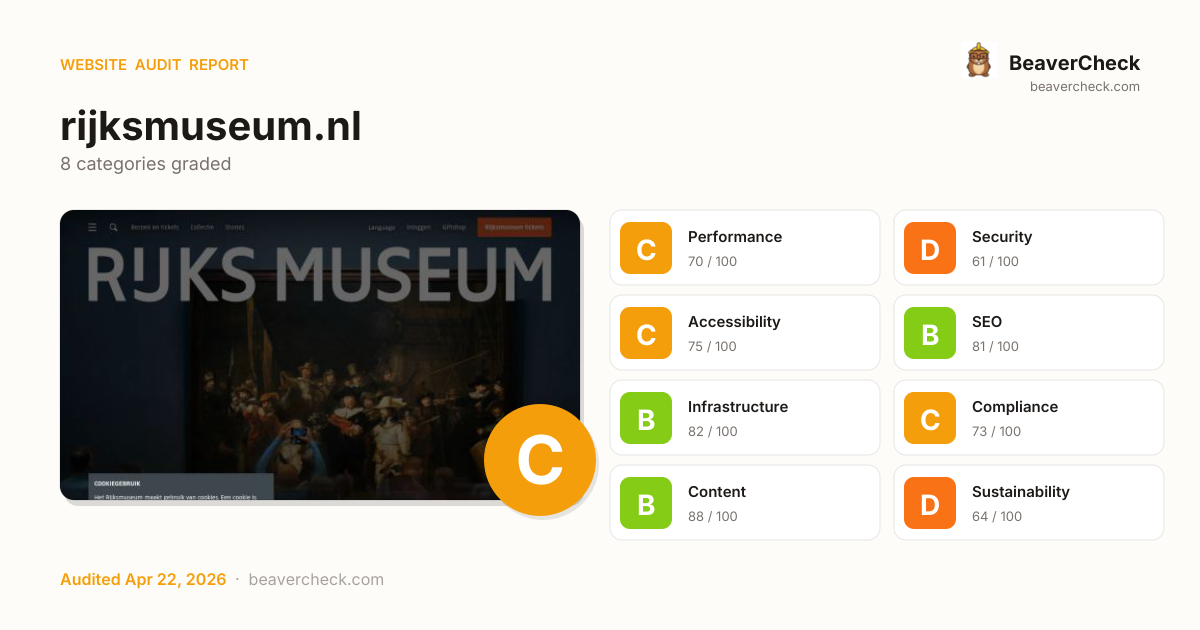
Mobile 375 × 812

Desktop 1440 × 900

Score: 72 / 100
Based on 8 categories, 0 sections
Decent speed, but optimizing further could improve engagement.
Several missing protections leave your users and data exposed.
Mostly accessible, but some users still face barriers.
Solid SEO basics — a few optimizations could boost rankings.
Good server performance with room for optimization.
Mostly compliant — a few items need attention.
Rich content metadata — your pages look great everywhere.
Heavier than average — reducing page weight saves energy and bandwidth.
The overall score is a weighted average of individual category scores. Categories with more impact on user experience and security carry more weight.
Weights reflect general web best practices. Individual needs may differ.
Content-Security-Policy header is missing
Security gaps expose your site and users to attacks, eroding trust.
HSTS header is missing
Security gaps expose your site and users to attacks, eroding trust.
No Content-Security-Policy header found
Security gaps expose your site and users to attacks, eroding trust.
114 third-party resources (100% of weight)
Performance issues directly impact user engagement and conversion rates.
115 HTTP requests — consider bundling or reducing
Performance issues directly impact user engagement and conversion rates.
High impact, low effort — start here.
High impact, requires investment.
Small gains, minimal effort.
Nothing in this quadrant — good news.
Low impact, high effort — do last.
Nothing in this quadrant — good news.
[](https://beavercheck.com/results/f6a1dff3-e665-4d31-8dbc-21a5a00873ee)<a href="https://beavercheck.com/results/f6a1dff3-e665-4d31-8dbc-21a5a00873ee"><img src="https://beavercheck.com/badge?url=https%3A%2F%2Frijksmuseum.nl" alt="BeaverCheck Score"></a>https://beavercheck.com/badge?url=https%3A%2F%2Frijksmuseum.nlThis badge auto-updates with your latest scan result.
Your site performs reasonably well, but a few targeted fixes could meaningfully improve results. Your LCP of 3.7s exceeds Google's 2.5s 'Good' threshold and the 2 performance issues below directly contribute to it. Addressing the critical issues below would have the most immediate impact on your user trust.
7 barrier(s) likely increasing bounce by ~23%.
Page loads in 3.7s
+5% bounceEvery additional 100ms above 2.5s costs conversions — you're 1.2s over
Fix: Target <2.5s LCP: defer non-critical scripts and optimize the hero image
Page feels frozen for 3.3s
+5% bounceClicks on the primary CTA are ignored while JavaScript runs
Fix: Break up long tasks; defer non-critical JavaScript to post-hydration
No HSTS header
+1% bounceReturning visitors are briefly exposed to downgrade attacks on first request
Fix: Set Strict-Transport-Security: max-age=31536000; includeSubDomains
No Content-Security-Policy header
+1% bounceHigher XSS blast radius — one compromised script can exfiltrate the checkout form
Fix: Ship a reporting-only CSP first, then enforce once violations are clean
No structured data
+2% bounceNo rich-result eligibility in Google — lower SERP CTR vs competitors with stars and prices
Fix: Add JSON-LD for your page type (Product, Article, FAQPage, LocalBusiness, …)
Thin content
+3% bounceUnder 300 words — visitors bounce looking for substance, search engines rank competitors first
Fix: Add a substantive FAQ, product detail, or case-study section
No skip-to-content link
+1% bounceKeyboard and screen-reader users must tab through the entire header on every page
Fix: Add a visible-on-focus <a href="#main">Skip to content</a> as the first focusable element
Preliminary CRO audit — each barrier links to the tab with detailed analysis.
€468 investment → €1,837/month returns + EUR 120,500,000 risk avoided
€468
6h · 5 findings
€1,837 /mo
~€22,038 / year
EUR 120,500,000
if kept compliant
€128 — in quick wins — start here for the fastest payback
Figures combine localized regulatory fine ceilings, search/conversion value priced against local CPC, and bandwidth waste estimates. Results depend on implementation quality and audience composition. Not legal or financial advice.
5.5 developer hours at €85/hr
Based on Netherlands rates (€85/hr)
Start here for the best return on investment
€10,041,667 / month at risk
~€120,500,008 / year if left unfixed
€120,500,000
+5 more
€0.67 /mo
9093.4 MB/mo × 0.074 EUR/GB
Compliance figures represent the statutory maximum fine for the most severe triggered category, capped per regulation — not the sum of per-finding penalties. Based on published regulatory fine ranges. This is not legal advice.
Unique monthly visitors from your analytics
Purchases, signups, or key actions
Optional — for revenue estimation
more engaged visitors from reduced bounce
Fix 3 critical issues to capture this value
Based on Google/Deloitte research ("Milliseconds Make Millions") showing a ~7% bounce rate increase per additional second of LCP above the 2.5s "Good" threshold.
Your site's LCP: → estimated after fixes.
These are estimates based on industry research — actual results vary
Your data stays in your browser — nothing is sent to our servers
Thanks for your feedback!
We'll use a cached audit if available, or offer to scan.
Industry-standard audits powered by Google Lighthouse.
Key metrics that affect user experience.
First Contentful Paint First Contentful Paint — how long until the browser renders the first piece of content. Under 1.8s is good.
3.21 s
Largest Contentful Paint Largest Contentful Paint — how long until the largest visible element loads. Under 2.5s is good.
3.69 s
Total Blocking Time Total Blocking Time — total time the main thread was blocked, preventing user input. Under 200ms is good.
3.26 s
Cumulative Layout Shift Cumulative Layout Shift — measures visual stability. How much the page layout shifts during loading. Under 0.1 is good.
0.000
Speed Index Speed Index — how quickly content is visually displayed during load. Under 3.4s is good.
6.41 s
Time to Interactive Time to Interactive — how long until the page is fully interactive and responds to user input. Under 3.8s is good.
21.95 s
Audit breakdown by category with detailed findings.
Remove large, duplicate JavaScript modules from bundles to reduce unnecessary bytes consumed by network activity.
Performance issues directly impact user engagement and conversion rates.
Polyfills and transforms enable older browsers to use new JavaScript features. However, many aren't necessary for modern browsers. Consider modifying your JavaScript build process to not transpile Baseline features, unless you know you must support older browsers. Learn why most sites can deploy ES6+ code without transpiling
Shipping ES5 transpiled code to modern browsers wastes bytes — every user with an evergreen browser pays for compatibility you don't need.
Most users today run browsers that natively support ES6+, async/await, optional chaining, and the rest of modern JavaScript. Transpiling to ES5 'just in case' adds 20-40% to your bundle for no benefit. Configure your build to target a modern browserslist, or ship a differential bundle pair (modern + legacy) with the module/nomodule pattern.
Source: Google web.dev / Lighthouse
3rd party code can significantly impact load performance. Reduce and defer loading of 3rd party code to prioritize your page's content.
Performance issues directly impact user engagement and conversion rates.
Your first network request is the most important. Reduce its latency by avoiding redirects, ensuring a fast server response, and enabling text compression.
Performance issues directly impact user engagement and conversion rates.
Each subpart has specific improvement strategies. Ideally, most of the LCP time should be spent on loading the resources, not within delays.
Performance issues directly impact user engagement and conversion rates.
Avoid chaining critical requests by reducing the length of chains, reducing the download size of resources, or deferring the download of unnecessary resources to improve page load.
Performance issues directly impact user engagement and conversion rates.
Requests are blocking the page's initial render, which may delay LCP. Deferring or inlining can move these network requests out of the critical path.
Performance issues directly impact user engagement and conversion rates.
| URL | Transfer Size | Duration |
|---|---|---|
| /statics/generated/rijksmuseum-app.css?v=bauL2fGuHsDKYNfz... | 22.5 KiB | 308 ms |
A long cache lifetime can speed up repeat visits to your page. Learn more about caching.
Performance issues directly impact user engagement and conversion rates.
| Request | Cache TTL | Transfer Size |
|---|---|---|
| connect.facebook.net/en_US/fbevents.js | 1200.0 s | 96.6 KiB |
| cdn-4.convertexperiments.com/v1/js/10042695-10043546.js?environment=production | 300.0 s | 86.2 KiB |
| /signals/config/1002921673111303?v=2.9.303&r=stable&domai... | 1200.0 s | 46.5 KiB |
| scripts.clarity.ms/0.8.60-beta/clarity.js | 86400.0 s | 25.0 KiB |
| snap.licdn.com/li.lms-analytics/insight.min.js | 86400.0 s | 18.7 KiB |
| static.hotjar.com/c/hotjar-1107212.js?sv=7 | 60.0 s | 6.2 KiB |
| /config/nl/8ebc9c2f-419d-4bd9-b478-1c5fde6061d9.js?v=3.56... | 0.0 ms | 467 B |
| /collect?v=2&fmt=js&pid=1424529&time=1776894277273&li_ads... | 0.0 ms | 270 B |
| /tr/?id=1002921673111303&ev=PageView&dl=https%3A%2F%2Fwww... | 0.0 ms | 16 B |
Reducing the download time of images can improve the perceived load time of the page and LCP. Learn more about optimizing image size
Performance issues directly impact user engagement and conversion rates.
| URL | Resource Size | Est Savings | |
|---|---|---|---|
a.block-link > div.background-image > picture > img.lazy-image-placeholder a.block-link > div.background-image > picture > img.lazy-image-placeholder | /assets/e45e3a0b-61e1-4b22-b4e0-5e0defe985d1?w=20&h=21&fx... | 673.5 KiB | 673.5 KiB |
a.block-link > div.background-image > picture.hidden > img.lazy-image-placeholder a.block-link > div.background-image > picture.hidden > img.lazy-image-placeholder | /assets/4ef912c6-338f-4a68-a033-deab0702d0f0?w=20&h=43&fx... | 39.3 KiB | 39.2 KiB |
a.block-link > div.background-image > picture > img.lazy-image-placeholder a.block-link > div.background-image > picture > img.lazy-image-placeholder | /assets/d7360324-7a68-4691-817d-e737dd383d81?w=20&h=43&fx... | 5.3 KiB | 5.2 KiB |
These insights are also available in the Chrome DevTools Performance Panel - record a trace to view more detailed information.
Redirects introduce additional delays before the page can be loaded. Learn how to avoid page redirects.
Performance issues directly impact user engagement and conversion rates.
| URL | Time Spent |
|---|---|
| rijksmuseum.nl/ | 1.2 s |
| www.rijksmuseum.nl/ | 895 ms |
| www.rijksmuseum.nl/nl | 0.0 ms |
Keep the server response time for the main document short because all other requests depend on it. Learn more about the Time to First Byte metric.
Performance issues directly impact user engagement and conversion rates.
| URL | Time Spent |
|---|---|
| www.rijksmuseum.nl/nl | 1.0 s |
Time to Interactive is the amount of time it takes for the page to become fully interactive. Learn more about the Time to Interactive metric.
Performance issues directly impact user engagement and conversion rates.
The maximum potential First Input Delay that your users could experience is the duration of the longest task. Learn more about the Maximum Potential First Input Delay metric.
Performance issues directly impact user engagement and conversion rates.
Reduce unused rules from stylesheets and defer CSS not used for above-the-fold content to decrease bytes consumed by network activity. Learn how to reduce unused CSS.
Performance issues directly impact user engagement and conversion rates.
| URL | Transfer Size | Est Savings |
|---|---|---|
| /statics/generated/rijksmuseum-app.css?v=bauL2fGuHsDKYNfz... | 22.2 KiB | 20.4 KiB |
Consider reducing the time spent parsing, compiling, and executing JS. You may find delivering smaller JS payloads helps with this. Learn how to reduce Javascript execution time.
Performance issues directly impact user engagement and conversion rates.
Consider reducing the time spent parsing, compiling and executing JS. You may find delivering smaller JS payloads helps with this. Learn how to minimize main-thread work
Performance issues directly impact user engagement and conversion rates.
| Category | Time Spent |
|---|---|
| Script Evaluation | 4.8 s |
| Other | 1.5 s |
| Script Parsing & Compilation | 711 ms |
| Style & Layout | 187 ms |
| Garbage Collection | 152 ms |
| Parse HTML & CSS | 124 ms |
| Rendering | 68 ms |
Reduce unused JavaScript and defer loading scripts until they are required to decrease bytes consumed by network activity. Learn how to reduce unused JavaScript.
Multi-megabyte JavaScript bundles delay every interactive feature on the page.
This is the Lighthouse audit fired when too much JS is shipped relative to what executes. The fix isn't a config flag — it requires bundle analysis (webpack-bundle-analyzer, rollup-plugin-visualizer), splitting routes into chunks, lazy-loading off-screen components, and removing unused dependencies. Fundamentally different from minification: minifying reduces byte count, this reduces what's downloaded at all.
Source: Google web.dev / Lighthouse
| URL | Transfer Size | Est Savings |
|---|---|---|
| www.googletagmanager.com/gtag/js?id=G-CS3DSQ64VQ&cx=c>m=4e64k0 | 164.3 KiB | 64.2 KiB |
| www.googletagmanager.com/gtag/destination?id=DC-14853655&cx=c>m=4e64k0 | 129.2 KiB | 62.4 KiB |
| www.googletagmanager.com/gtag/js?id=G-12345&cx=c>m=4e64k0 | 136.6 KiB | 60.4 KiB |
| www.googletagmanager.com/gtag/destination?id=AW-970895607&cx=c>m=4e64k0 | 144.5 KiB | 60.1 KiB |
| www.googletagmanager.com/gtag/destination?id=AW-990532474&cx=c>m=4e64k0 | 133.9 KiB | 59.3 KiB |
| www.googletagmanager.com/gtag/destination?id=AW-794194365&cx=c>m=4e64k0 | 133.9 KiB | 59.3 KiB |
| www.googletagmanager.com/gtag/destination?id=AW-976087125&cx=c>m=4e64k0 | 136.3 KiB | 58.9 KiB |
| www.googletagmanager.com/gtm.js?id=GTM-TDHW9DQ | 181.1 KiB | 57.2 KiB |
| analytics.tiktok.com/i18n/pixel/static/main.MWE0ZWQ3ZWQwMQ.js | 93.3 KiB | 53.4 KiB |
| cdn-4.convertexperiments.com/v1/js/10042695-10043546.js?environment=production | 86.0 KiB | 45.0 KiB |
| script.hotjar.com/modules.6a0f3932cb1341a35c18.js | 56.1 KiB | 37.8 KiB |
| connect.facebook.net/en_US/fbevents.js | 96.5 KiB | 32.3 KiB |
Large network payloads cost users real money and are highly correlated with long load times. Learn how to reduce payload sizes.
Performance issues directly impact user engagement and conversion rates.
Set an explicit width and height on image elements to reduce layout shifts and improve CLS. Learn how to set image dimensions
Performance issues directly impact user engagement and conversion rates.
| URL | |
|---|---|
Kpn logo li.sponsor-logos-section > div.grid-column > a.logo-link > img.logo-image | www.rijksmuseum.nl/statics/logos/kpn-logo-white.svg |
ING logo li.sponsor-logos-section > div.grid-column > a.logo-link > img.logo-image | www.rijksmuseum.nl/statics/logos/ing.svg |
anbi logo ul.link-buttons > li.logo-link > a > img.logo-image | www.rijksmuseum.nl/statics/logos/anbi.svg |
Vriendenloterij logo li.sponsor-logos-section > div.grid-column > a.logo-link > img.logo-image | www.rijksmuseum.nl/statics/logos/vrienden-loterij.svg |
Ministerie van Onderwijs, Cultuur en Wetenschap logo li.sponsor-logos-section > div.grid-column > a.logo-link > img.logo-image | www.rijksmuseum.nl/statics/logos/m-ocw-nl.svg |
More information about the performance of your application. These numbers don't directly affect the Performance score.
These checks highlight opportunities to improve the accessibility of your web app. Automatic detection can only detect a subset of issues and does not guarantee the accessibility of your web app, so manual testing is also encouraged.
Deprecated APIs will eventually be removed from the browser. Learn more about deprecated APIs.
Performance issues directly impact user engagement and conversion rates.
| Deprecation / Warning | Source |
|---|---|
| AttributionReporting |
These checks ensure that your page is following basic search engine optimization advice. There are many additional factors Lighthouse does not score here that may affect your search ranking, including performance on Core Web Vitals. Learn more about Google Search Essentials.
Industry-standard audits powered by Google Lighthouse. — Desktop
Key metrics that affect user experience. — Desktop
First Contentful Paint First Contentful Paint — how long until the browser renders the first piece of content. Under 1.8s is good.
1.09 s
Largest Contentful Paint Largest Contentful Paint — how long until the largest visible element loads. Under 2.5s is good.
1.48 s
Total Blocking Time Total Blocking Time — total time the main thread was blocked, preventing user input. Under 200ms is good.
374 ms
Cumulative Layout Shift Cumulative Layout Shift — measures visual stability. How much the page layout shifts during loading. Under 0.1 is good.
0.000
Speed Index Speed Index — how quickly content is visually displayed during load. Under 3.4s is good.
1.71 s
Time to Interactive Time to Interactive — how long until the page is fully interactive and responds to user input. Under 3.8s is good.
5.38 s
Audit breakdown by category with detailed findings.
Remove large, duplicate JavaScript modules from bundles to reduce unnecessary bytes consumed by network activity.
Performance issues directly impact user engagement and conversion rates.
Polyfills and transforms enable older browsers to use new JavaScript features. However, many aren't necessary for modern browsers. Consider modifying your JavaScript build process to not transpile Baseline features, unless you know you must support older browsers. Learn why most sites can deploy ES6+ code without transpiling
Shipping ES5 transpiled code to modern browsers wastes bytes — every user with an evergreen browser pays for compatibility you don't need.
Most users today run browsers that natively support ES6+, async/await, optional chaining, and the rest of modern JavaScript. Transpiling to ES5 'just in case' adds 20-40% to your bundle for no benefit. Configure your build to target a modern browserslist, or ship a differential bundle pair (modern + legacy) with the module/nomodule pattern.
Source: Google web.dev / Lighthouse
3rd party code can significantly impact load performance. Reduce and defer loading of 3rd party code to prioritize your page's content.
Performance issues directly impact user engagement and conversion rates.
Your first network request is the most important. Reduce its latency by avoiding redirects, ensuring a fast server response, and enabling text compression.
Performance issues directly impact user engagement and conversion rates.
Avoid chaining critical requests by reducing the length of chains, reducing the download size of resources, or deferring the download of unnecessary resources to improve page load.
Performance issues directly impact user engagement and conversion rates.
A long cache lifetime can speed up repeat visits to your page. Learn more about caching.
Performance issues directly impact user engagement and conversion rates.
| Request | Cache TTL | Transfer Size |
|---|---|---|
| connect.facebook.net/en_US/fbevents.js | 1200.0 s | 96.6 KiB |
| cdn-4.convertexperiments.com/v1/js/10042695-10043546.js?environment=production | 300.0 s | 86.2 KiB |
| /signals/config/1002921673111303?v=2.9.303&r=stable&domai... | 1200.0 s | 46.6 KiB |
| scripts.clarity.ms/0.8.60-beta/clarity.js | 86400.0 s | 25.0 KiB |
| snap.licdn.com/li.lms-analytics/insight.min.js | 86400.0 s | 18.7 KiB |
| static.hotjar.com/c/hotjar-1107212.js?sv=7 | 60.0 s | 6.2 KiB |
| /config/nl/8ebc9c2f-419d-4bd9-b478-1c5fde6061d9.js?v=3.56... | 0.0 ms | 467 B |
| /collect?v=2&fmt=js&pid=1424529&time=1776894298003&li_ads... | 0.0 ms | 273 B |
| /tr/?id=1002921673111303&ev=PageView&dl=https%3A%2F%2Fwww... | 0.0 ms | 16 B |
Reducing the download time of images can improve the perceived load time of the page and LCP. Learn more about optimizing image size
Performance issues directly impact user engagement and conversion rates.
| URL | Resource Size | Est Savings | |
|---|---|---|---|
a.block-link > div.background-image > picture > img.lazy-image-placeholder a.block-link > div.background-image > picture > img.lazy-image-placeholder | /assets/e45e3a0b-61e1-4b22-b4e0-5e0defe985d1?w=20&h=30&fx... | 673.7 KiB | 673.7 KiB |
a.block-link > div.background-image > picture.hidden > img.lazy-image-placeholder a.block-link > div.background-image > picture.hidden > img.lazy-image-placeholder | /assets/4ef912c6-338f-4a68-a033-deab0702d0f0?w=20&h=15&fx... | 39.1 KiB | 39.1 KiB |
Requests are blocking the page's initial render, which may delay LCP. Deferring or inlining can move these network requests out of the critical path.
Performance issues directly impact user engagement and conversion rates.
| URL | Transfer Size | Duration |
|---|---|---|
| /statics/generated/rijksmuseum-app.css?v=bauL2fGuHsDKYNfz... | 22.5 KiB | 82 ms |
These insights are also available in the Chrome DevTools Performance Panel - record a trace to view more detailed information.
Redirects introduce additional delays before the page can be loaded. Learn how to avoid page redirects.
Performance issues directly impact user engagement and conversion rates.
| URL | Time Spent |
|---|---|
| rijksmuseum.nl/ | 646 ms |
| www.rijksmuseum.nl/ | 220 ms |
| www.rijksmuseum.nl/nl | 0.0 ms |
Time to Interactive is the amount of time it takes for the page to become fully interactive. Learn more about the Time to Interactive metric.
Performance issues directly impact user engagement and conversion rates.
Reduce unused rules from stylesheets and defer CSS not used for above-the-fold content to decrease bytes consumed by network activity. Learn how to reduce unused CSS.
Performance issues directly impact user engagement and conversion rates.
| URL | Transfer Size | Est Savings |
|---|---|---|
| /statics/generated/rijksmuseum-app.css?v=bauL2fGuHsDKYNfz... | 22.2 KiB | 20.0 KiB |
Reduce unused JavaScript and defer loading scripts until they are required to decrease bytes consumed by network activity. Learn how to reduce unused JavaScript.
Multi-megabyte JavaScript bundles delay every interactive feature on the page.
This is the Lighthouse audit fired when too much JS is shipped relative to what executes. The fix isn't a config flag — it requires bundle analysis (webpack-bundle-analyzer, rollup-plugin-visualizer), splitting routes into chunks, lazy-loading off-screen components, and removing unused dependencies. Fundamentally different from minification: minifying reduces byte count, this reduces what's downloaded at all.
Source: Google web.dev / Lighthouse
| URL | Transfer Size | Est Savings |
|---|---|---|
| www.googletagmanager.com/gtag/js?id=G-CS3DSQ64VQ&cx=c>m=4e64k0 | 164.3 KiB | 64.1 KiB |
| www.googletagmanager.com/gtag/destination?id=DC-14853655&cx=c>m=4e64k0 | 129.1 KiB | 62.4 KiB |
| analytics.tiktok.com/i18n/pixel/static/main.MWE0ZWQ3ZWQwMQ.js | 108.9 KiB | 62.3 KiB |
| www.googletagmanager.com/gtag/js?id=G-12345&cx=c>m=4e64k0 | 136.5 KiB | 61.3 KiB |
| www.googletagmanager.com/gtag/destination?id=AW-970895607&cx=c>m=4e64k0 | 144.5 KiB | 60.1 KiB |
| www.googletagmanager.com/gtag/destination?id=AW-794194365&cx=c>m=4e64k0 | 133.9 KiB | 59.3 KiB |
| www.googletagmanager.com/gtag/destination?id=AW-976087125&cx=c>m=4e64k0 | 136.3 KiB | 59.1 KiB |
| www.googletagmanager.com/gtag/destination?id=AW-990532474&cx=c>m=4e64k0 | 133.9 KiB | 58.2 KiB |
| www.googletagmanager.com/gtm.js?id=GTM-TDHW9DQ | 181.1 KiB | 57.2 KiB |
| cdn-4.convertexperiments.com/v1/js/10042695-10043546.js?environment=production | 85.9 KiB | 45.0 KiB |
| script.hotjar.com/modules.6a0f3932cb1341a35c18.js | 56.1 KiB | 37.6 KiB |
| connect.facebook.net/en_US/fbevents.js | 96.5 KiB | 32.7 KiB |
Large network payloads cost users real money and are highly correlated with long load times. Learn how to reduce payload sizes.
Performance issues directly impact user engagement and conversion rates.
Set an explicit width and height on image elements to reduce layout shifts and improve CLS. Learn how to set image dimensions
Performance issues directly impact user engagement and conversion rates.
| URL | |
|---|---|
Kpn logo div.sponsor-logos-section > div.grid-column > a.logo-link > img.logo-image | www.rijksmuseum.nl/statics/logos/kpn-logo-white.svg |
Kpn logo li.sponsor-logos-section > div.grid-column > a.logo-link > img.logo-image | www.rijksmuseum.nl/statics/logos/kpn-logo-white.svg |
ING logo div.sponsor-logos-section > div.grid-column > a.logo-link > img.logo-image | www.rijksmuseum.nl/statics/logos/ing.svg |
ING logo li.sponsor-logos-section > div.grid-column > a.logo-link > img.logo-image | www.rijksmuseum.nl/statics/logos/ing.svg |
anbi logo ul.link-buttons > li.logo-link > a > img.logo-image | www.rijksmuseum.nl/statics/logos/anbi.svg |
Vriendenloterij logo div.sponsor-logos-section > div.grid-column > a.logo-link > img.logo-image | www.rijksmuseum.nl/statics/logos/vrienden-loterij.svg |
Vriendenloterij logo li.sponsor-logos-section > div.grid-column > a.logo-link > img.logo-image | www.rijksmuseum.nl/statics/logos/vrienden-loterij.svg |
Ministerie van Onderwijs, Cultuur en Wetenschap logo div.sponsor-logos-section > div.grid-column > a.logo-link > img.logo-image | www.rijksmuseum.nl/statics/logos/m-ocw-nl.svg |
Ministerie van Onderwijs, Cultuur en Wetenschap logo li.sponsor-logos-section > div.grid-column > a.logo-link > img.logo-image | www.rijksmuseum.nl/statics/logos/m-ocw-nl.svg |
More information about the performance of your application. These numbers don't directly affect the Performance score.
These checks highlight opportunities to improve the accessibility of your web app. Automatic detection can only detect a subset of issues and does not guarantee the accessibility of your web app, so manual testing is also encouraged.
Deprecated APIs will eventually be removed from the browser. Learn more about deprecated APIs.
Performance issues directly impact user engagement and conversion rates.
| Deprecation / Warning | Source |
|---|---|
| AttributionReporting |
These checks ensure that your page is following basic search engine optimization advice. There are many additional factors Lighthouse does not score here that may affect your search ranking, including performance on Core Web Vitals. Learn more about Google Search Essentials.
Send Feedback