Audit overview
3 categories need attention: Security, and 2 others.
Fix Priority Matrix
5 findingsQuick Wins
3High impact, low effort — start here.
Strategic
2High impact, requires investment.
Easy Improvements
0Small gains, minimal effort.
Nothing in this quadrant — good news.
Deprioritize
0Low impact, high effort — do last.
Nothing in this quadrant — good news.
Screenshots
Top Priorities (5)
Content-Security-Policy header is missing
Without a CSP, a single XSS bug can exfiltrate everything your users type — including credentials.
No Content-Security-Policy header found
Without a CSP, a single XSS bug can exfiltrate everything users type — credentials, payment data, session tokens.
Page weighs 14.8 MB (5.6 MB transferred)
Informational: total page weight (uncompressed) and bytes actually transferred over the wire.
2 button(s) with no accessible text
Buttons with no accessible text (icon-only, no aria-label) can't be activated by voice control or understood by screen readers.
4 image-only link(s) without alt text
Image-only links with no alt are unidentifiable to screen-reader users — link's destination is invisible.
Business case
What fixing the audit's findings is worth -- and what ignoring them keeps costing.
Return on investment
€595 investment → €8,068/month returns + EUR 120,500,000 risk avoided
Figures combine localized regulatory fine ceilings, search/conversion value priced against local CPC, and bandwidth waste estimates. Results depend on implementation quality and audience composition. Not legal or financial advice.
Conversion barriers
6 barrier(s) likely increasing bounce by ~30%.
- Page takes 13.2s to loadUsers abandon at ~3s — you're 10.7s over the 2.5s threshold→ Optimize render-blocking resources, preload the hero image, and compress images
- Page feels frozen for 2.2sClicks on the primary CTA are ignored while JavaScript runs→ Break up long tasks; defer non-critical JavaScript to post-hydration
- 4 broken link(s) on the pageClicks land on 404s — trust drops and the session often ends→ Fix or remove the broken destinations surfaced on the Content tab
- No Content-Security-Policy headerHigher XSS blast radius — one compromised script can exfiltrate the checkout form→ Ship a reporting-only CSP first, then enforce once violations are clean
- Layout shifts during page loadContent movement causes mis-clicks on CTAs and form fields→ Add width/height to images; reserve space for late-loading embeds
Preliminary CRO audit — each barrier links to the tab with detailed analysis.
Remediation cost
Start here for the best return on investment
Cost by category
Cost by effort level
Adjust assumptions
Team composition
Multiplier applied to dev hours to reflect QA, design, and PM overhead. Use Dev only for solo work; Full team for projects with formal review processes.
Rates reflect fully-loaded developer cost including overhead
Warning:Cost of inaction
Compliance Risk
€120.500.000
- No privacy policy link detectedGDPR: EUR 10.000 – EUR 20.000.000
- Trackers detected but no cookie policy foundGDPR: EUR 5.000 – EUR 10.000.000
- Trackers detected but no cookie policy foundGDPR: EUR 10.000 – EUR 20.000.000
Bounce-Rate Cost
€6.528 /mo
+29.7pp bounce · ~2,967 lost visitors/mo
CPC: EUR 2.20
Bandwidth Waste
€1,31 /mo
17638.0 MB/mo × 0.074 EUR/GB
- Optimize transfer: save ~1.8 MB per page loadSaves €1,31/mo
Compliance figures represent the statutory maximum fine for the most severe triggered category, capped per regulation — not the sum of per-finding penalties. Based on published regulatory fine ranges. This is not legal advice.
Unique monthly visitors from your analytics
Purchases, signups, or key actions
Optional — for revenue estimation
more engaged visitors from reduced bounce
Fix 5 critical issues to capture this value
How this is calculated
Based on Google/Deloitte research ("Milliseconds Make Millions") showing a ~7% bounce rate increase per additional second of LCP above the 2.5s "Good" threshold.
Your site's LCP: → estimated after fixes.
These are estimates based on industry research — actual results vary
Your data stays in your browser — nothing is sent to our servers
Lighthouse
Mobile
First Contentful Paint First Contentful Paint — how long until the browser renders the first piece of content. Under 1.8s is good.
5.71 s
Largest Contentful Paint Largest Contentful Paint — how long until the largest visible element loads. Under 2.5s is good.
13.22 s
Total Blocking Time Total Blocking Time — total time the main thread was blocked, preventing user input. Under 200ms is good.
2.19 s
Cumulative Layout Shift Cumulative Layout Shift — measures visual stability. How much the page layout shifts during loading. Under 0.1 is good.
0.237
Speed Index Speed Index — how quickly content is visually displayed during load. Under 3.4s is good.
11.05 s
Time to Interactive Time to Interactive — how long until the page is fully interactive and responds to user input. Under 3.8s is good.
27.75 s
Desktop
First Contentful Paint First Contentful Paint — how long until the browser renders the first piece of content. Under 1.8s is good.
668 ms
Largest Contentful Paint Largest Contentful Paint — how long until the largest visible element loads. Under 2.5s is good.
2.01 s
Total Blocking Time Total Blocking Time — total time the main thread was blocked, preventing user input. Under 200ms is good.
456 ms
Cumulative Layout Shift Cumulative Layout Shift — measures visual stability. How much the page layout shifts during loading. Under 0.1 is good.
0.051
Speed Index Speed Index — how quickly content is visually displayed during load. Under 3.4s is good.
3.79 s
Time to Interactive Time to Interactive — how long until the page is fully interactive and responds to user input. Under 3.8s is good.
5.74 s
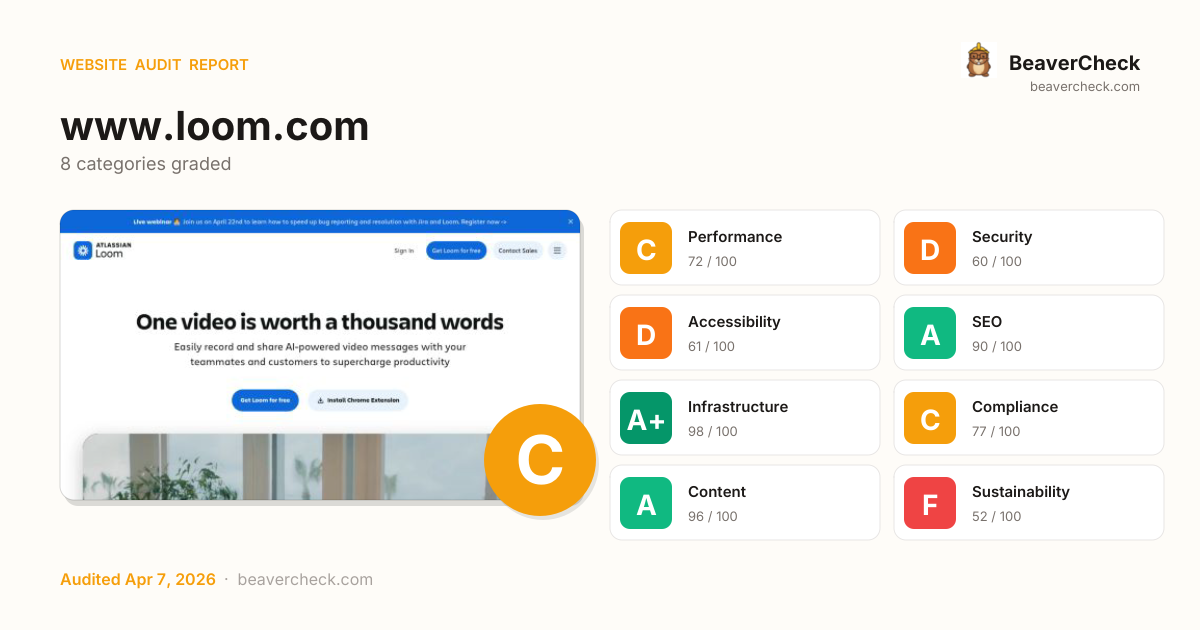
Categories
8Performance
Page weighs 14.8 MB (5.6 MB transferred)
Security
Content-Security-Policy header is missing
Accessibility
2 button(s) with no accessible text
SEO
All checks pass
Infrastructure
All checks pass
Compliance
All checks pass
Content
All checks pass
Sustainability
All checks pass
How you compare
Where this site stands against peers running the same stack.
Technology stack
Sanity, on Emotion, hosted on Amazon Web Services, with AWS CloudFront CDN
Stack Architecture
 Datadog
  Statsig 3.25.5
 Sanity Sanity.io
  Google Font API HSTS
  HTTP/3
  OneTrust
  Open Graph
  React
React  Tailwind CSS
  Underscore.js 4.17.21
 Webpack
  dc.js
dc.js  Emotion
  AWS CloudFront Amazon CloudFront
  Amazon Web Services
  Next.js 14.2.32
 Vercel
 All Detected Technologies (20)
Amazon CloudFront is a fast content delivery network (CDN) service that securely delivers data, videos, applications, and APIs to customers globally with low latency, high transfer speeds.
Amazon Web Services (AWS) is a comprehensive cloud services platform offering compute power, database storage, content delivery and other functionality.
Next.js is a React framework for developing single page Javascript applications.
Vercel is a cloud platform for static frontends and serverless functions.
Emotion is a library designed for writing CSS styles with JavaScript.
Sanity is a platform for structured content. It comes with an open-source, headless CMS that can be customized with Javascript, a real-time hosted data store and an asset delivery pipeline.
Sanity is a platform for structured content. It comes with an open-source, headless CMS that can be customized with Javascript, a real-time hosted data store and an asset delivery pipeline.
Google Font API is a web service that supports open-source font files that can be used on your web designs.
HTTP Strict Transport Security (HSTS) informs browsers that the site should only be accessed using HTTPS.
HTTP/3 is the third major version of the Hypertext Transfer Protocol used to exchange information on the World Wide Web.
OneTrust is a cloud-based data privacy management compliance platform.
Open Graph is a protocol that is used to integrate any web page into the social graph.
React is an open-source JavaScript library for building user interfaces or UI components.
Underscore.js is a JavaScript library which provides utility functions for common programming tasks. It is comparable to features provided by Prototype.js and the Ruby language, but opts for a functional programming design instead of extending object prototypes.
Webpack is an open-source JavaScript module bundler.
A multi-dimensional charting library built to work natively with crossfilter and rendered using d3.js
Datadog is a SaaS-based monitoring and analytics platform for large-scale applications and infrastructure.
Statsig is a modern product experimentation platform that helps product teams continuously measure impact of every single feature they launch.
Observations (2)
No build tool detected
A framework (Google Font API) was detected but no bundler was identified. The build tool may not be detectable from output patterns, or the site may use the framework's built-in bundler.
Complex technology stack detected
20 technologies identified. A complex stack increases maintenance burden and attack surface. Consider whether all components are actively needed.
Show your score
Drop this badge on your README, marketing site, or status page. It auto-updates every time the audit re-runs and links back to this report.
This badge auto-updates with your latest scan result.
[](https://beavercheck.com/results/f6d78266-6daf-f7e1-5b1b-9850e8e17f76)<a href="https://beavercheck.com/results/f6d78266-6daf-f7e1-5b1b-9850e8e17f76"><img src="https://beavercheck.com/badge?url=https%3A%2F%2Fwww.loom.com" alt="BeaverCheck Score"></a>https://beavercheck.com/badge?url=https%3A%2F%2Fwww.loom.comExport & share
Download the audit, share with your team, or grab a fix plan ready to copy into your tracker.
Copies markdown to clipboard
Fix Plan
Three-week roadmap to ship the audit's findings, with one-click copy targets for your tracker.
Three-week fix plan
2 sprints · 7h total → projected B (83)
Sprint 1: Quick Wins
+5Highest ROI — low effort, high impact
- · Page weighs 14.8 MB (5.6 MB transferred)
- · 2 button(s) with no accessible text
- · 4 image-only link(s) without alt text
Sprint 2: Core Fixes
+5Medium effort, high structural impact
- · Content-Security-Policy header is missing
- · No Content-Security-Policy header found