Netherlands · Amsterdam Completed: Apr 4, 2026 18:29 UTC
Mobile 375 × 812

Desktop 1440 × 900

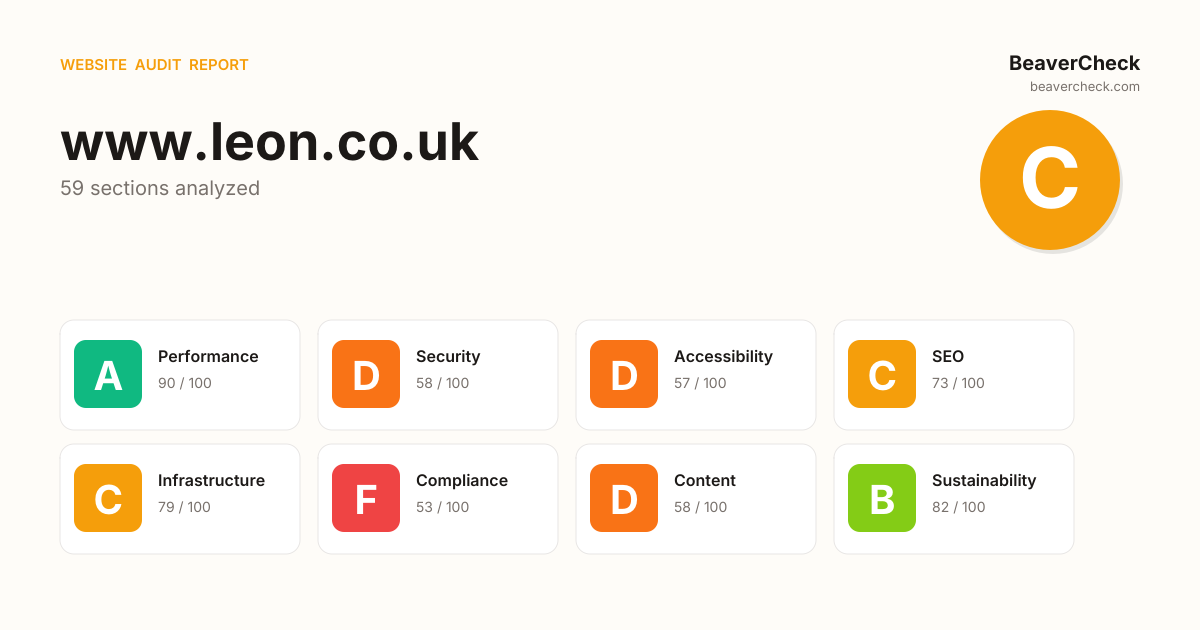
Score: 70 / 100
Based on 8 categories, 0 sections
The overall score is a weighted average of individual category scores. Categories with more impact on user experience and security carry more weight.
Weights reflect general web best practices. Individual needs may differ.
Content-Security-Policy header is missing
HSTS header is missing
No Content-Security-Policy header found
1 image(s) missing alt attribute
No <main> landmark found
[](https://beavercheck.com/results/fb534a5f-b2d3-4a6e-847d-093a0812965f)<a href="https://beavercheck.com/results/fb534a5f-b2d3-4a6e-847d-093a0812965f"><img src="https://beavercheck.com/badge?url=https%3A%2F%2Fwww.leon.co.uk" alt="BeaverCheck Score"></a>https://beavercheck.com/badge?url=https%3A%2F%2Fwww.leon.co.ukThis badge auto-updates with your latest scan result.
Thanks for your feedback!
Industry-standard audits powered by Google Lighthouse.
Key metrics that affect user experience.
First Contentful Paint First Contentful Paint — how long until the browser renders the first piece of content. Under 1.8s is good.
3.05 s
Largest Contentful Paint Largest Contentful Paint — how long until the largest visible element loads. Under 2.5s is good.
3.05 s
Total Blocking Time Total Blocking Time — total time the main thread was blocked, preventing user input. Under 200ms is good.
290 ms
Cumulative Layout Shift Cumulative Layout Shift — measures visual stability. How much the page layout shifts during loading. Under 0.1 is good.
0.000
Speed Index Speed Index — how quickly content is visually displayed during load. Under 3.4s is good.
3.05 s
Time to Interactive Time to Interactive — how long until the page is fully interactive and responds to user input. Under 3.8s is good.
4.59 s
Audit breakdown by category with detailed findings.
Remove large, duplicate JavaScript modules from bundles to reduce unnecessary bytes consumed by network activity.
Polyfills and transforms enable older browsers to use new JavaScript features. However, many aren't necessary for modern browsers. Consider modifying your JavaScript build process to not transpile Baseline features, unless you know you must support older browsers. Learn why most sites can deploy ES6+ code without transpiling
3rd party code can significantly impact load performance. Reduce and defer loading of 3rd party code to prioritize your page's content.
Your first network request is the most important. Reduce its latency by avoiding redirects, ensuring a fast server response, and enabling text compression.
Avoid chaining critical requests by reducing the length of chains, reducing the download size of resources, or deferring the download of unnecessary resources to improve page load.
Requests are blocking the page's initial render, which may delay LCP. Deferring or inlining can move these network requests out of the critical path.
| URL | Transfer Size | Duration |
|---|---|---|
| fonts.googleapis.com/css?family=Josefin+Sans:400 | 954 B | 759 ms |
A long cache lifetime can speed up repeat visits to your page. Learn more about caching.
| Request | Cache TTL | Transfer Size |
|---|---|---|
| www.google-analytics.com/analytics.js | 7200.0 s | 20.9 KiB |
Consider setting font-display to swap or optional to ensure text is consistently visible. swap can be further optimized to mitigate layout shifts with font metric overrides.
| URL | Est Savings |
|---|---|
| /s/josefinsans/v34/Qw3PZQNVED7rKGKxtqIqX5E-AVSJrOCfjY46_D... | 5.0 ms |
Tap interactions may be delayed by up to 300 ms if the viewport is not optimized for mobile.
These insights are also available in the Chrome DevTools Performance Panel - record a trace to view more detailed information.
Redirects introduce additional delays before the page can be loaded. Learn how to avoid page redirects.
| URL | Time Spent |
|---|---|
| www.leon.co.uk/ | 785 ms |
| leon.co.uk/ | 0.0 ms |
The maximum potential First Input Delay that your users could experience is the duration of the longest task. Learn more about the Maximum Potential First Input Delay metric.
Time to Interactive is the amount of time it takes for the page to become fully interactive. Learn more about the Time to Interactive metric.
Reduce unused JavaScript and defer loading scripts until they are required to decrease bytes consumed by network activity. Learn how to reduce unused JavaScript.
| URL | Transfer Size | Est Savings |
|---|---|---|
| www.googletagmanager.com/gtag/js?id=G-F7VWD6N0RY&cx=c&_slc=1 | 146.1 KiB | 62.5 KiB |
Set an explicit width and height on image elements to reduce layout shifts and improve CLS. Learn how to set image dimensions
| URL | |
|---|---|
body > h1 > img body > h1 > img | leon.co.uk/info-at-leon.jpg |
More information about the performance of your application. These numbers don't directly affect the Performance score.
These checks highlight opportunities to improve the accessibility of your web app. Automatic detection can only detect a subset of issues and does not guarantee the accessibility of your web app, so manual testing is also encouraged.
If a page doesn't specify a `lang` attribute, a screen reader assumes that the page is in the default language that the user chose when setting up the screen reader. If the page isn't actually in the default language, then the screen reader might not announce the page's text correctly. Learn more about the `lang` attribute.
| Failing Elements |
|---|
html html |
These are opportunities to improve the interpretation of your content by users in different locales.
Informative elements should aim for short, descriptive alternate text. Decorative elements can be ignored with an empty alt attribute. Learn more about the `alt` attribute.
| Failing Elements |
|---|
body > h1 > img body > h1 > img |
These are opportunities to improve the semantics of the controls in your application. This may enhance the experience for users of assistive technology, like a screen reader.
One main landmark helps screen reader users navigate a web page. Learn more about landmarks.
| Failing Elements |
|---|
html html |
These items highlight common accessibility best practices.
Image natural dimensions should be proportional to the display size and the pixel ratio to maximize image clarity. Learn how to provide responsive images.
| URL | Displayed size | Actual size | Expected size | |
|---|---|---|---|---|
body > h1 > img body > h1 > img | leon.co.uk/info-at-leon.jpg | 371 x 85 | 371 x 85 | 557 x 128 |
Specifying a doctype prevents the browser from switching to quirks-mode. Learn more about the doctype declaration.
A character encoding declaration is required. It can be done with a `<meta>` tag in the first 1024 bytes of the HTML or in the Content-Type HTTP response header. Learn more about declaring the character encoding.
Errors logged to the console indicate unresolved problems. They can come from network request failures and other browser concerns. Learn more about this errors in console diagnostic audit
| Source | Description |
|---|---|
Failed to load resource: the server responded with a status of 404 () |
These checks ensure that your page is following basic search engine optimization advice. There are many additional factors Lighthouse does not score here that may affect your search ranking, including performance on Core Web Vitals. Learn more about Google Search Essentials.
Informative elements should aim for short, descriptive alternate text. Decorative elements can be ignored with an empty alt attribute. Learn more about the `alt` attribute.
| Failing Elements |
|---|
body > h1 > img body > h1 > img |
Format your HTML in a way that enables crawlers to better understand your app’s content.
Industry-standard audits powered by Google Lighthouse. — Desktop
Key metrics that affect user experience. — Desktop
First Contentful Paint First Contentful Paint — how long until the browser renders the first piece of content. Under 1.8s is good.
895 ms
Largest Contentful Paint Largest Contentful Paint — how long until the largest visible element loads. Under 2.5s is good.
895 ms
Total Blocking Time Total Blocking Time — total time the main thread was blocked, preventing user input. Under 200ms is good.
28 ms
Cumulative Layout Shift Cumulative Layout Shift — measures visual stability. How much the page layout shifts during loading. Under 0.1 is good.
0.000
Speed Index Speed Index — how quickly content is visually displayed during load. Under 3.4s is good.
895 ms
Time to Interactive Time to Interactive — how long until the page is fully interactive and responds to user input. Under 3.8s is good.
1.19 s
Audit breakdown by category with detailed findings.
Remove large, duplicate JavaScript modules from bundles to reduce unnecessary bytes consumed by network activity.
Polyfills and transforms enable older browsers to use new JavaScript features. However, many aren't necessary for modern browsers. Consider modifying your JavaScript build process to not transpile Baseline features, unless you know you must support older browsers. Learn why most sites can deploy ES6+ code without transpiling
3rd party code can significantly impact load performance. Reduce and defer loading of 3rd party code to prioritize your page's content.
Your first network request is the most important. Reduce its latency by avoiding redirects, ensuring a fast server response, and enabling text compression.
Avoid chaining critical requests by reducing the length of chains, reducing the download size of resources, or deferring the download of unnecessary resources to improve page load.
Requests are blocking the page's initial render, which may delay LCP. Deferring or inlining can move these network requests out of the critical path.
| URL | Transfer Size | Duration |
|---|---|---|
| fonts.googleapis.com/css?family=Josefin+Sans:400 | 957 B | 207 ms |
A long cache lifetime can speed up repeat visits to your page. Learn more about caching.
| Request | Cache TTL | Transfer Size |
|---|---|---|
| www.google-analytics.com/analytics.js | 7200.0 s | 20.9 KiB |
Consider setting font-display to swap or optional to ensure text is consistently visible. swap can be further optimized to mitigate layout shifts with font metric overrides.
| URL | Est Savings |
|---|---|
| /s/josefinsans/v34/Qw3PZQNVED7rKGKxtqIqX5E-AVSJrOCfjY46_D... | 5.0 ms |
These insights are also available in the Chrome DevTools Performance Panel - record a trace to view more detailed information.
Reduce unused JavaScript and defer loading scripts until they are required to decrease bytes consumed by network activity. Learn how to reduce unused JavaScript.
| URL | Transfer Size | Est Savings |
|---|---|---|
| www.googletagmanager.com/gtag/js?id=G-F7VWD6N0RY&cx=c&_slc=1 | 146.1 KiB | 63.2 KiB |
Set an explicit width and height on image elements to reduce layout shifts and improve CLS. Learn how to set image dimensions
| URL | |
|---|---|
body > h1 > img body > h1 > img | leon.co.uk/info-at-leon.jpg |
More information about the performance of your application. These numbers don't directly affect the Performance score.
Redirects introduce additional delays before the page can be loaded. Learn how to avoid page redirects.
| URL | Time Spent |
|---|---|
| www.leon.co.uk/ | 212 ms |
| leon.co.uk/ | 0.0 ms |
These checks highlight opportunities to improve the accessibility of your web app. Automatic detection can only detect a subset of issues and does not guarantee the accessibility of your web app, so manual testing is also encouraged.
If a page doesn't specify a `lang` attribute, a screen reader assumes that the page is in the default language that the user chose when setting up the screen reader. If the page isn't actually in the default language, then the screen reader might not announce the page's text correctly. Learn more about the `lang` attribute.
| Failing Elements |
|---|
html html |
These are opportunities to improve the interpretation of your content by users in different locales.
Informative elements should aim for short, descriptive alternate text. Decorative elements can be ignored with an empty alt attribute. Learn more about the `alt` attribute.
| Failing Elements |
|---|
body > h1 > img body > h1 > img |
These are opportunities to improve the semantics of the controls in your application. This may enhance the experience for users of assistive technology, like a screen reader.
One main landmark helps screen reader users navigate a web page. Learn more about landmarks.
| Failing Elements |
|---|
html html |
These items highlight common accessibility best practices.
Specifying a doctype prevents the browser from switching to quirks-mode. Learn more about the doctype declaration.
A character encoding declaration is required. It can be done with a `<meta>` tag in the first 1024 bytes of the HTML or in the Content-Type HTTP response header. Learn more about declaring the character encoding.
Errors logged to the console indicate unresolved problems. They can come from network request failures and other browser concerns. Learn more about this errors in console diagnostic audit
| Source | Description |
|---|---|
Failed to load resource: the server responded with a status of 404 () |
These checks ensure that your page is following basic search engine optimization advice. There are many additional factors Lighthouse does not score here that may affect your search ranking, including performance on Core Web Vitals. Learn more about Google Search Essentials.
Informative elements should aim for short, descriptive alternate text. Decorative elements can be ignored with an empty alt attribute. Learn more about the `alt` attribute.
| Failing Elements |
|---|
body > h1 > img body > h1 > img |
Format your HTML in a way that enables crawlers to better understand your app’s content.
Send Feedback