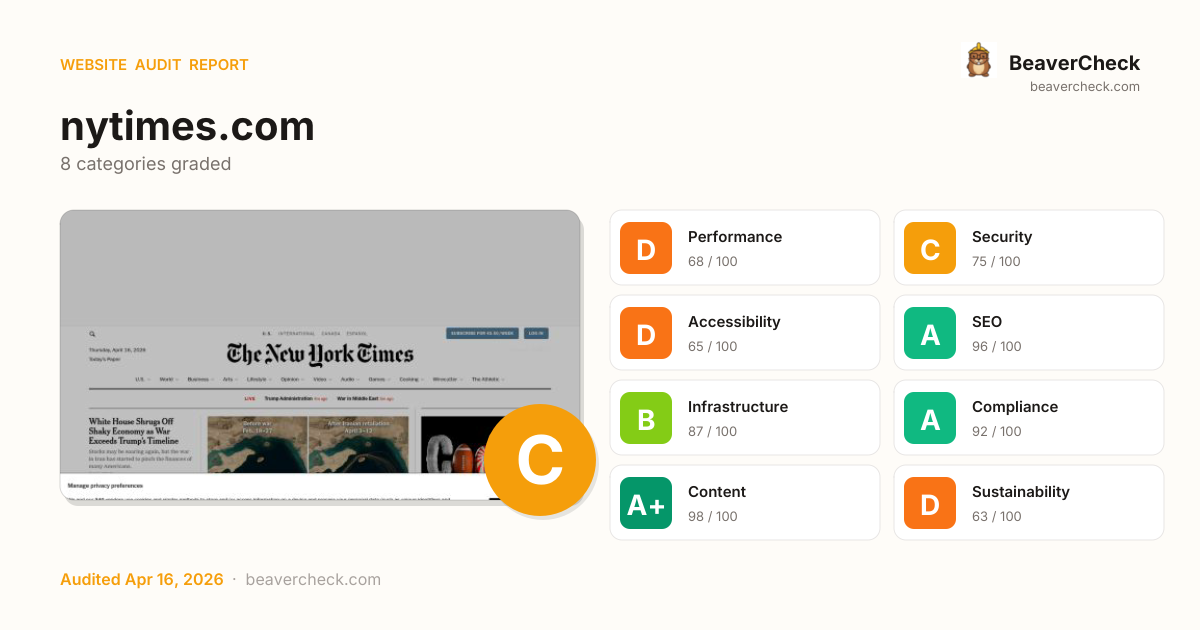
Mobile 375 × 812

Desktop 1440 × 900

Score: 77 / 100
Based on 8 categories, 0 sections
Room to improve — your 29.4s load time is above Google's 2.5s 'Good' threshold.
Good foundation, but a few gaps could be exploited.
Several issues make your site difficult for assistive technology users.
Well-optimized for search — your content is discoverable.
Solid infrastructure — fast server responses across the board.
Strong compliance posture across regulations.
Rich content metadata — your pages look great everywhere.
Heavier than average — reducing page weight saves energy and bandwidth.
The overall score is a weighted average of individual category scores. Categories with more impact on user experience and security carry more weight.
Weights reflect general web best practices. Individual needs may differ.
'unsafe-eval' found in script source
Security gaps expose your site and users to attacks, eroding trust.
'unsafe-inline' found in script source
Security gaps expose your site and users to attacks, eroding trust.
Cookie 'nyt-gdpr' is missing the Secure flag
Security gaps expose your site and users to attacks, eroding trust.
Page weighs 27.6 MB (16.6 MB transferred)
Performance issues directly impact user engagement and conversion rates.
20 link(s) with no accessible text
Accessibility issues exclude users with disabilities — up to 15% of your potential audience.
High impact, low effort — start here.
High impact, requires investment.
Small gains, minimal effort.
Nothing in this quadrant — good news.
Low impact, high effort — do last.
Nothing in this quadrant — good news.
[](https://beavercheck.com/results/fb68e8b9-1cd8-4c82-b24c-ed85ad232942)<a href="https://beavercheck.com/results/fb68e8b9-1cd8-4c82-b24c-ed85ad232942"><img src="https://beavercheck.com/badge?url=https%3A%2F%2Fnytimes.com" alt="BeaverCheck Score"></a>https://beavercheck.com/badge?url=https%3A%2F%2Fnytimes.comThis badge auto-updates with your latest scan result.
Your site performs reasonably well, but a few targeted fixes could meaningfully improve results. Your LCP of 29.4s exceeds Google's 2.5s 'Good' threshold and the 1 performance issue below directly contributes to it. Addressing the critical issues below would have the most immediate impact on your user trust.
6 barrier(s) likely increasing bounce by ~26%.
Page takes 29.4s to load
+12% bounceUsers abandon at ~3s — you're 26.9s over the 2.5s threshold
Fix: Optimize render-blocking resources, preload the hero image, and compress images
Page feels frozen for 4.9s
+5% bounceClicks on the primary CTA are ignored while JavaScript runs
Fix: Break up long tasks; defer non-critical JavaScript to post-hydration
No Content-Security-Policy header
+1% bounceHigher XSS blast radius — one compromised script can exfiltrate the checkout form
Fix: Ship a reporting-only CSP first, then enforce once violations are clean
Content is hard to read
+2% bounceGraduate-level reading difficulty — limits the addressable audience for product or blog pages
Fix: Shorten sentences; replace jargon with plain language; target Flesch ease ≥60
20 link(s) with generic text ("click here", "read more")
+1% bounceScreen-reader users navigating by link list see no context — and search engines can't infer relevance
Fix: Rewrite with descriptive phrases that identify the destination
No skip-to-content link
+1% bounceKeyboard and screen-reader users must tab through the entire header on every page
Fix: Add a visible-on-focus <a href="#main">Skip to content</a> as the first focusable element
Preliminary CRO audit — each barrier links to the tab with detailed analysis.
€425 investment → €3.86/month returns + EUR 500,000 risk avoided
€425
5h · 5 findings
€3.86 /mo
~€46 / year
EUR 500,000
if kept compliant
€128 — in quick wins — start here for the fastest payback
Figures combine localized regulatory fine ceilings, search/conversion value priced against local CPC, and bandwidth waste estimates. Results depend on implementation quality and audience composition. Not legal or financial advice.
5.0 developer hours at €85/hr
Based on European Union rates (€85/hr)
Start here for the best return on investment
€41,671 / month at risk
~€500,046 / year if left unfixed
€500,000
€3.86 /mo
52109.2 MB/mo × 0.074 EUR/GB
Compliance figures represent the statutory maximum fine for the most severe triggered category, capped per regulation — not the sum of per-finding penalties. Based on published regulatory fine ranges. This is not legal advice.
Unique monthly visitors from your analytics
Purchases, signups, or key actions
Optional — for revenue estimation
more engaged visitors from reduced bounce
Fix 5 critical issues to capture this value
Based on Google/Deloitte research ("Milliseconds Make Millions") showing a ~7% bounce rate increase per additional second of LCP above the 2.5s "Good" threshold.
Your site's LCP: → estimated after fixes.
These are estimates based on industry research — actual results vary
Your data stays in your browser — nothing is sent to our servers
Thanks for your feedback!
We'll use a cached audit if available, or offer to scan.
Industry-standard audits powered by Google Lighthouse.
Key metrics that affect user experience.
First Contentful Paint First Contentful Paint — how long until the browser renders the first piece of content. Under 1.8s is good.
6.79 s
Largest Contentful Paint Largest Contentful Paint — how long until the largest visible element loads. Under 2.5s is good.
29.39 s
Total Blocking Time Total Blocking Time — total time the main thread was blocked, preventing user input. Under 200ms is good.
4.91 s
Cumulative Layout Shift Cumulative Layout Shift — measures visual stability. How much the page layout shifts during loading. Under 0.1 is good.
0.022
Speed Index Speed Index — how quickly content is visually displayed during load. Under 3.4s is good.
13.27 s
Time to Interactive Time to Interactive — how long until the page is fully interactive and responds to user input. Under 3.8s is good.
31.65 s
Audit breakdown by category with detailed findings.
Remove large, duplicate JavaScript modules from bundles to reduce unnecessary bytes consumed by network activity.
Performance issues directly impact user engagement and conversion rates.
Polyfills and transforms enable older browsers to use new JavaScript features. However, many aren't necessary for modern browsers. Consider modifying your JavaScript build process to not transpile Baseline features, unless you know you must support older browsers. Learn why most sites can deploy ES6+ code without transpiling
Shipping ES5 transpiled code to modern browsers wastes bytes — every user with an evergreen browser pays for compatibility you don't need.
Most users today run browsers that natively support ES6+, async/await, optional chaining, and the rest of modern JavaScript. Transpiling to ES5 'just in case' adds 20-40% to your bundle for no benefit. Configure your build to target a modern browserslist, or ship a differential bundle pair (modern + legacy) with the module/nomodule pattern.
Source: Google web.dev / Lighthouse
3rd party code can significantly impact load performance. Reduce and defer loading of 3rd party code to prioritize your page's content.
Performance issues directly impact user engagement and conversion rates.
A long cache lifetime can speed up repeat visits to your page. Learn more about caching.
Performance issues directly impact user engagement and conversion rates.
A forced reflow occurs when JavaScript queries geometric properties (such as offsetWidth) after styles have been invalidated by a change to the DOM state. This can result in poor performance. Learn more about forced reflows and possible mitigations.
Performance issues directly impact user engagement and conversion rates.
Reducing the download time of images can improve the perceived load time of the page and LCP. Learn more about optimizing image size
Performance issues directly impact user engagement and conversion rates.
| URL | Resource Size | Est Savings | |
|---|---|---|---|
img._poster_13tnt_20 img._poster_13tnt_20 | /images/2026/04/15/arts/DS_Thumbnail/DS_Thumbnail-vertica... | 631.1 KiB | 616.9 KiB |
img._poster_13tnt_20 img._poster_13tnt_20 | /images/2026/04/15/arts/Screenshot-2026-04-15-at-5/Screen... | 528.6 KiB | 494.8 KiB |
img._poster_13tnt_20 img._poster_13tnt_20 | /images/2026/04/13/arts/RV_Thumbnail-groupchat/RV_Thumbna... | 481.4 KiB | 467.3 KiB |
img._poster_13tnt_20 img._poster_13tnt_20 | /images/2026/02/10/multimedia/AS-One-pan-white-wine-pasta... | 76.1 KiB | 68.0 KiB |
Marie-Thérèse Ross-Mahé and Bill Ross pose in front of a large truck. div > div.css-hjiaw4 > picture.css-hdqqnp > img.css-yf0ys | /images/2026/04/16/multimedia/16nat-french-detained-jvtp/... | 68.8 KiB | 46.3 KiB |
The pope, dressed in white robes, sits on a platform. A crowd fills the foregro… div > div.css-hjiaw4 > picture.css-hdqqnp > img.css-yf0ys | /images/2026/04/16/multimedia/16int-pope-cameroon-plgm/16... | 55.9 KiB | 37.0 KiB |
img._poster_13tnt_20 img._poster_13tnt_20 | /images/2026/04/15/multimedia/15cul-picasso-winner-qzkt/1... | 39.2 KiB | 35.0 KiB |
img._poster_13tnt_20 img._poster_13tnt_20 | /images/2026/04/15/multimedia/15DC-ARCH-TOP-vtlm/15DC-ARC... | 32.7 KiB | 29.2 KiB |
Avoid chaining critical requests by reducing the length of chains, reducing the download size of resources, or deferring the download of unnecessary resources to improve page load.
Performance issues directly impact user engagement and conversion rates.
Requests are blocking the page's initial render, which may delay LCP. Deferring or inlining can move these network requests out of the critical path.
Performance issues directly impact user engagement and conversion rates.
| URL | Transfer Size | Duration |
|---|---|---|
| g1.nyt.com/fonts/css/web-fonts.css | 6.7 KiB | 151 ms |
| g1.nyt.com/fonts/css/web-fonts.c851560786173ad206e1f76c1901be7e096e8f8b.css | 6.8 KiB | 756 ms |
| /vi-assets/static-assets/cssModulesStyles-194a4f08b37a2be... | 52.1 KiB | 902 ms |
| /vi-assets/static-assets/global-bf55b3b62e74478ad48892213... | 3.8 KiB |
Your first network request is the most important. Reduce its latency by avoiding redirects, ensuring a fast server response, and enabling text compression.
Performance issues directly impact user engagement and conversion rates.
These insights are also available in the Chrome DevTools Performance Panel - record a trace to view more detailed information.
Time to Interactive is the amount of time it takes for the page to become fully interactive. Learn more about the Time to Interactive metric.
Performance issues directly impact user engagement and conversion rates.
The maximum potential First Input Delay that your users could experience is the duration of the longest task. Learn more about the Maximum Potential First Input Delay metric.
Performance issues directly impact user engagement and conversion rates.
Redirects introduce additional delays before the page can be loaded. Learn how to avoid page redirects.
Performance issues directly impact user engagement and conversion rates.
| URL | Time Spent |
|---|---|
| nytimes.com/ | 753 ms |
| www.nytimes.com/ | 0.0 ms |
Reduce unused rules from stylesheets and defer CSS not used for above-the-fold content to decrease bytes consumed by network activity. Learn how to reduce unused CSS.
Performance issues directly impact user engagement and conversion rates.
| URL | Transfer Size | Est Savings |
|---|---|---|
| .css-1pg5jir { max-width: calc(100% - 40px); margin: auto; } … | 52.3 KiB | 52.0 KiB |
| /vi-assets/static-assets/cssModulesStyles-194a4f08b37a2be... | 50.5 KiB | 50.4 KiB |
Reduce unused JavaScript and defer loading scripts until they are required to decrease bytes consumed by network activity. Learn how to reduce unused JavaScript.
Multi-megabyte JavaScript bundles delay every interactive feature on the page.
This is the Lighthouse audit fired when too much JS is shipped relative to what executes. The fix isn't a config flag — it requires bundle analysis (webpack-bundle-analyzer, rollup-plugin-visualizer), splitting routes into chunks, lazy-loading off-screen components, and removing unused dependencies. Fundamentally different from minification: minifying reduces byte count, this reduces what's downloaded at all.
Source: Google web.dev / Lighthouse
| URL | Transfer Size | Est Savings |
|---|---|---|
| www.nytimes.com/vi-assets/static-assets/main-d9016001b7d9c9ed2c45.js | 929.3 KiB | 401.0 KiB |
| www.nytimes.com/vi-assets/static-assets/home-7ec14230b5e40376466c.js | 457.3 KiB | 204.0 KiB |
| static01.nyt.com/video-static/betamax/hlsjs-Bt8316rQ.js | 146.2 KiB | 139.6 KiB |
| /pagead/managed/js/gpt/m202604140101/pubads_impl.js?cb=31... | 187.7 KiB | 134.3 KiB |
| www.nytimes.com/vi-assets/static-assets/vendor-a174c85d4d9cb7e7c988.js | 105.8 KiB | 91.0 KiB |
| /gtm.js?id=GTM-P528B3>m_auth=tfAzqo1rYDLgYhmTnSjPqw>m... | 191.7 KiB | 74.7 KiB |
| accounts.google.com/gsi/client | 95.4 KiB | 71.1 KiB |
| www.datadoghq-browser-agent.com/us1/v6/datadog-rum.js | 57.9 KiB | 28.6 KiB |
| pay.google.com/gp/p/js/pay.js | 57.4 KiB | 24.7 KiB |
| pagead2.googlesyndication.com/tag/js/gpt.js | 34.2 KiB | 24.0 KiB |
| /vi-assets/static-assets/fides-e7243ebfa531534e8ccb023358... | 94.8 KiB | 23.2 KiB |
Consider reducing the time spent parsing, compiling, and executing JS. You may find delivering smaller JS payloads helps with this. Learn how to reduce Javascript execution time.
Performance issues directly impact user engagement and conversion rates.
Consider reducing the time spent parsing, compiling and executing JS. You may find delivering smaller JS payloads helps with this. Learn how to minimize main-thread work
Performance issues directly impact user engagement and conversion rates.
| Category | Time Spent |
|---|---|
| Script Evaluation | 11.4 s |
| Other | 2.6 s |
| Style & Layout | 1.2 s |
| Script Parsing & Compilation | 1.1 s |
| Parse HTML & CSS | 366 ms |
| Garbage Collection | 322 ms |
| Rendering | 250 ms |
Many navigations are performed by going back to a previous page, or forwards again. The back/forward cache (bfcache) can speed up these return navigations. Learn more about the bfcache
Performance issues directly impact user engagement and conversion rates.
| Failure reason | Failure type |
|---|---|
| The page has an unload handler in the main frame. | Actionable |
Minifying CSS files can reduce network payload sizes. Learn how to minify CSS.
Performance issues directly impact user engagement and conversion rates.
| URL | Transfer Size | Est Savings |
|---|---|---|
| .css-1pg5jir { max-width: calc(100% - 40px); margin: auto; } … | 52.3 KiB | 5.8 KiB |
Large network payloads cost users real money and are highly correlated with long load times. Learn how to reduce payload sizes.
Performance issues directly impact user engagement and conversion rates.
More information about the performance of your application. These numbers don't directly affect the Performance score.
These checks highlight opportunities to improve the accessibility of your web app. Automatic detection can only detect a subset of issues and does not guarantee the accessibility of your web app, so manual testing is also encouraged.
Informative elements should aim for short, descriptive alternate text. Decorative elements can be ignored with an empty alt attribute. Learn more about the `alt` attribute.
Performance issues directly impact user engagement and conversion rates.
| Failing Elements |
|---|
img._poster_13tnt_20 img._poster_13tnt_20 |
These are opportunities to improve the semantics of the controls in your application. This may enhance the experience for users of assistive technology, like a screen reader.
Touch targets with sufficient size and spacing help users who may have difficulty targeting small controls to activate the targets. Learn more about touch targets.
Performance issues directly impact user engagement and conversion rates.
| Failing Elements |
|---|
NYTCo nav#footer > ul.css-t8x4fj > li.css-a7htku > a.css-jq1cx6 |
Contact Us nav#footer > ul.css-t8x4fj > li.css-a7htku > a.css-jq1cx6 |
Accessibility nav#footer > ul.css-t8x4fj > li.css-a7htku > a.css-jq1cx6 |
Work with us nav#footer > ul.css-t8x4fj > li.css-a7htku > a.css-jq1cx6 |
Advertise nav#footer > ul.css-t8x4fj > li.css-a7htku > a.css-jq1cx6 |
T Brand Studio nav#footer > ul.css-t8x4fj > li.css-a7htku > a.css-jq1cx6 |
Privacy Policy nav#footer > ul.css-t8x4fj > li.css-a7htku > a.css-jq1cx6 |
Cookie Policy nav#footer > ul.css-t8x4fj > li.css-a7htku > a.css-jq1cx6 |
Terms of Service nav#footer > ul.css-t8x4fj > li.css-a7htku > a.css-jq1cx6 |
These items highlight common accessibility best practices.
Deprecated APIs will eventually be removed from the browser. Learn more about deprecated APIs.
Performance issues directly impact user engagement and conversion rates.
| Deprecation / Warning | Source |
|---|---|
| Unload event listeners are deprecated and will be removed. |
Errors logged to the console indicate unresolved problems. They can come from network request failures and other browser concerns. Learn more about this errors in console diagnostic audit
Performance issues directly impact user engagement and conversion rates.
| Source | Description |
|---|---|
[GSI_LOGGER]: FedCM get() rejects with NetworkError: Error retrieving a token. | |
Not signed in with the identity provider. |
Source maps translate minified code to the original source code. This helps developers debug in production. In addition, Lighthouse is able to provide further insights. Consider deploying source maps to take advantage of these benefits. Learn more about source maps.
Performance issues directly impact user engagement and conversion rates.
These checks ensure that your page is following basic search engine optimization advice. There are many additional factors Lighthouse does not score here that may affect your search ranking, including performance on Core Web Vitals. Learn more about Google Search Essentials.
Descriptive link text helps search engines understand your content. Learn how to make links more accessible.
Performance issues directly impact user engagement and conversion rates.
| Link destination | Link Text |
|---|---|
| www.nytimes.com/2026/04/14/us/politics/trump-iran-blockade-china.html | Read more |
Informative elements should aim for short, descriptive alternate text. Decorative elements can be ignored with an empty alt attribute. Learn more about the `alt` attribute.
Performance issues directly impact user engagement and conversion rates.
| Failing Elements |
|---|
img._poster_13tnt_20 img._poster_13tnt_20 |
Format your HTML in a way that enables crawlers to better understand your app’s content.
Search engines may use `href` attributes on links to crawl websites. Ensure that the `href` attribute of anchor elements links to an appropriate destination, so more pages of the site can be discovered. Learn how to make links crawlable
Performance issues directly impact user engagement and conversion rates.
| Uncrawlable Link |
|---|
div > div.css-1wzkfo3 > div.css-cfnhvx > a.tpl-lbl div > div.css-1wzkfo3 > div.css-cfnhvx > a.tpl-lbl |
To appear in search results, crawlers need access to your app.
Industry-standard audits powered by Google Lighthouse. — Desktop
Key metrics that affect user experience. — Desktop
First Contentful Paint First Contentful Paint — how long until the browser renders the first piece of content. Under 1.8s is good.
1.25 s
Largest Contentful Paint Largest Contentful Paint — how long until the largest visible element loads. Under 2.5s is good.
2.70 s
Total Blocking Time Total Blocking Time — total time the main thread was blocked, preventing user input. Under 200ms is good.
1.22 s
Cumulative Layout Shift Cumulative Layout Shift — measures visual stability. How much the page layout shifts during loading. Under 0.1 is good.
0.019
Speed Index Speed Index — how quickly content is visually displayed during load. Under 3.4s is good.
4.53 s
Time to Interactive Time to Interactive — how long until the page is fully interactive and responds to user input. Under 3.8s is good.
7.33 s
Audit breakdown by category with detailed findings.
Remove large, duplicate JavaScript modules from bundles to reduce unnecessary bytes consumed by network activity.
Performance issues directly impact user engagement and conversion rates.
Polyfills and transforms enable older browsers to use new JavaScript features. However, many aren't necessary for modern browsers. Consider modifying your JavaScript build process to not transpile Baseline features, unless you know you must support older browsers. Learn why most sites can deploy ES6+ code without transpiling
Shipping ES5 transpiled code to modern browsers wastes bytes — every user with an evergreen browser pays for compatibility you don't need.
Most users today run browsers that natively support ES6+, async/await, optional chaining, and the rest of modern JavaScript. Transpiling to ES5 'just in case' adds 20-40% to your bundle for no benefit. Configure your build to target a modern browserslist, or ship a differential bundle pair (modern + legacy) with the module/nomodule pattern.
Source: Google web.dev / Lighthouse
3rd party code can significantly impact load performance. Reduce and defer loading of 3rd party code to prioritize your page's content.
Performance issues directly impact user engagement and conversion rates.
A long cache lifetime can speed up repeat visits to your page. Learn more about caching.
Performance issues directly impact user engagement and conversion rates.
A forced reflow occurs when JavaScript queries geometric properties (such as offsetWidth) after styles have been invalidated by a change to the DOM state. This can result in poor performance. Learn more about forced reflows and possible mitigations.
Performance issues directly impact user engagement and conversion rates.
Reducing the download time of images can improve the perceived load time of the page and LCP. Learn more about optimizing image size
Performance issues directly impact user engagement and conversion rates.
| URL | Resource Size | Est Savings | |
|---|---|---|---|
img._poster_13tnt_20 img._poster_13tnt_20 | /images/2026/04/15/arts/Screenshot-2026-04-15-at-5/Screen... | 528.6 KiB | 500.9 KiB |
Linda Greenhouse div.css-4se1tq > div.css-hjiaw4 > picture > img.css-1kx59a0 | /images/2018/04/02/opinion/linda-greenhouse/linda-greenho... | 24.3 KiB | 24.0 KiB |
Marie-Thérèse Ross-Mahé and Bill Ross pose in front of a large truck. div > div.css-q70vsu > picture.css-hdqqnp > img.css-yf0ys | /images/2026/04/16/multimedia/16nat-french-detained-jvtp/... | 43.8 KiB | 4.7 KiB |
Optimize LCP by making the LCP image discoverable from the HTML immediately, and avoiding lazy-loading
Performance issues directly impact user engagement and conversion rates.
Avoid chaining critical requests by reducing the length of chains, reducing the download size of resources, or deferring the download of unnecessary resources to improve page load.
Performance issues directly impact user engagement and conversion rates.
Requests are blocking the page's initial render, which may delay LCP. Deferring or inlining can move these network requests out of the critical path.
Performance issues directly impact user engagement and conversion rates.
| URL | Transfer Size | Duration |
|---|---|---|
| /vi-assets/static-assets/cssModulesStyles-194a4f08b37a2be... | 52.1 KiB | 162 ms |
| g1.nyt.com/fonts/css/web-fonts.c851560786173ad206e1f76c1901be7e096e8f8b.css | 6.8 KiB | 203 ms |
| /vi-assets/static-assets/global-bf55b3b62e74478ad48892213... | 3.8 KiB |
Your first network request is the most important. Reduce its latency by avoiding redirects, ensuring a fast server response, and enabling text compression.
Performance issues directly impact user engagement and conversion rates.
These insights are also available in the Chrome DevTools Performance Panel - record a trace to view more detailed information.
Redirects introduce additional delays before the page can be loaded. Learn how to avoid page redirects.
Performance issues directly impact user engagement and conversion rates.
| URL | Time Spent |
|---|---|
| nytimes.com/ | 239 ms |
| www.nytimes.com/ | 0.0 ms |
Time to Interactive is the amount of time it takes for the page to become fully interactive. Learn more about the Time to Interactive metric.
Performance issues directly impact user engagement and conversion rates.
The maximum potential First Input Delay that your users could experience is the duration of the longest task. Learn more about the Maximum Potential First Input Delay metric.
Performance issues directly impact user engagement and conversion rates.
Reduce unused JavaScript and defer loading scripts until they are required to decrease bytes consumed by network activity. Learn how to reduce unused JavaScript.
Multi-megabyte JavaScript bundles delay every interactive feature on the page.
This is the Lighthouse audit fired when too much JS is shipped relative to what executes. The fix isn't a config flag — it requires bundle analysis (webpack-bundle-analyzer, rollup-plugin-visualizer), splitting routes into chunks, lazy-loading off-screen components, and removing unused dependencies. Fundamentally different from minification: minifying reduces byte count, this reduces what's downloaded at all.
Source: Google web.dev / Lighthouse
| URL | Transfer Size | Est Savings |
|---|---|---|
| www.nytimes.com/vi-assets/static-assets/main-d9016001b7d9c9ed2c45.js | 929.3 KiB | 401.8 KiB |
| www.nytimes.com/vi-assets/static-assets/home-7ec14230b5e40376466c.js | 457.3 KiB | 196.9 KiB |
| /pagead/managed/js/gpt/m202604140101/pubads_impl.js?cb=31... | 187.7 KiB | 130.4 KiB |
| static01.nyt.com/video-static/betamax/hlsjs-Bt8316rQ.js | 106.9 KiB | 102.1 KiB |
| www.nytimes.com/vi-assets/static-assets/vendor-a174c85d4d9cb7e7c988.js | 105.8 KiB | 91.0 KiB |
| /gtm.js?id=GTM-P528B3>m_auth=tfAzqo1rYDLgYhmTnSjPqw>m... | 191.7 KiB | 74.7 KiB |
| accounts.google.com/gsi/client | 95.4 KiB | 71.1 KiB |
| www.datadoghq-browser-agent.com/us1/v6/datadog-rum.js | 57.9 KiB | 28.5 KiB |
| pay.google.com/gp/p/js/pay.js | 57.4 KiB | 25.4 KiB |
| pagead2.googlesyndication.com/tag/js/gpt.js | 34.2 KiB | 24.0 KiB |
| pagead2.googlesyndication.com/tag/js/gpt.js | 34.2 KiB | 24.0 KiB |
| /vi-assets/static-assets/fides-e7243ebfa531534e8ccb023358... | 94.8 KiB | 23.2 KiB |
Consider reducing the time spent parsing, compiling, and executing JS. You may find delivering smaller JS payloads helps with this. Learn how to reduce Javascript execution time.
Performance issues directly impact user engagement and conversion rates.
| URL | Total CPU Time | Script Evaluation | Script Parse |
|---|---|---|---|
| www.nytimes.com/vi-assets/static-assets/main-d9016001b7d9c9ed2c45.js | 2.7 s | 2.2 s | 90 ms |
| www.nytimes.com/ | 739 ms | 106 ms | 32 ms |
| Unattributable | 508 ms | 53 ms | 0.0 ms |
| static01.nyt.com/video-static/betamax/betamax-shared-sTKBl65Y.js | 315 ms | 249 ms | 0.1 ms |
| /vi-assets/static-assets/vendors~audio~byline~capsule~car... | 236 ms | 212 ms | 2.3 ms |
| www.nytimes.com/vi-assets/static-assets/adslot-59e729d7c8593a1554b2.js | 200 ms | 173 ms | 0.5 ms |
| /gtm.js?id=GTM-P528B3>m_auth=tfAzqo1rYDLgYhmTnSjPqw>m... | 189 ms | 148 ms | 27 ms |
| /pagead/managed/js/gpt/m202604140101/pubads_impl.js?cb=31... | 122 ms | 83 ms | 13 ms |
| dd.nytimes.com/tags.js | 98 ms | 79 ms | 3.2 ms |
| /vi-assets/static-assets/fides-e7243ebfa531534e8ccb023358... | 94 ms | 70 ms | 9.4 ms |
| www.datadoghq-browser-agent.com/us1/v6/datadog-rum.js | 83 ms | 72 ms | 4.0 ms |
Consider reducing the time spent parsing, compiling and executing JS. You may find delivering smaller JS payloads helps with this. Learn how to minimize main-thread work
Performance issues directly impact user engagement and conversion rates.
| Category | Time Spent |
|---|---|
| Script Evaluation | 3.5 s |
| Other | 756 ms |
| Style & Layout | 518 ms |
| Script Parsing & Compilation | 261 ms |
| Garbage Collection | 167 ms |
| Rendering | 133 ms |
| Parse HTML & CSS | 76 ms |
Many navigations are performed by going back to a previous page, or forwards again. The back/forward cache (bfcache) can speed up these return navigations. Learn more about the bfcache
Performance issues directly impact user engagement and conversion rates.
| Failure reason | Failure type |
|---|---|
| The page has an unload handler in the main frame. | Actionable |
Minifying CSS files can reduce network payload sizes. Learn how to minify CSS.
Performance issues directly impact user engagement and conversion rates.
| URL | Transfer Size | Est Savings |
|---|---|---|
| .css-1pg5jir { max-width: calc(100% - 40px); margin: auto; } … | 53.3 KiB | 5.9 KiB |
Reduce unused rules from stylesheets and defer CSS not used for above-the-fold content to decrease bytes consumed by network activity. Learn how to reduce unused CSS.
Performance issues directly impact user engagement and conversion rates.
| URL | Transfer Size | Est Savings |
|---|---|---|
| .css-1pg5jir { max-width: calc(100% - 40px); margin: auto; } … | 53.3 KiB | 51.9 KiB |
| /vi-assets/static-assets/cssModulesStyles-194a4f08b37a2be... | 15.9 KiB | 15.8 KiB |
Large network payloads cost users real money and are highly correlated with long load times. Learn how to reduce payload sizes.
Performance issues directly impact user engagement and conversion rates.
More information about the performance of your application. These numbers don't directly affect the Performance score.
These checks highlight opportunities to improve the accessibility of your web app. Automatic detection can only detect a subset of issues and does not guarantee the accessibility of your web app, so manual testing is also encouraged.
Low-contrast text is difficult or impossible for many users to read. Learn how to provide sufficient color contrast.
Performance issues directly impact user engagement and conversion rates.
| Failing Elements |
|---|
+0.22% div.css-27ffgo > div.css-m7oyll > div.css-1ooqyr8 > div.css-ke4w0y |
These are opportunities to improve the legibility of your content.
Informative elements should aim for short, descriptive alternate text. Decorative elements can be ignored with an empty alt attribute. Learn more about the `alt` attribute.
Performance issues directly impact user engagement and conversion rates.
| Failing Elements |
|---|
img._poster_13tnt_20 img._poster_13tnt_20 |
These are opportunities to improve the semantics of the controls in your application. This may enhance the experience for users of assistive technology, like a screen reader.
Touch targets with sufficient size and spacing help users who may have difficulty targeting small controls to activate the targets. Learn more about touch targets.
Performance issues directly impact user engagement and conversion rates.
| Failing Elements |
|---|
U.S. nav > ul.css-17j7fe1 > li.css-1bo3wsb > a.css-u90q6n |
open U.S. nav > ul.css-17j7fe1 > li.css-1bo3wsb > button.css-19wyrnd |
open World nav > ul.css-17j7fe1 > li.css-1bo3wsb > button.css-19wyrnd |
open Business nav > ul.css-17j7fe1 > li.css-1bo3wsb > button.css-19wyrnd |
Arts nav > ul.css-17j7fe1 > li.css-1bo3wsb > a.css-u90q6n |
open Arts nav > ul.css-17j7fe1 > li.css-1bo3wsb > button.css-19wyrnd |
open Lifestyle nav > ul.css-17j7fe1 > li.css-1bo3wsb > button.css-19wyrnd |
open Opinion nav > ul.css-17j7fe1 > li.css-1bo3wsb > button.css-19wyrnd |
Video nav > ul.css-17j7fe1 > li.css-1bo3wsb > a.css-u90q6n |
open Video nav > ul.css-17j7fe1 > li.css-1bo3wsb > button.css-19wyrnd |
open Audio nav > ul.css-17j7fe1 > li.css-1bo3wsb > button.css-19wyrnd |
open Games nav > ul.css-17j7fe1 > li.css-1bo3wsb > button.css-19wyrnd |
open Cooking nav > ul.css-17j7fe1 > li.css-1bo3wsb > button.css-19wyrnd |
open Wirecutter nav > ul.css-17j7fe1 > li.css-1bo3wsb > button.css-19wyrnd |
open The Athletic nav > ul.css-17j7fe1 > li.css-1bo3wsb > button.css-19wyrnd |
These items highlight common accessibility best practices.
Deprecated APIs will eventually be removed from the browser. Learn more about deprecated APIs.
Performance issues directly impact user engagement and conversion rates.
| Deprecation / Warning | Source |
|---|---|
| Unload event listeners are deprecated and will be removed. |
Errors logged to the console indicate unresolved problems. They can come from network request failures and other browser concerns. Learn more about this errors in console diagnostic audit
Performance issues directly impact user engagement and conversion rates.
| Source | Description |
|---|---|
[GSI_LOGGER]: FedCM get() rejects with NetworkError: Error retrieving a token. | |
Not signed in with the identity provider. |
Source maps translate minified code to the original source code. This helps developers debug in production. In addition, Lighthouse is able to provide further insights. Consider deploying source maps to take advantage of these benefits. Learn more about source maps.
Performance issues directly impact user engagement and conversion rates.
These checks ensure that your page is following basic search engine optimization advice. There are many additional factors Lighthouse does not score here that may affect your search ranking, including performance on Core Web Vitals. Learn more about Google Search Essentials.
Descriptive link text helps search engines understand your content. Learn how to make links more accessible.
Performance issues directly impact user engagement and conversion rates.
| Link destination | Link Text |
|---|---|
| www.nytimes.com/2026/04/14/us/politics/trump-iran-blockade-china.html | Read more |
Informative elements should aim for short, descriptive alternate text. Decorative elements can be ignored with an empty alt attribute. Learn more about the `alt` attribute.
Performance issues directly impact user engagement and conversion rates.
| Failing Elements |
|---|
img._poster_13tnt_20 img._poster_13tnt_20 |
Format your HTML in a way that enables crawlers to better understand your app’s content.
Send Feedback