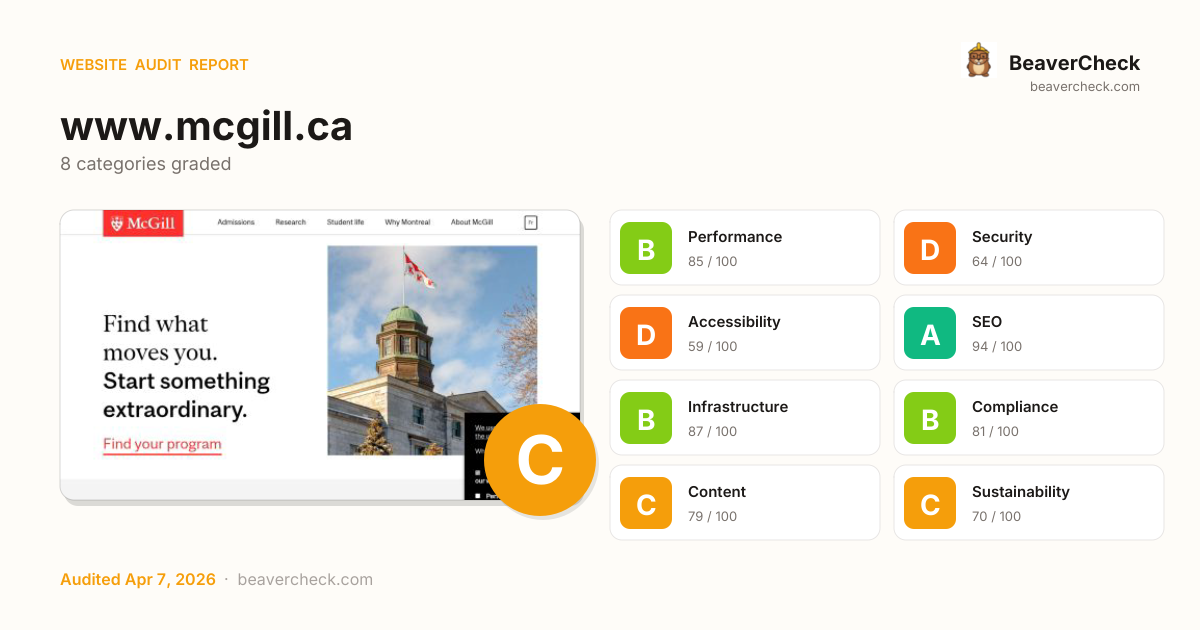
Mobile 375 × 812

Desktop 1440 × 900

Score: 76 / 100
Based on 8 categories, 0 sections
The overall score is a weighted average of individual category scores. Categories with more impact on user experience and security carry more weight.
Weights reflect general web best practices. Individual needs may differ.
'unsafe-eval' found in script source
'unsafe-inline' found in script source
Cookie 'TS010e0f58' is missing the Secure flag
1 control(s) without accessible label
3 button(s) with no accessible text
[](https://beavercheck.com/results/0eecd466-fd80-876a-1223-20dd9b9dd81d)<a href="https://beavercheck.com/results/0eecd466-fd80-876a-1223-20dd9b9dd81d"><img src="https://beavercheck.com/badge?url=https%3A%2F%2Fwww.mcgill.ca" alt="BeaverCheck Score"></a>https://beavercheck.com/badge?url=https%3A%2F%2Fwww.mcgill.caThis badge auto-updates with your latest scan result.
Thanks for your feedback!
Industry-standard audits powered by Google Lighthouse.
Key metrics that affect user experience.
First Contentful Paint First Contentful Paint — how long until the browser renders the first piece of content. Under 1.8s is good.
11.45 s
Largest Contentful Paint Largest Contentful Paint — how long until the largest visible element loads. Under 2.5s is good.
20.08 s
Total Blocking Time Total Blocking Time — total time the main thread was blocked, preventing user input. Under 200ms is good.
22 ms
Cumulative Layout Shift Cumulative Layout Shift — measures visual stability. How much the page layout shifts during loading. Under 0.1 is good.
0.203
Speed Index Speed Index — how quickly content is visually displayed during load. Under 3.4s is good.
11.45 s
Time to Interactive Time to Interactive — how long until the page is fully interactive and responds to user input. Under 3.8s is good.
20.08 s
Audit breakdown by category with detailed findings.
Remove large, duplicate JavaScript modules from bundles to reduce unnecessary bytes consumed by network activity.
Polyfills and transforms enable older browsers to use new JavaScript features. However, many aren't necessary for modern browsers. Consider modifying your JavaScript build process to not transpile Baseline features, unless you know you must support older browsers. Learn why most sites can deploy ES6+ code without transpiling
3rd party code can significantly impact load performance. Reduce and defer loading of 3rd party code to prioritize your page's content.
A long cache lifetime can speed up repeat visits to your page. Learn more about caching.
Layout shifts occur when elements move absent any user interaction. Investigate the causes of layout shifts, such as elements being added, removed, or their fonts changing as the page loads.
Consider setting font-display to swap or optional to ensure text is consistently visible. swap can be further optimized to mitigate layout shifts with font metric overrides.
Reducing the download time of images can improve the perceived load time of the page and LCP. Learn more about optimizing image size
| URL | Resource Size | Est Savings | |
|---|---|---|---|
A woman and a man smiling div.field > div.field-items > div.field-item > img.no-float | /root/styles/wms-focal-md__600x600_/public/article-thumb-... | 362.9 KiB | 357.5 KiB |
Person smiling at camera div.field > div.field-items > div.field-item > img.no-float | /root/styles/wms-focal-md__600x600_/public/article-thumb-... | 298.8 KiB | 293.4 KiB |
Two people wearing sunglasses and tuques smiling at the camera div.field > div.field-items > div.field-item > img.no-float | /root/styles/wms-focal-md__600x600_/public/article-thumb-... | 317.3 KiB | 289.6 KiB |
Arts Building Cupola on McGill campus. div.field-items > div.field-item > p > img.media-element | www.mcgill.ca/root/hp-branding-region-feb2026.jpg | 134.8 KiB | 111.9 KiB |
Each subpart has specific improvement strategies. Ideally, most of the LCP time should be spent on loading the resources, not within delays.
Optimize LCP by making the LCP image discoverable from the HTML immediately, and avoiding lazy-loading
HTTP/2 and HTTP/3 offer many benefits over HTTP/1.1, such as multiplexing. Learn more about using modern HTTP.
Avoid chaining critical requests by reducing the length of chains, reducing the download size of resources, or deferring the download of unnecessary resources to improve page load.
Requests are blocking the page's initial render, which may delay LCP. Deferring or inlining can move these network requests out of the critical path.
| URL | Transfer Size | Duration |
|---|---|---|
| www.mcgill.ca/root/css/css_Bn4VZCSfwKVWH9WNeCdIiPE3w4Jj12aatoF8FAKh6s4.css | 357.6 KiB | 7.0 s |
| www.mcgill.ca/root/css/css_looQZWPtU0KMpC8YUe3IHSZC3kjAKRYs_9c6_Oc8Das.css | 14.6 KiB | 1.0 s |
| www.mcgill.ca/root/css/css_xE-rWrJf-fncB6ztZfd2huxqgxu4WO-qwma6Xer30m4.css | 8.2 KiB | 261 ms |
| www.mcgill.ca/root/css/css_mOjEzhnZs70DEg5v8YulEWPgPuML4lqo4FjybA8itz0.css | 11.2 KiB | 1.0 s |
These insights are also available in the Chrome DevTools Performance Panel - record a trace to view more detailed information.
These are the largest layout shifts observed on the page. Each table item represents a single layout shift, and shows the element that shifted the most. Below each item are possible root causes that led to the layout shift. Some of these layout shifts may not be included in the CLS metric value due to windowing. Learn how to improve CLS
| Element | Layout shift score |
|---|---|
Arts Building Cupola on McGill campus. div.field-item > div.entity > div.content > div.field | 0.203 |
A woman and a man smiling div.field > div.field-items > div.field-item > img.no-float | 0.000 |
| 0.000 |
Time to Interactive is the amount of time it takes for the page to become fully interactive. Learn more about the Time to Interactive metric.
Minifying JavaScript files can reduce payload sizes and script parse time. Learn how to minify JavaScript.
| URL | Transfer Size | Est Savings |
|---|---|---|
| www.mcgill.ca/root/js/js_G8UCeLS2V3_kmKnBUDyyePWz6JTaxtx9x2_FgJzC_Cs.js | 124.0 KiB | 28.2 KiB |
| www.mcgill.ca/root/js/js_UnUAFCNTGurRKyhNy7N72Mv86IdtFGAwSpI4omffLWM.js | 28.3 KiB | 9.6 KiB |
| www.mcgill.ca/root/js/js_N23fS6ooC-uvOJ2j7mtuBbVQeGAvoXnACb9oAiqrOPE.js | 8.2 KiB | 3.2 KiB |
| www.mcgill.ca/root/js/js_RulCPHj8aUtatsXPqRSFtJIhBjBSAzFXZzADEVD4CHY.js | 3.8 KiB | 2.1 KiB |
| www.mcgill.ca/root/js/js_SvFAI8iewe7Ipse2GW7N9TMIrfgiVPH7c090khnScTY.js | 12.0 KiB | 2.0 KiB |
Reduce unused rules from stylesheets and defer CSS not used for above-the-fold content to decrease bytes consumed by network activity. Learn how to reduce unused CSS.
| URL | Transfer Size | Est Savings |
|---|---|---|
| www.mcgill.ca/root/css/css_Bn4VZCSfwKVWH9WNeCdIiPE3w4Jj12aatoF8FAKh6s4.css | 356.8 KiB | 336.5 KiB |
| www.mcgill.ca/root/css/css_looQZWPtU0KMpC8YUe3IHSZC3kjAKRYs_9c6_Oc8Das.css | 13.7 KiB | 12.7 KiB |
| www.mcgill.ca/root/css/css_mOjEzhnZs70DEg5v8YulEWPgPuML4lqo4FjybA8itz0.css | 10.4 KiB | 10.4 KiB |
Reduce unused JavaScript and defer loading scripts until they are required to decrease bytes consumed by network activity. Learn how to reduce unused JavaScript.
| URL | Transfer Size | Est Savings |
|---|---|---|
| www.mcgill.ca/root/js/js_G8UCeLS2V3_kmKnBUDyyePWz6JTaxtx9x2_FgJzC_Cs.js | 124.0 KiB | 42.8 KiB |
| www.mcgill.ca/sites/all/themes/coltrane19/dist/videoModalComponent.6edef453.js | 35.5 KiB | 25.0 KiB |
| www.mcgill.ca/root/js/js_NLLXow_P0hT3RGJwt-tDxP0HFx4QVqYa_W5YKdBxYuQ.js | 41.4 KiB | 23.9 KiB |
| www.mcgill.ca/root/js/js_UnUAFCNTGurRKyhNy7N72Mv86IdtFGAwSpI4omffLWM.js | 28.3 KiB | 22.9 KiB |
Large network payloads cost users real money and are highly correlated with long load times. Learn how to reduce payload sizes.
More information about the performance of your application. These numbers don't directly affect the Performance score.
These checks highlight opportunities to improve the accessibility of your web app. Automatic detection can only detect a subset of issues and does not guarantee the accessibility of your web app, so manual testing is also encouraged.
When a button doesn't have an accessible name, screen readers announce it as "button", making it unusable for users who rely on screen readers. Learn how to make buttons more accessible.
| Failing Elements |
|---|
div#page > div#header > div.section > button.js-menu-toggle div#page > div#header > div.section > button.js-menu-toggle |
These are opportunities to improve the semantics of the controls in your application. This may enhance the experience for users of assistive technology, like a screen reader.
Properly ordered headings that do not skip levels convey the semantic structure of the page, making it easier to navigate and understand when using assistive technologies. Learn more about heading order.
| Failing Elements |
|---|
In an emergency div.field-item > ul > li > h4 |
These are opportunities to improve keyboard navigation in your application.
If a page doesn't specify a `lang` attribute, a screen reader assumes that the page is in the default language that the user chose when setting up the screen reader. If the page isn't actually in the default language, then the screen reader might not announce the page's text correctly. Learn more about the `lang` attribute.
| Failing Elements |
|---|
html.js html.js |
These are opportunities to improve the interpretation of your content by users in different locales.
Screen readers require list items (`<li>`) to be contained within a parent `<ul>`, `<ol>` or `<menu>` to be announced properly. Learn more about proper list structure.
| Failing Elements |
|---|
Admissions div#block-menu-menu-global-menu > div.content > ul.menu > li.first |
Research div#block-menu-menu-global-menu > div.content > ul.menu > li.expanded |
Student life div#block-menu-menu-global-menu > div.content > ul.menu > li.expanded |
Why Montreal div#block-menu-menu-global-menu > div.content > ul.menu > li.expanded |
About McGill div#block-menu-menu-global-menu > div.content > ul.menu > li.last |
These are opportunities to improve the experience of reading tabular or list data using assistive technology, like a screen reader.
One main landmark helps screen reader users navigate a web page. Learn more about landmarks.
| Failing Elements |
|---|
html.js html.js |
These items highlight common accessibility best practices.
Errors logged to the console indicate unresolved problems. They can come from network request failures and other browser concerns. Learn more about this errors in console diagnostic audit
| Source | Description |
|---|---|
The source list for the Content Security Policy directive 'frame-src' contains an invalid source: 'ms-appx-web://'. It will be ignored. | |
www.mcgill.ca/root/js/js_G8UCeLS2V3_kmKnBUDyyePWz6JTaxtx9x2_FgJzC_Cs.js line 1, col 48672 | The source list for the Content Security Policy directive 'frame-src' contains an invalid source: 'ms-appx-web://'. It will be ignored. |
These checks ensure that your page is following basic search engine optimization advice. There are many additional factors Lighthouse does not score here that may affect your search ranking, including performance on Core Web Vitals. Learn more about Google Search Essentials.
Meta descriptions may be included in search results to concisely summarize page content. Learn more about the meta description.
Format your HTML in a way that enables crawlers to better understand your app’s content.
Search engines may use `href` attributes on links to crawl websites. Ensure that the `href` attribute of anchor elements links to an appropriate destination, so more pages of the site can be discovered. Learn how to make links crawlable
| Uncrawlable Link |
|---|
For current students div.content > ul.menu > li.first > a.nolink |
For faculty & staff div.content > ul.menu > li.expanded > a.nolink |
For alumni & friends div.content > ul.menu > li.last > a.nolink |
To appear in search results, crawlers need access to your app.
Industry-standard audits powered by Google Lighthouse. — Desktop
Key metrics that affect user experience. — Desktop
First Contentful Paint First Contentful Paint — how long until the browser renders the first piece of content. Under 1.8s is good.
2.33 s
Largest Contentful Paint Largest Contentful Paint — how long until the largest visible element loads. Under 2.5s is good.
4.07 s
Total Blocking Time Total Blocking Time — total time the main thread was blocked, preventing user input. Under 200ms is good.
0 ms
Cumulative Layout Shift Cumulative Layout Shift — measures visual stability. How much the page layout shifts during loading. Under 0.1 is good.
0.256
Speed Index Speed Index — how quickly content is visually displayed during load. Under 3.4s is good.
2.33 s
Time to Interactive Time to Interactive — how long until the page is fully interactive and responds to user input. Under 3.8s is good.
4.07 s
Audit breakdown by category with detailed findings.
Remove large, duplicate JavaScript modules from bundles to reduce unnecessary bytes consumed by network activity.
Polyfills and transforms enable older browsers to use new JavaScript features. However, many aren't necessary for modern browsers. Consider modifying your JavaScript build process to not transpile Baseline features, unless you know you must support older browsers. Learn why most sites can deploy ES6+ code without transpiling
3rd party code can significantly impact load performance. Reduce and defer loading of 3rd party code to prioritize your page's content.
A long cache lifetime can speed up repeat visits to your page. Learn more about caching.
Layout shifts occur when elements move absent any user interaction. Investigate the causes of layout shifts, such as elements being added, removed, or their fonts changing as the page loads.
Consider setting font-display to swap or optional to ensure text is consistently visible. swap can be further optimized to mitigate layout shifts with font metric overrides.
A forced reflow occurs when JavaScript queries geometric properties (such as offsetWidth) after styles have been invalidated by a change to the DOM state. This can result in poor performance. Learn more about forced reflows and possible mitigations.
Reducing the download time of images can improve the perceived load time of the page and LCP. Learn more about optimizing image size
| URL | Resource Size | Est Savings | |
|---|---|---|---|
A woman and a man smiling div.field > div.field-items > div.field-item > img.no-float | /root/styles/wms-focal-md__600x600_/public/article-thumb-... | 362.9 KiB | 342.5 KiB |
Two people wearing sunglasses and tuques smiling at the camera div.field > div.field-items > div.field-item > img.no-float | /root/styles/wms-focal-md__600x600_/public/article-thumb-... | 317.3 KiB | 296.8 KiB |
Person smiling at camera div.field > div.field-items > div.field-item > img.no-float | /root/styles/wms-focal-md__600x600_/public/article-thumb-... | 298.8 KiB | 278.3 KiB |
Arts Building Cupola on McGill campus. div.field-items > div.field-item > p > img.media-element | www.mcgill.ca/root/hp-branding-region-feb2026.jpg | 134.8 KiB | 95.0 KiB |
HTTP/2 and HTTP/3 offer many benefits over HTTP/1.1, such as multiplexing. Learn more about using modern HTTP.
Avoid chaining critical requests by reducing the length of chains, reducing the download size of resources, or deferring the download of unnecessary resources to improve page load.
Requests are blocking the page's initial render, which may delay LCP. Deferring or inlining can move these network requests out of the critical path.
| URL | Transfer Size | Duration |
|---|---|---|
| www.mcgill.ca/root/css/css_Bn4VZCSfwKVWH9WNeCdIiPE3w4Jj12aatoF8FAKh6s4.css | 357.6 KiB | 1.5 s |
| www.mcgill.ca/root/css/css_looQZWPtU0KMpC8YUe3IHSZC3kjAKRYs_9c6_Oc8Das.css | 14.6 KiB | 562 ms |
| www.mcgill.ca/root/css/css_mOjEzhnZs70DEg5v8YulEWPgPuML4lqo4FjybA8itz0.css | 11.2 KiB | 423 ms |
| www.mcgill.ca/root/css/css_xE-rWrJf-fncB6ztZfd2huxqgxu4WO-qwma6Xer30m4.css | 8.2 KiB | 146 ms |
These insights are also available in the Chrome DevTools Performance Panel - record a trace to view more detailed information.
These are the largest layout shifts observed on the page. Each table item represents a single layout shift, and shows the element that shifted the most. Below each item are possible root causes that led to the layout shift. Some of these layout shifts may not be included in the CLS metric value due to windowing. Learn how to improve CLS
| Element | Layout shift score |
|---|---|
Enter your keywords div.content > div#node-24 > div.content > div#search-feature-container | 0.196 |
Video of Anthem video ENG NS div#file-83 > div.content > div.media-youtube-video > iframe#media-youtube-cuumf7hp3pu | 0.025 |
Two people wearing sunglasses and tuques smiling at the camera div.field > div.field-items > div.field-item > img.no-float | 0.019 |
We use cookies to help improve the usability of our websites.
What are you com… body.html > div#sliding-popup | 0.001 |
We use cookies to help improve the usability of our websites.
What are you com… body.html > div#sliding-popup | 0.001 |
We use cookies to help improve the usability of our websites.
What are you com… body.html > div#sliding-popup | 0.001 |
We use cookies to help improve the usability of our websites.
What are you com… body.html > div#sliding-popup | 0.001 |
We use cookies to help improve the usability of our websites.
What are you com… body.html > div#sliding-popup | 0.000 |
We use cookies to help improve the usability of our websites.
What are you com… body.html > div#sliding-popup | 0.000 |
We use cookies to help improve the usability of our websites.
What are you com… body.html > div#sliding-popup | 0.000 |
We use cookies to help improve the usability of our websites.
What are you com… body.html > div#sliding-popup | 0.000 |
We use cookies to help improve the usability of our websites.
What are you com… body.html > div#sliding-popup | 0.000 |
We use cookies to help improve the usability of our websites.
What are you com… body.html > div#sliding-popup | 0.000 |
We use cookies to help improve the usability of our websites.
What are you com… body.html > div#sliding-popup | 0.000 |
We use cookies to help improve the usability of our websites.
What are you com… body.html > div#sliding-popup | 0.000 |
Time to Interactive is the amount of time it takes for the page to become fully interactive. Learn more about the Time to Interactive metric.
Reduce unused rules from stylesheets and defer CSS not used for above-the-fold content to decrease bytes consumed by network activity. Learn how to reduce unused CSS.
| URL | Transfer Size | Est Savings |
|---|---|---|
| www.mcgill.ca/root/css/css_Bn4VZCSfwKVWH9WNeCdIiPE3w4Jj12aatoF8FAKh6s4.css | 356.8 KiB | 332.0 KiB |
| www.mcgill.ca/root/css/css_looQZWPtU0KMpC8YUe3IHSZC3kjAKRYs_9c6_Oc8Das.css | 13.7 KiB | 12.9 KiB |
| www.mcgill.ca/root/css/css_mOjEzhnZs70DEg5v8YulEWPgPuML4lqo4FjybA8itz0.css | 10.4 KiB | 10.4 KiB |
Reduce unused JavaScript and defer loading scripts until they are required to decrease bytes consumed by network activity. Learn how to reduce unused JavaScript.
| URL | Transfer Size | Est Savings |
|---|---|---|
| www.mcgill.ca/root/js/js_G8UCeLS2V3_kmKnBUDyyePWz6JTaxtx9x2_FgJzC_Cs.js | 124.0 KiB | 44.1 KiB |
| www.mcgill.ca/sites/all/themes/coltrane19/dist/videoModalComponent.6edef453.js | 35.5 KiB | 25.0 KiB |
| www.mcgill.ca/root/js/js_UnUAFCNTGurRKyhNy7N72Mv86IdtFGAwSpI4omffLWM.js | 28.3 KiB | 24.0 KiB |
| www.mcgill.ca/root/js/js_NLLXow_P0hT3RGJwt-tDxP0HFx4QVqYa_W5YKdBxYuQ.js | 41.4 KiB | 23.9 KiB |
Minifying JavaScript files can reduce payload sizes and script parse time. Learn how to minify JavaScript.
| URL | Transfer Size | Est Savings |
|---|---|---|
| www.mcgill.ca/root/js/js_G8UCeLS2V3_kmKnBUDyyePWz6JTaxtx9x2_FgJzC_Cs.js | 124.0 KiB | 28.2 KiB |
| www.mcgill.ca/root/js/js_UnUAFCNTGurRKyhNy7N72Mv86IdtFGAwSpI4omffLWM.js | 28.3 KiB | 9.6 KiB |
| www.mcgill.ca/root/js/js_N23fS6ooC-uvOJ2j7mtuBbVQeGAvoXnACb9oAiqrOPE.js | 8.2 KiB | 3.2 KiB |
| www.mcgill.ca/root/js/js_RulCPHj8aUtatsXPqRSFtJIhBjBSAzFXZzADEVD4CHY.js | 3.8 KiB | 2.1 KiB |
| www.mcgill.ca/root/js/js_SvFAI8iewe7Ipse2GW7N9TMIrfgiVPH7c090khnScTY.js | 12.0 KiB | 2.0 KiB |
Large network payloads cost users real money and are highly correlated with long load times. Learn how to reduce payload sizes.
More information about the performance of your application. These numbers don't directly affect the Performance score.
These checks highlight opportunities to improve the accessibility of your web app. Automatic detection can only detect a subset of issues and does not guarantee the accessibility of your web app, so manual testing is also encouraged.
Properly ordered headings that do not skip levels convey the semantic structure of the page, making it easier to navigate and understand when using assistive technologies. Learn more about heading order.
| Failing Elements |
|---|
In an emergency div.field-item > ul > li > h4 |
These are opportunities to improve keyboard navigation in your application.
If a page doesn't specify a `lang` attribute, a screen reader assumes that the page is in the default language that the user chose when setting up the screen reader. If the page isn't actually in the default language, then the screen reader might not announce the page's text correctly. Learn more about the `lang` attribute.
| Failing Elements |
|---|
html.js html.js |
These are opportunities to improve the interpretation of your content by users in different locales.
Screen readers require list items (`<li>`) to be contained within a parent `<ul>`, `<ol>` or `<menu>` to be announced properly. Learn more about proper list structure.
| Failing Elements |
|---|
Admissions div#block-menu-menu-global-menu > div.content > ul.menu > li.first |
Research div#block-menu-menu-global-menu > div.content > ul.menu > li.expanded |
Student life div#block-menu-menu-global-menu > div.content > ul.menu > li.expanded |
Why Montreal div#block-menu-menu-global-menu > div.content > ul.menu > li.expanded |
About McGill div#block-menu-menu-global-menu > div.content > ul.menu > li.last |
These are opportunities to improve the experience of reading tabular or list data using assistive technology, like a screen reader.
One main landmark helps screen reader users navigate a web page. Learn more about landmarks.
| Failing Elements |
|---|
html.js html.js |
These items highlight common accessibility best practices.
Errors logged to the console indicate unresolved problems. They can come from network request failures and other browser concerns. Learn more about this errors in console diagnostic audit
| Source | Description |
|---|---|
The source list for the Content Security Policy directive 'frame-src' contains an invalid source: 'ms-appx-web://'. It will be ignored. | |
www.mcgill.ca/root/js/js_G8UCeLS2V3_kmKnBUDyyePWz6JTaxtx9x2_FgJzC_Cs.js line 1, col 48672 | The source list for the Content Security Policy directive 'frame-src' contains an invalid source: 'ms-appx-web://'. It will be ignored. |
These checks ensure that your page is following basic search engine optimization advice. There are many additional factors Lighthouse does not score here that may affect your search ranking, including performance on Core Web Vitals. Learn more about Google Search Essentials.
Meta descriptions may be included in search results to concisely summarize page content. Learn more about the meta description.
Format your HTML in a way that enables crawlers to better understand your app’s content.
Send Feedback