Audit overview
4 categories need attention: Performance, and 3 others.
Fix Priority Matrix
5 findingsQuick Wins
3High impact, low effort — start here.
Strategic
2High impact, requires investment.
Easy Improvements
0Small gains, minimal effort.
Nothing in this quadrant — good news.
Deprioritize
0Low impact, high effort — do last.
Nothing in this quadrant — good news.
Screenshots


Top Priorities (5)
Content-Security-Policy header is missing
Without a CSP, a single XSS bug can exfiltrate everything your users type — including credentials.
HSTS header is missing
Without HSTS, a network attacker can downgrade the very first connection to HTTP and steal the user's session.
No Content-Security-Policy header found
Without a CSP, a single XSS bug can exfiltrate everything users type — credentials, payment data, session tokens.
Page weighs 39.4 MB (20.4 MB transferred)
Informational: total page weight (uncompressed) and bytes actually transferred over the wire.
1 button(s) with no accessible text
Buttons with no accessible text (icon-only, no aria-label) can't be activated by voice control or understood by screen readers.
Business case
What fixing the audit's findings is worth -- and what ignoring them keeps costing.
Return on investment
$675 investment → $2,988/month returns + USD 157,500 risk avoided
Figures combine localized regulatory fine ceilings, search/conversion value priced against local CPC, and bandwidth waste estimates. Results depend on implementation quality and audience composition. Not legal or financial advice.
Conversion barriers
6 barrier(s) likely increasing bounce by ~26%.
- Page takes 20.4s to loadUsers abandon at ~3s — you're 17.9s over the 2.5s threshold→ Optimize render-blocking resources, preload the hero image, and compress images
- Page feels frozen for 14.2sClicks on the primary CTA are ignored while JavaScript runs→ Break up long tasks; defer non-critical JavaScript to post-hydration
- No HSTS headerReturning visitors are briefly exposed to downgrade attacks on first request→ Set Strict-Transport-Security: max-age=31536000; includeSubDomains
- No Content-Security-Policy headerHigher XSS blast radius — one compromised script can exfiltrate the checkout form→ Ship a reporting-only CSP first, then enforce once violations are clean
- No skip-to-content linkKeyboard and screen-reader users must tab through the entire header on every page→ Add a visible-on-focus <a href="#main">Skip to content</a> as the first focusable element
Preliminary CRO audit — each barrier links to the tab with detailed analysis.
Remediation cost
Start here for the best return on investment
Cost by category
Cost by effort level
Adjust assumptions
Team composition
Multiplier applied to dev hours to reflect QA, design, and PM overhead. Use Dev only for solo work; Full team for projects with formal review processes.
Rates reflect fully-loaded developer cost including overhead
Warning:Cost of inaction
Compliance Risk
$157,500
- No privacy policy link detectedCCPA/CPRA: USD 2,500 – USD 7,500
- 3 advertising/retargeting trackers detectedCCPA/CPRA: USD 2,500 – USD 7,500
- Trackers detected but no cookie policy foundCCPA/CPRA: USD 2,500 – USD 7,500
Bounce-Rate Cost
$2,983 /mo
+25.7pp bounce · ~2,572 lost visitors/mo
CPC: USD 1.16
Bandwidth Waste
$5.13 /mo
64134.5 MB/mo × 0.080 USD/GB
- Optimize transfer: save ~6.4 MB per page loadSaves $5.13/mo
Compliance figures represent the statutory maximum fine for the most severe triggered category, capped per regulation — not the sum of per-finding penalties. Based on published regulatory fine ranges. This is not legal advice.
Unique monthly visitors from your analytics
Purchases, signups, or key actions
Optional — for revenue estimation
more engaged visitors from reduced bounce
Fix 5 critical issues to capture this value
How this is calculated
Based on Google/Deloitte research ("Milliseconds Make Millions") showing a ~7% bounce rate increase per additional second of LCP above the 2.5s "Good" threshold.
Your site's LCP: → estimated after fixes.
These are estimates based on industry research — actual results vary
Your data stays in your browser — nothing is sent to our servers
Lighthouse
Mobile
First Contentful Paint First Contentful Paint — how long until the browser renders the first piece of content. Under 1.8s is good.
4.47 s
Largest Contentful Paint Largest Contentful Paint — how long until the largest visible element loads. Under 2.5s is good.
20.40 s
Total Blocking Time Total Blocking Time — total time the main thread was blocked, preventing user input. Under 200ms is good.
14.17 s
Cumulative Layout Shift Cumulative Layout Shift — measures visual stability. How much the page layout shifts during loading. Under 0.1 is good.
0.000
Speed Index Speed Index — how quickly content is visually displayed during load. Under 3.4s is good.
29.29 s
Time to Interactive Time to Interactive — how long until the page is fully interactive and responds to user input. Under 3.8s is good.
89.40 s
Desktop
First Contentful Paint First Contentful Paint — how long until the browser renders the first piece of content. Under 1.8s is good.
1.10 s
Largest Contentful Paint Largest Contentful Paint — how long until the largest visible element loads. Under 2.5s is good.
1.45 s
Total Blocking Time Total Blocking Time — total time the main thread was blocked, preventing user input. Under 200ms is good.
776 ms
Cumulative Layout Shift Cumulative Layout Shift — measures visual stability. How much the page layout shifts during loading. Under 0.1 is good.
0.021
Speed Index Speed Index — how quickly content is visually displayed during load. Under 3.4s is good.
7.01 s
Time to Interactive Time to Interactive — how long until the page is fully interactive and responds to user input. Under 3.8s is good.
20.01 s
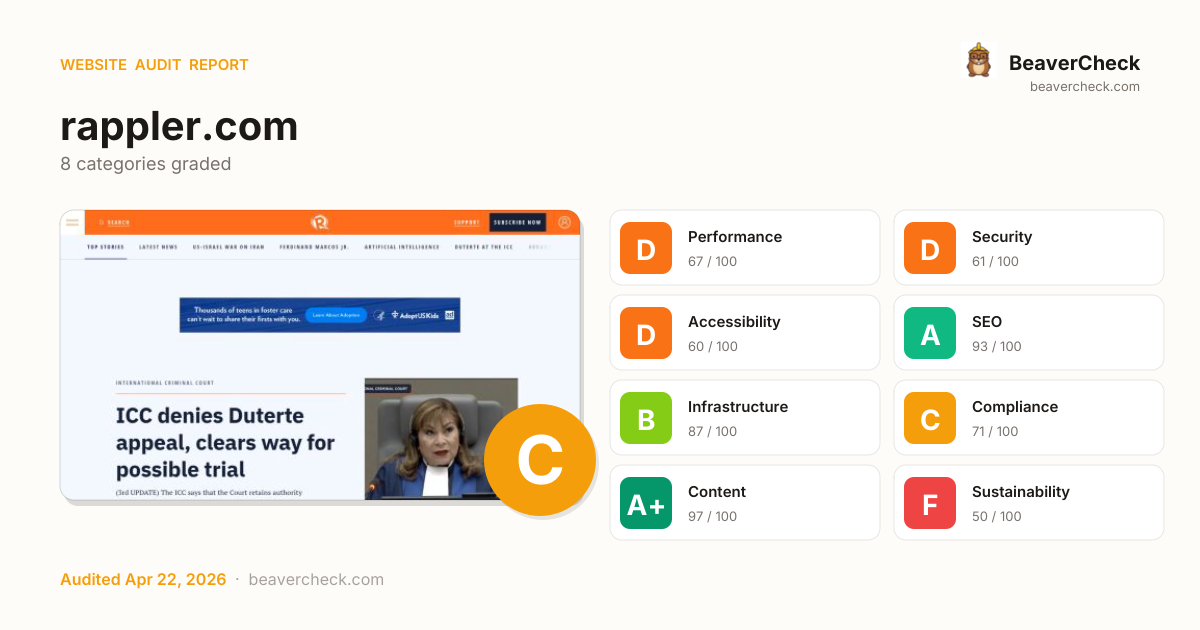
Categories
8Performance
Page weighs 39.4 MB (20.4 MB transferred)
Security
Content-Security-Policy header is missing
Accessibility
1 button(s) with no accessible text
SEO
All checks pass
Infrastructure
All checks pass
Compliance
All checks pass
Content
All checks pass
Sustainability
All checks pass
How you compare
Where this site stands against peers running the same stack.
Top 10% of Cart Functionality sites score 86+ on Sustainability; you're at 50 — closing this gap is the highest-leverage improvement.
Top 10% of WordPress sites score 91+ on Sustainability; you're at 50 — closing this gap is the highest-leverage improvement.
Technology stack
WordPress, on PHP, hosted on AWS, with AWS CloudFront CDN
Stack Architecture
 Bidmatic 1.3.4
 Contentsquare
  Criteo
  Cxense
  Google Analytics
  Google Tag Manager
  Hotjar
  Quantcast Measure
  Taboola
  Yoast SEO
  Cart Functionality
  WordPress
  Piano
Piano  Conversant Consent Tool
  DataTables 2.1.7
 Funding Choices
  Glide.js Google Search Console Google Workspace
  HTTP/3
  Moment.js 2.30.1
 MySQL
MySQL  Open Graph
  Popper
  Priority Hints
  RSS
RSS  React 18.3.1
 Survicate
  Tippy.js
  Webpack
  core-js 3.35.1
 jQuery 3.7.1 jQuery Migrate 3.4.1
 web-vitals 3.1.1
 PHP
PHP  AWS CloudFront Amazon CloudFront
  Nginx jsDelivr CDN unpkg
  AWS Amazon Web Services
 All Detected Technologies (43)
Amazon CloudFront is a fast content delivery network (CDN) service that securely delivers data, videos, applications, and APIs to customers globally with low latency, high transfer speeds.
Nginx is a web server that can also be used as a reverse proxy, load balancer, mail proxy and HTTP cache.
Amazon Web Services (AWS) is a comprehensive cloud services platform offering compute power, database storage, content delivery and other functionality.
PHP is a general-purpose scripting language used for web development.
WordPress is a free and open-source content management system written in PHP and paired with a MySQL or MariaDB database. Features include a plugin architecture and a template system.
Websites that have a shopping cart or checkout page, either using a known ecommerce platform or a custom solution.
Conversant Consent Tool is a free tool to gain GDPR and ePD compliant consent for digital advertising.
DataTables is a plug-in for the jQuery Javascript library adding advanced features like pagination, instant search, themes, and more to any HTML table.
Funding Choices is a messaging tool that can help you comply with the EU General Data Protection Regulation (GDPR), and recover lost revenue from ad blocking users.
Glide.js is a dependency-free JavaScript ES6 slider and carousel.
HTTP/3 is the third major version of the Hypertext Transfer Protocol used to exchange information on the World Wide Web.
Moment.js is a free and open-source JavaScript library that removes the need to use the native JavaScript Date object directly.
MySQL is an open-source relational database management system.
Open Graph is a protocol that is used to integrate any web page into the social graph.
Popper is a positioning engine, its purpose is to calculate the position of an element to make it possible to position it near a given reference element.
Priority Hints exposes a mechanism for developers to signal a relative priority for browsers to consider when fetching resources.
RSS is a family of web feed formats used to publish frequently updated works—such as blog entries, news headlines, audio, and video—in a standardized format.
React is an open-source JavaScript library for building user interfaces or UI components.
Survicate is an all-in-one customer feedback tool that allows you collect feedback.
Tippy.js is the complete tooltip, popover, dropdown, and menu solution for the web, powered by Popper.
Webpack is an open-source JavaScript module bundler.
core-js is a modular standard library for JavaScript, with polyfills for cutting-edge ECMAScript features.
jQuery is a JavaScript library which is a free, open-source software designed to simplify HTML DOM tree traversal and manipulation, as well as event handling, CSS animation, and Ajax.
Query Migrate is a javascript library that allows you to preserve the compatibility of your jQuery code developed for versions of jQuery older than 1.9.
The web-vitals JavaScript is a tiny, modular library for measuring all the web vitals metrics on real users.
Bidmatic is a platform providing publisher-centric monetisation solutions, enabling publishers to manage their ad stack and maximise revenue through high-quality demand sources and advanced optimisation technology.
Contentsquare is an enterprise-level UX optimisation platform.
Criteo provides personalised retargeting that works with Internet retailers to serve personalised online display advertisements to consumers who have previously visited the advertiser's website.
Cxense was an AI-powered data management and intelligent personalisation platform.
Google Analytics is a free web analytics service that tracks and reports website traffic.
Google Tag Manager is a tag management system (TMS) that allows you to quickly and easily update measurement codes and related code fragments collectively known as tags on your website or mobile app.
Hotjar is a suite of analytic tools to assist in the gathering of qualitative data, providing feedback through tools such as heatmaps, session recordings, and surveys.
Quantcast Measure is an audience insights and analytics tool.
Taboola is a content discovery & native advertising platform for publishers and advertisers.
Yoast SEO is a search engine optimisation plugin for WordPress and other platforms.
Piano is a enterprise SaaS company which specialising in advanced media business processes and ecommerce optimisation.
Observations (3)
WordPress detected — review security configuration
WordPress sites benefit from: protecting wp-login.php, disabling XML-RPC if unused, restricting REST API access, and keeping all plugins and themes up to date. Check the Security tab for specific findings.
jQuery loaded alongside a modern framework
Both jQuery and React are loaded. Modern frameworks handle DOM manipulation natively. jQuery may be unnecessary and adds ~30KB to the page weight. Check the Performance tab for bundle analysis.
Complex technology stack detected
43 technologies identified. A complex stack increases maintenance burden and attack surface. Consider whether all components are actively needed.
Show your score
Drop this badge on your README, marketing site, or status page. It auto-updates every time the audit re-runs and links back to this report.
This badge auto-updates with your latest scan result.
[](https://beavercheck.com/sites/rappler.com)<a href="https://beavercheck.com/sites/rappler.com"><img src="https://beavercheck.com/badge?url=https%3A%2F%2Frappler.com" alt="BeaverCheck Score"></a>https://beavercheck.com/badge?url=https%3A%2F%2Frappler.comExport & share
Download the audit, share with your team, or grab a fix plan ready to copy into your tracker.
Copies markdown to clipboard
Fix Plan
Three-week roadmap to ship the audit's findings, with one-click copy targets for your tracker.
Three-week fix plan
2 sprints · 7h total → projected B (81)
Sprint 1: Quick Wins
+6Highest ROI — low effort, high impact
- · Page weighs 39.4 MB (20.4 MB transferred)
- · HSTS header is missing
- · 1 button(s) with no accessible text
Sprint 2: Core Fixes
+4Medium effort, high structural impact
- · Content-Security-Policy header is missing
- · No Content-Security-Policy header found