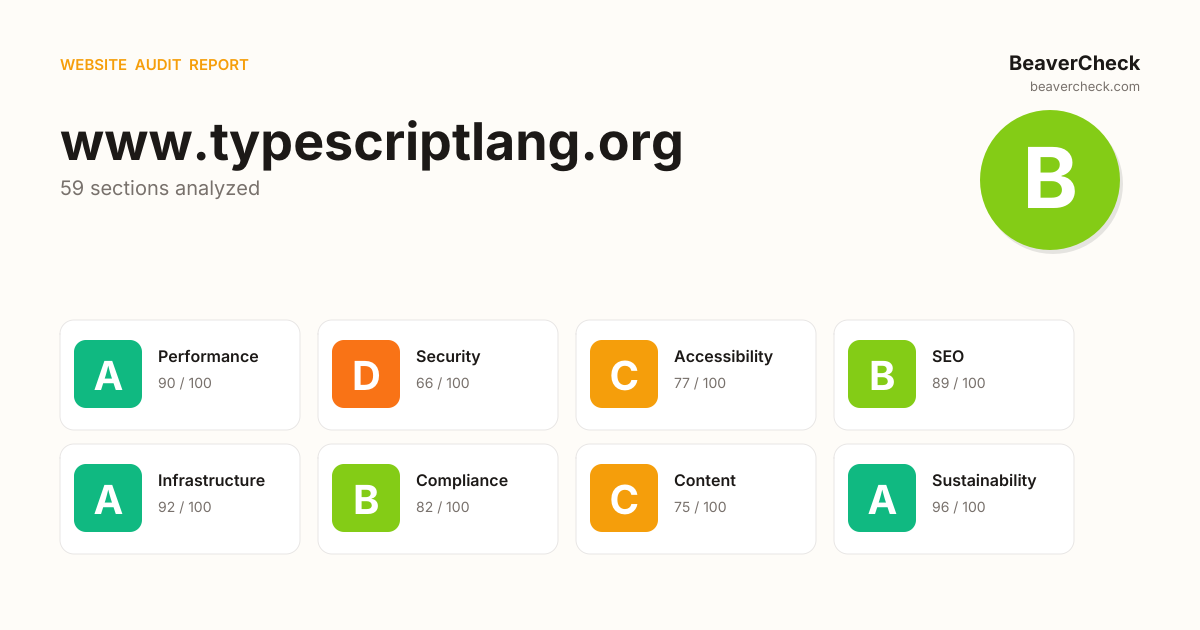
Audit overview
Security needs attention; the rest of the categories are in good shape.
Fix Priority Matrix
5 findingsQuick Wins
1High impact, low effort — start here.
Strategic
4High impact, requires investment.
Easy Improvements
0Small gains, minimal effort.
Nothing in this quadrant — good news.
Deprioritize
0Low impact, high effort — do last.
Nothing in this quadrant — good news.
Screenshots

Top Priorities (5)
Content-Security-Policy header is missing
Without a CSP, a single XSS bug can exfiltrate everything your users type — including credentials.
No Content-Security-Policy header found
Without a CSP, a single XSS bug can exfiltrate everything users type — credentials, payment data, session tokens.
1 control(s) without accessible label
Form controls without labels — assistive tech announces 'edit text' with no context; users can't complete forms.
3 button(s) with no accessible text
Buttons with no accessible text (icon-only, no aria-label) can't be activated by voice control or understood by screen readers.
Cross-Origin-Embedder-Policy header is missing
COEP enforces that all embedded resources opt-in to cross-origin embedding — required for cross-origin isolation features.
Business case
What fixing the audit's findings is worth -- and what ignoring them keeps costing.
Return on investment
$850 investment → $816/month returns + USD 157,500 risk avoided
Figures combine localized regulatory fine ceilings, search/conversion value priced against local CPC, and bandwidth waste estimates. Results depend on implementation quality and audience composition. Not legal or financial advice.
Conversion barriers
5 barrier(s) likely increasing bounce by ~13%.
- High main-thread blocking timePage is non-interactive for 202ms after first paint→ Defer third-party scripts and split large bundles
- No Content-Security-Policy headerHigher XSS blast radius — one compromised script can exfiltrate the checkout form→ Ship a reporting-only CSP first, then enforce once violations are clean
- 1 form field(s) without a labelScreen readers skip unlabeled fields; autofill can't identify them; checkout abandonment spikes→ Associate every input with a visible <label for="…">; add autocomplete attributes
- No structured dataNo rich-result eligibility in Google — lower SERP CTR vs competitors with stars and prices→ Add JSON-LD for your page type (Product, Article, FAQPage, LocalBusiness, …)
- 1 broken link(s) on the pageClicks land on 404s — trust drops and the session often ends→ Fix or remove the broken destinations surfaced on the Content tab
Preliminary CRO audit — each barrier links to the tab with detailed analysis.
Remediation cost
Start here for the best return on investment
Cost by category
Cost by effort level
Adjust assumptions
Team composition
Multiplier applied to dev hours to reflect QA, design, and PM overhead. Use Dev only for solo work; Full team for projects with formal review processes.
Rates reflect fully-loaded developer cost including overhead
Warning:Cost of inaction
Compliance Risk
$157,500
- No privacy policy link detectedCCPA/CPRA: USD 2,500 – USD 7,500
- 1 control(s) without accessible labelADA Title III: USD 25,000 – USD 150,000
Bounce-Rate Cost
$815 /mo
+12.5pp bounce · ~1,255 lost visitors/mo
CPC: USD 0.65
Bandwidth Waste
$0.14 /mo
1775.9 MB/mo × 0.080 USD/GB
- Optimize transfer: save ~178 KB per page loadSaves $0.14/mo
Compliance figures represent the statutory maximum fine for the most severe triggered category, capped per regulation — not the sum of per-finding penalties. Based on published regulatory fine ranges. This is not legal advice.
Unique monthly visitors from your analytics
Purchases, signups, or key actions
Optional — for revenue estimation
more engaged visitors from reduced bounce
Fix 4 critical issues to capture this value
How this is calculated
Based on Google/Deloitte research ("Milliseconds Make Millions") showing a ~7% bounce rate increase per additional second of LCP above the 2.5s "Good" threshold.
Your site's LCP: → estimated after fixes.
These are estimates based on industry research — actual results vary
Your data stays in your browser — nothing is sent to our servers
Lighthouse
Mobile
First Contentful Paint First Contentful Paint — how long until the browser renders the first piece of content. Under 1.8s is good.
1.20 s
Largest Contentful Paint Largest Contentful Paint — how long until the largest visible element loads. Under 2.5s is good.
1.26 s
Total Blocking Time Total Blocking Time — total time the main thread was blocked, preventing user input. Under 200ms is good.
202 ms
Cumulative Layout Shift Cumulative Layout Shift — measures visual stability. How much the page layout shifts during loading. Under 0.1 is good.
0.002
Speed Index Speed Index — how quickly content is visually displayed during load. Under 3.4s is good.
1.20 s
Time to Interactive Time to Interactive — how long until the page is fully interactive and responds to user input. Under 3.8s is good.
4.64 s
Desktop
First Contentful Paint First Contentful Paint — how long until the browser renders the first piece of content. Under 1.8s is good.
364 ms
Largest Contentful Paint Largest Contentful Paint — how long until the largest visible element loads. Under 2.5s is good.
384 ms
Total Blocking Time Total Blocking Time — total time the main thread was blocked, preventing user input. Under 200ms is good.
0 ms
Cumulative Layout Shift Cumulative Layout Shift — measures visual stability. How much the page layout shifts during loading. Under 0.1 is good.
0.018
Speed Index Speed Index — how quickly content is visually displayed during load. Under 3.4s is good.
364 ms
Time to Interactive Time to Interactive — how long until the page is fully interactive and responds to user input. Under 3.8s is good.
386 ms
Categories
8Performance
All checks pass
Security
Content-Security-Policy header is missing
Accessibility
1 control(s) without accessible label
SEO
All checks pass
Infrastructure
All checks pass
Compliance
All checks pass
Content
All checks pass
Sustainability
All checks pass
How you compare
Where this site stands against peers running the same stack.
Top 10% of core-js sites score 95+ on Content; you're at 75 — closing this gap is the highest-leverage improvement.
Technology stack
Gatsby 5.16.1, hosted on GitHub Pages, with Fastly CDN
Stack Architecture
 Gatsby 5.16.1HSTS
  Open Graph
  React
React  Varnish
  Webpack
  core-js 3.48.0
 Fastly
  GitHub Pages
 All Detected Technologies (9)
Fastly is a cloud computing services provider. Fastly's cloud platform provides a content delivery network, Internet security services, load balancing, and video & streaming services.
GitHub Pages is a static site hosting service.
Gatsby is a React-based open-source framework with performance, scalability and security built-in.
HTTP Strict Transport Security (HSTS) informs browsers that the site should only be accessed using HTTPS.
Open Graph is a protocol that is used to integrate any web page into the social graph.
React is an open-source JavaScript library for building user interfaces or UI components.
Varnish is a reverse caching proxy.
Webpack is an open-source JavaScript module bundler.
core-js is a modular standard library for JavaScript, with polyfills for cutting-edge ECMAScript features.
Observations (3)
Hosted on GitHub Pages
GitHub Pages provides free static hosting with automatic HTTPS. Limitations: no server-side code, 1GB site size limit, 100GB/month bandwidth.
No build tool detected
A framework (Gatsby) was detected but no bundler was identified. The build tool may not be detectable from output patterns, or the site may use the framework's built-in bundler.
Complex technology stack detected
9 technologies identified. A complex stack increases maintenance burden and attack surface. Consider whether all components are actively needed.
Show your score
Drop this badge on your README, marketing site, or status page. It auto-updates every time the audit re-runs and links back to this report.
This badge auto-updates with your latest scan result.
[](https://beavercheck.com/results/26c6916a-b311-411d-968d-fdc6bddb546d)<a href="https://beavercheck.com/results/26c6916a-b311-411d-968d-fdc6bddb546d"><img src="https://beavercheck.com/badge?url=https%3A%2F%2Fwww.typescriptlang.org" alt="BeaverCheck Score"></a>https://beavercheck.com/badge?url=https%3A%2F%2Fwww.typescriptlang.orgExport & share
Download the audit, share with your team, or grab a fix plan ready to copy into your tracker.
Copies markdown to clipboard
Fix Plan
Three-week roadmap to ship the audit's findings, with one-click copy targets for your tracker.
Three-week fix plan
2 sprints · 8h total → projected B (89)
Sprint 1: Quick Wins
+1Highest ROI — low effort, high impact
- · 3 button(s) with no accessible text
Sprint 2: Core Fixes
+7Medium effort, high structural impact
- · 1 control(s) without accessible label
- · Content-Security-Policy header is missing
- · No Content-Security-Policy header found
- · Cross-Origin-Embedder-Policy header is missing