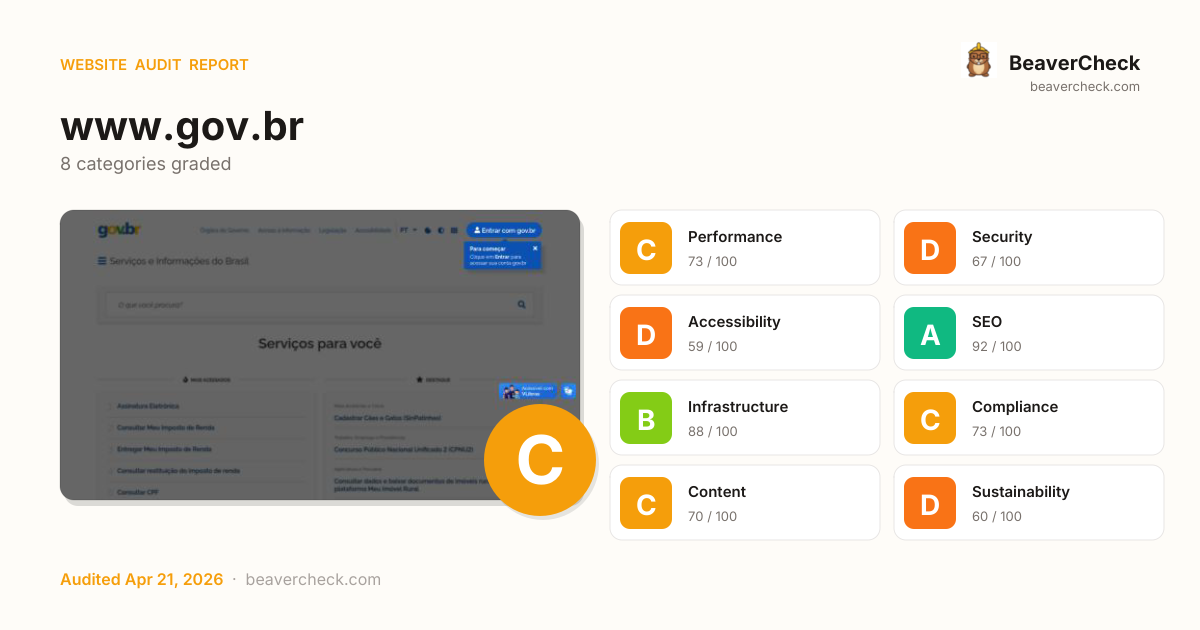
Mobile 375 × 812

Desktop 1440 × 900

Score: 72 / 100
Based on 8 categories, 0 sections
Decent speed, but optimizing further could improve engagement.
Several missing protections leave your users and data exposed.
Several issues make your site difficult for assistive technology users.
Well-optimized for search — your content is discoverable.
Solid infrastructure — fast server responses across the board.
Mostly compliant — a few items need attention.
Good content signals with minor gaps.
Heavier than average — reducing page weight saves energy and bandwidth.
The overall score is a weighted average of individual category scores. Categories with more impact on user experience and security carry more weight.
Weights reflect general web best practices. Individual needs may differ.
Cookie 'I18N_LANGUAGE' is missing the Secure flag
Security gaps expose your site and users to attacks, eroding trust.
Cookie 'TS011ec037' is missing the Secure flag
Security gaps expose your site and users to attacks, eroding trust.
Page weighs 10.9 MB (6.1 MB transferred)
Performance issues directly impact user engagement and conversion rates.
2 button(s) with no accessible text
Accessibility issues exclude users with disabilities — up to 15% of your potential audience.
6 link(s) with no accessible text
Accessibility issues exclude users with disabilities — up to 15% of your potential audience.
High impact, low effort — start here.
High impact, requires investment.
Small gains, minimal effort.
Nothing in this quadrant — good news.
Low impact, high effort — do last.
Nothing in this quadrant — good news.
[](https://beavercheck.com/results/36d379cc-44fe-4d8a-b4c8-aa7073cc2307)<a href="https://beavercheck.com/results/36d379cc-44fe-4d8a-b4c8-aa7073cc2307"><img src="https://beavercheck.com/badge?url=https%3A%2F%2Fwww.gov.br" alt="BeaverCheck Score"></a>https://beavercheck.com/badge?url=https%3A%2F%2Fwww.gov.brThis badge auto-updates with your latest scan result.
Your site performs reasonably well, but a few targeted fixes could meaningfully improve results. Your LCP of 22.3s exceeds Google's 2.5s 'Good' threshold and the 1 performance issue below directly contributes to it. Accessibility issues exclude users who rely on assistive technology — an estimated 15% of your potential audience. Addressing the critical issues below would have the most immediate impact on your user trust.
8 barrier(s) likely increasing bounce by ~33%.
Page takes 22.3s to load
+12% bounceUsers abandon at ~3s — you're 19.8s over the 2.5s threshold
Fix: Optimize render-blocking resources, preload the hero image, and compress images
High main-thread blocking time
+2% bouncePage is non-interactive for 252ms after first paint
Fix: Defer third-party scripts and split large bundles
Mixed content on HTTPS page
+8% bounceBrowsers block insecure subresources — broken images, missing scripts, warning badge
Fix: Change http:// URLs inside the page to https:// (or protocol-relative)
No Content-Security-Policy header
+1% bounceHigher XSS blast radius — one compromised script can exfiltrate the checkout form
Fix: Ship a reporting-only CSP first, then enforce once violations are clean
Layout shifts during page load
+3% bounceContent movement causes mis-clicks on CTAs and form fields
Fix: Add width/height to images; reserve space for late-loading embeds
6 link(s) with generic text ("click here", "read more")
+1% bounceScreen-reader users navigating by link list see no context — and search engines can't infer relevance
Fix: Rewrite with descriptive phrases that identify the destination
No skip-to-content link
+1% bounceKeyboard and screen-reader users must tab through the entire header on every page
Fix: Add a visible-on-focus <a href="#main">Skip to content</a> as the first focusable element
13 broken link(s) on the page
+5% bounceClicks land on 404s — trust drops and the session often ends
Fix: Fix or remove the broken destinations surfaced on the Content tab
Preliminary CRO audit — each barrier links to the tab with detailed analysis.
BRL 1,080 investment → BRL 7.91/month returns + BRL 50,000,000 risk avoided
BRL 1,080
6h · 5 findings
BRL 7.91 /mo
~BRL 95 / year
BRL 50,000,000
if kept compliant
BRL 180 — in quick wins — start here for the fastest payback
Figures combine localized regulatory fine ceilings, search/conversion value priced against local CPC, and bandwidth waste estimates. Results depend on implementation quality and audience composition. Not legal or financial advice.
6.0 developer hours at R$180/hr
Based on Brazil rates (R$180/hr)
Start here for the best return on investment
BRL 4,166,675 / month at risk
~BRL 50,000,095 / year if left unfixed
BRL 50,000,000
+1 more
BRL 7.91 /mo
19280.5 MB/mo × 0.410 BRL/GB
Compliance figures represent the statutory maximum fine for the most severe triggered category, capped per regulation — not the sum of per-finding penalties. Based on published regulatory fine ranges. This is not legal advice.
Unique monthly visitors from your analytics
Purchases, signups, or key actions
Optional — for revenue estimation
more engaged visitors from reduced bounce
Fix 5 critical issues to capture this value
Based on Google/Deloitte research ("Milliseconds Make Millions") showing a ~7% bounce rate increase per additional second of LCP above the 2.5s "Good" threshold.
Your site's LCP: → estimated after fixes.
These are estimates based on industry research — actual results vary
Your data stays in your browser — nothing is sent to our servers
Thanks for your feedback!
We'll use a cached audit if available, or offer to scan.
Industry-standard audits powered by Google Lighthouse.
Key metrics that affect user experience.
First Contentful Paint First Contentful Paint — how long until the browser renders the first piece of content. Under 1.8s is good.
10.56 s
Largest Contentful Paint Largest Contentful Paint — how long until the largest visible element loads. Under 2.5s is good.
22.32 s
Total Blocking Time Total Blocking Time — total time the main thread was blocked, preventing user input. Under 200ms is good.
252 ms
Cumulative Layout Shift Cumulative Layout Shift — measures visual stability. How much the page layout shifts during loading. Under 0.1 is good.
0.156
Speed Index Speed Index — how quickly content is visually displayed during load. Under 3.4s is good.
15.88 s
Time to Interactive Time to Interactive — how long until the page is fully interactive and responds to user input. Under 3.8s is good.
22.66 s
Audit breakdown by category with detailed findings.
Remove large, duplicate JavaScript modules from bundles to reduce unnecessary bytes consumed by network activity.
Performance issues directly impact user engagement and conversion rates.
Polyfills and transforms enable older browsers to use new JavaScript features. However, many aren't necessary for modern browsers. Consider modifying your JavaScript build process to not transpile Baseline features, unless you know you must support older browsers. Learn why most sites can deploy ES6+ code without transpiling
Shipping ES5 transpiled code to modern browsers wastes bytes — every user with an evergreen browser pays for compatibility you don't need.
Most users today run browsers that natively support ES6+, async/await, optional chaining, and the rest of modern JavaScript. Transpiling to ES5 'just in case' adds 20-40% to your bundle for no benefit. Configure your build to target a modern browserslist, or ship a differential bundle pair (modern + legacy) with the module/nomodule pattern.
Source: Google web.dev / Lighthouse
3rd party code can significantly impact load performance. Reduce and defer loading of 3rd party code to prioritize your page's content.
Performance issues directly impact user engagement and conversion rates.
A long cache lifetime can speed up repeat visits to your page. Learn more about caching.
Performance issues directly impact user engagement and conversion rates.
Layout shifts occur when elements move absent any user interaction. Investigate the causes of layout shifts, such as elements being added, removed, or their fonts changing as the page loads.
Performance issues directly impact user engagement and conversion rates.
Your first network request is the most important. Reduce its latency by avoiding redirects, ensuring a fast server response, and enabling text compression.
Performance issues directly impact user engagement and conversion rates.
Consider setting font-display to swap or optional to ensure text is consistently visible. swap can be further optimized to mitigate layout shifts with font metric overrides.
Performance issues directly impact user engagement and conversion rates.
Reducing the download time of images can improve the perceived load time of the page and LCP. Learn more about optimizing image size
Performance issues directly impact user engagement and conversion rates.
| URL | Resource Size | Est Savings | |
|---|---|---|---|
Link para o site agenciagov.ebc.com.br div.cover-banner-tile > div > a > img.left | /pt-br/pagina-inicial/@@collective.cover.banner/b2cade03-... | 277.4 KiB | 223.4 KiB |
Banner com link externo - Aplicativo celular seguro div.cover-banner-tile > div > a > img.left | /pt-br/pagina-inicial/@@collective.cover.banner/a7b535d0-... | 215.6 KiB | 161.7 KiB |
Ricardo Stuckert/PR div.tile > div.nitf-basic-tile > a.imag > img | /noticias/202604/201cportugal-pode-ser-a-grande-porta-de-... | 74.1 KiB | 33.9 KiB |
Agricultor div.swiper-container > div.itens > a.item-tile-perfil-usuario > img | www.gov.br/pt-br/perfil_usuario/agricultor/@@images/image | 32.4 KiB | 27.1 KiB |
gov.br div.itens > div.list-item > a.app-toggle-trigger > img | www.gov.br/pt-br/apps/app-gov.br/@@images/imagem.png | 54.4 KiB | 25.7 KiB |
Turista div.swiper-container > div.itens > a.item-tile-perfil-usuario > img | www.gov.br/pt-br/perfil_usuario/turista/@@images/image | 25.5 KiB | 20.2 KiB |
Divulgação/CPB div.tile > div.nitf-basic-tile > a.imag > img | /noticias/202604/gabrielzinho-conquista-premio-laureus-e-... | 60.2 KiB | 17.1 KiB |
link para o canal do Governo Federal div.cover-banner-tile > div > a > img.left | /pt-br/pagina-inicial/@@collective.cover.banner/ec2dd2b3-... | 43.1 KiB | 13.3 KiB |
Carteira Digital de Trânsito div.itens > div.list-item > a.app-toggle-trigger > img | www.gov.br/pt-br/apps/carteira-digital-de-transito-1/@@images/imagem.png | 39.3 KiB | 12.9 KiB |
Aposentado div.swiper-container > div.itens > a.item-tile-perfil-usuario > img | www.gov.br/pt-br/perfil_usuario/aposentado/@@images/image | 14.7 KiB | 9.4 KiB |
Motorista div.swiper-container > div.itens > a.item-tile-perfil-usuario > img | www.gov.br/pt-br/perfil_usuario/motorista/@@images/image | 14.2 KiB | 8.9 KiB |
Empreendedor div.swiper-container > div.itens > a.item-tile-perfil-usuario > img | www.gov.br/pt-br/perfil_usuario/empreendedor/@@images/image | 12.3 KiB | 7.0 KiB |
Conteúdo acessível em Libras usando o VLibras Widget com opções dos Avatares Íc… body.default-header-template > div.enabled > div.active > img.vp-pop-up | /gh/spbgovbr-vlibras/vlibras-portal@dev/app/assets/access... | 9.7 KiB | 6.7 KiB |
Roberto Castro/MTur div.tile > div.nitf-basic-tile > a.imag > img | /noticias/202604/nova-ficha-digital-de-hospedes-agiliza-o... | 43.6 KiB | 6.7 KiB |
Trabalhador div.swiper-container > div.itens > a.item-tile-perfil-usuario > img | www.gov.br/pt-br/perfil_usuario/trabalhador/@@images/image | 11.2 KiB | 5.9 KiB |
Each subpart has specific improvement strategies. Ideally, most of the LCP time should be spent on loading the resources, not within delays.
Performance issues directly impact user engagement and conversion rates.
HTTP/2 and HTTP/3 offer many benefits over HTTP/1.1, such as multiplexing. Learn more about using modern HTTP.
Performance issues directly impact user engagement and conversion rates.
Avoid chaining critical requests by reducing the length of chains, reducing the download size of resources, or deferring the download of unnecessary resources to improve page load.
Performance issues directly impact user engagement and conversion rates.
Requests are blocking the page's initial render, which may delay LCP. Deferring or inlining can move these network requests out of the critical path.
Performance issues directly impact user engagement and conversion rates.
These insights are also available in the Chrome DevTools Performance Panel - record a trace to view more detailed information.
Redirects introduce additional delays before the page can be loaded. Learn how to avoid page redirects.
Performance issues directly impact user engagement and conversion rates.
| URL | Time Spent |
|---|---|
| www.gov.br/ | 1.8 s |
| www.gov.br/pt-br | 0.0 ms |
These are the largest layout shifts observed on the page. Each table item represents a single layout shift, and shows the element that shifted the most. Below each item are possible root causes that led to the layout shift. Some of these layout shifts may not be included in the CLS metric value due to windowing. Learn how to improve CLS
Performance issues directly impact user engagement and conversion rates.
| Element | Layout shift score |
|---|---|
Serviços para você
MAIS ACESSADOS
1
Assinatura Eletrônica
2
Consultar Meu Imp… body.default-header-template > div#wrapper | 0.087 |
MAIS ACESSADOS
1
Assinatura Eletrônica
2
Consultar Meu Imposto de Renda
3
En… main#main-content > div > div#content > div.row | 0.068 |
MAIS ACESSADOS
1
Assinatura Eletrônica
2
Consultar Meu Imposto de Renda
3
En… div.row > div.row-content > div.column > div#d8878bf7-f068-4bd0-aa20-283e0508ccad | 0.012 |
Conteúdo acessível em Libras usando o VLibras Widget com opções dos Avatares Íc… body.default-header-template > div.enabled > div.active | 0.005 |
Idioma atual:
PT
Para começar
Clique em Entrar para acessar sua conta gov.br header.br-header > div.container-lg > div.header-top > div.header-actions | 0.001 |
Meio Ambiente e Clima
Cadastrar Cães e Gatos (SinPatinhas)
Trabalho, Emprego e… div.column > div#c0dad21a-5f08-443e-8df0-f191f16aa9df > div.cover-list-tile > div.itens | 0.001 |
Conteúdo acessível em Libras usando o VLibras Widget com opções dos Avatares Íc… body.default-header-template > div.enabled > div.active > img.vp-pop-up | 0.000 |
Conteúdo acessível em Libras usando o VLibras Widget com opções dos Avatares Íc… body.default-header-template > div.enabled > div.active | 0.000 |
Time to Interactive is the amount of time it takes for the page to become fully interactive. Learn more about the Time to Interactive metric.
Performance issues directly impact user engagement and conversion rates.
The maximum potential First Input Delay that your users could experience is the duration of the longest task. Learn more about the Maximum Potential First Input Delay metric.
Performance issues directly impact user engagement and conversion rates.
Reduce unused rules from stylesheets and defer CSS not used for above-the-fold content to decrease bytes consumed by network activity. Learn how to reduce unused CSS.
Performance issues directly impact user engagement and conversion rates.
| URL | Transfer Size | Est Savings |
|---|---|---|
| www.gov.br/++theme++padrao_govbr/govbrtheme-45cb9c1.css | 229.5 KiB | 213.6 KiB |
| /portal_css/Sunburst Theme/resourcelgpd.plugindsgov.min-c... | 48.3 KiB | 46.6 KiB |
| cdnjs.cloudflare.com/ajax/libs/font-awesome/6.7.1/css/all.min.css | 21.9 KiB | 21.4 KiB |
| /portal_css/Sunburst Theme/base-cachekey-5d4d530888939b03... | 15.4 KiB | 15.1 KiB |
| cdnjs.cloudflare.com/ajax/libs/font-awesome/5.15.4/css/all.min.css | 10.2 KiB | 10.1 KiB |
Reduce unused JavaScript and defer loading scripts until they are required to decrease bytes consumed by network activity. Learn how to reduce unused JavaScript.
Multi-megabyte JavaScript bundles delay every interactive feature on the page.
This is the Lighthouse audit fired when too much JS is shipped relative to what executes. The fix isn't a config flag — it requires bundle analysis (webpack-bundle-analyzer, rollup-plugin-visualizer), splitting routes into chunks, lazy-loading off-screen components, and removing unused dependencies. Fundamentally different from minification: minifying reduces byte count, this reduces what's downloaded at all.
Source: Google web.dev / Lighthouse
| URL | Transfer Size | Est Savings |
|---|---|---|
| www.gov.br/++theme++padrao_govbr/govbrtheme-45cb9c1.js | 139.5 KiB | 94.4 KiB |
| /portal_javascripts/Sunburst Theme/collective.js.jqueryui... | 69.0 KiB | 48.7 KiB |
| barra.sistema.gov.br/v1/barra-govbr-wc.iife.js | 58.5 KiB | 35.6 KiB |
| www.gov.br/++resource++brasil.gov.tiles/brasilgovtiles-7d5753d.js | 41.1 KiB | 33.6 KiB |
| /portal_javascripts/Sunburst Theme/resourceplone.formwidg... | 39.8 KiB | 32.7 KiB |
| www.gov.br/++resource++brasil.gov.agenda/brasilgovagenda-720c34e.js | 36.5 KiB | 32.0 KiB |
| /portal_javascripts/Sunburst Theme/register_function-cach... | 38.1 KiB | 28.1 KiB |
| /portal_javascripts/Sunburst Theme/resourcebrasil.gov.til... | 24.0 KiB | 20.1 KiB |
Consider reducing the time spent parsing, compiling and executing JS. You may find delivering smaller JS payloads helps with this. Learn how to minimize main-thread work
Performance issues directly impact user engagement and conversion rates.
| Category | Time Spent |
|---|---|
| Other | 1.8 s |
| Style & Layout | 1.4 s |
| Script Evaluation | 912 ms |
| Rendering | 395 ms |
| Parse HTML & CSS | 349 ms |
| Script Parsing & Compilation | 302 ms |
Many navigations are performed by going back to a previous page, or forwards again. The back/forward cache (bfcache) can speed up these return navigations. Learn more about the bfcache
Performance issues directly impact user engagement and conversion rates.
| Failure reason | Failure type |
|---|---|
| The page has an unload handler in a sub frame. | Actionable |
Minifying CSS files can reduce network payload sizes. Learn how to minify CSS.
Performance issues directly impact user engagement and conversion rates.
| URL | Transfer Size | Est Savings |
|---|---|---|
| www.gov.br/++theme++padrao_govbr/govbrtheme-45cb9c1.css | 230.5 KiB | 12.8 KiB |
| /portal_css/Sunburst Theme/resourcelgpd.plugindsgov.min-c... | 49.3 KiB | 5.1 KiB |
Minifying JavaScript files can reduce payload sizes and script parse time. Learn how to minify JavaScript.
Performance issues directly impact user engagement and conversion rates.
| URL | Transfer Size | Est Savings |
|---|---|---|
| /portal_javascripts/Sunburst Theme/register_function-cach... | 38.1 KiB | 8.2 KiB |
| /portal_javascripts/Sunburst Theme/resourcebrasil.gov.til... | 24.0 KiB | 5.4 KiB |
| /portal_javascripts/Sunburst Theme/resourcecollective.z3c... | 5.6 KiB | 3.0 KiB |
Large network payloads cost users real money and are highly correlated with long load times. Learn how to reduce payload sizes.
Performance issues directly impact user engagement and conversion rates.
Set an explicit width and height on image elements to reduce layout shifts and improve CLS. Learn how to set image dimensions
Performance issues directly impact user engagement and conversion rates.
| URL | |
|---|---|
Meu SUS Digital div.itens > div.list-item > a.app-toggle-trigger > img | www.gov.br/pt-br/apps/conecte-sus/@@images/imagem.webp |
Agricultor div.swiper-container > div.itens > a.item-tile-perfil-usuario > img | www.gov.br/pt-br/perfil_usuario/agricultor/@@images/image |
Turista div.swiper-container > div.itens > a.item-tile-perfil-usuario > img | www.gov.br/pt-br/perfil_usuario/turista/@@images/image |
Aposentado div.swiper-container > div.itens > a.item-tile-perfil-usuario > img | www.gov.br/pt-br/perfil_usuario/aposentado/@@images/image |
Empreendedor div.swiper-container > div.itens > a.item-tile-perfil-usuario > img | www.gov.br/pt-br/perfil_usuario/empreendedor/@@images/image |
Trabalhador div.swiper-container > div.itens > a.item-tile-perfil-usuario > img | www.gov.br/pt-br/perfil_usuario/trabalhador/@@images/image |
Motorista div.swiper-container > div.itens > a.item-tile-perfil-usuario > img | www.gov.br/pt-br/perfil_usuario/motorista/@@images/image |
More information about the performance of your application. These numbers don't directly affect the Performance score.
These checks highlight opportunities to improve the accessibility of your web app. Automatic detection can only detect a subset of issues and does not guarantee the accessibility of your web app, so manual testing is also encouraged.
When a button doesn't have an accessible name, screen readers announce it as "button", making it unusable for users who rely on screen readers. Learn how to make buttons more accessible.
Performance issues directly impact user engagement and conversion rates.
| Failing Elements |
|---|
div.wrapper-login > div.header-sign-in > div.cta-wrapper > button.br-sign-in div.wrapper-login > div.header-sign-in > div.cta-wrapper > button.br-sign-in |
These are opportunities to improve the semantics of the controls in your application. This may enhance the experience for users of assistive technology, like a screen reader.
Touch targets with sufficient size and spacing help users who may have difficulty targeting small controls to activate the targets. Learn more about touch targets.
Performance issues directly impact user engagement and conversion rates.
| Failing Elements |
|---|
Go to slide 1 div.cover-list-tile > div.swiper-container > div.swiper-pagination-tile-perfis > span.swiper-pagination-bullet |
Go to slide 2 div.cover-list-tile > div.swiper-container > div.swiper-pagination-tile-perfis > span.swiper-pagination-bullet |
Go to slide 3 div.cover-list-tile > div.swiper-container > div.swiper-pagination-tile-perfis > span.swiper-pagination-bullet |
Go to slide 4 div.cover-list-tile > div.swiper-container > div.swiper-pagination-tile-perfis > span.swiper-pagination-bullet |
Go to slide 5 div.cover-list-tile > div.swiper-container > div.swiper-pagination-tile-perfis > span.swiper-pagination-bullet |
Go to slide 6 div.cover-list-tile > div.swiper-container > div.swiper-pagination-tile-perfis > span.swiper-pagination-bullet |
Go to slide 7 div.cover-list-tile > div.swiper-container > div.swiper-pagination-tile-perfis > span.swiper-pagination-bullet |
These items highlight common accessibility best practices.
All sites should be protected with HTTPS, even ones that don't handle sensitive data. This includes avoiding mixed content, where some resources are loaded over HTTP despite the initial request being served over HTTPS. HTTPS prevents intruders from tampering with or passively listening in on the communications between your app and your users, and is a prerequisite for HTTP/2 and many new web platform APIs. Learn more about HTTPS.
Performance issues directly impact user engagement and conversion rates.
| Insecure URL | Request Resolution |
|---|---|
| /noticias/202604/201cportugal-pode-ser-a-grande-porta-de-... | Automatically upgraded to HTTPS |
| /noticias/202604/gabrielzinho-conquista-premio-laureus-e-... | Automatically upgraded to HTTPS |
| /noticias/202604/nova-ficha-digital-de-hospedes-agiliza-o... | Automatically upgraded to HTTPS |
Issues logged to the `Issues` panel in Chrome Devtools indicate unresolved problems. They can come from network request failures, insufficient security controls, and other browser concerns. Open up the Issues panel in Chrome DevTools for more details on each issue.
Performance issues directly impact user engagement and conversion rates.
| Issue type |
|---|
| Mixed content |
Source maps translate minified code to the original source code. This helps developers debug in production. In addition, Lighthouse is able to provide further insights. Consider deploying source maps to take advantage of these benefits. Learn more about source maps.
Performance issues directly impact user engagement and conversion rates.
These checks ensure that your page is following basic search engine optimization advice. There are many additional factors Lighthouse does not score here that may affect your search ranking, including performance on Core Web Vitals. Learn more about Google Search Essentials.
Industry-standard audits powered by Google Lighthouse. — Desktop
Key metrics that affect user experience. — Desktop
First Contentful Paint First Contentful Paint — how long until the browser renders the first piece of content. Under 1.8s is good.
5.87 s
Largest Contentful Paint Largest Contentful Paint — how long until the largest visible element loads. Under 2.5s is good.
8.90 s
Total Blocking Time Total Blocking Time — total time the main thread was blocked, preventing user input. Under 200ms is good.
20 ms
Cumulative Layout Shift Cumulative Layout Shift — measures visual stability. How much the page layout shifts during loading. Under 0.1 is good.
0.141
Speed Index Speed Index — how quickly content is visually displayed during load. Under 3.4s is good.
7.29 s
Time to Interactive Time to Interactive — how long until the page is fully interactive and responds to user input. Under 3.8s is good.
8.97 s
Audit breakdown by category with detailed findings.
Remove large, duplicate JavaScript modules from bundles to reduce unnecessary bytes consumed by network activity.
Performance issues directly impact user engagement and conversion rates.
Polyfills and transforms enable older browsers to use new JavaScript features. However, many aren't necessary for modern browsers. Consider modifying your JavaScript build process to not transpile Baseline features, unless you know you must support older browsers. Learn why most sites can deploy ES6+ code without transpiling
Shipping ES5 transpiled code to modern browsers wastes bytes — every user with an evergreen browser pays for compatibility you don't need.
Most users today run browsers that natively support ES6+, async/await, optional chaining, and the rest of modern JavaScript. Transpiling to ES5 'just in case' adds 20-40% to your bundle for no benefit. Configure your build to target a modern browserslist, or ship a differential bundle pair (modern + legacy) with the module/nomodule pattern.
Source: Google web.dev / Lighthouse
3rd party code can significantly impact load performance. Reduce and defer loading of 3rd party code to prioritize your page's content.
Performance issues directly impact user engagement and conversion rates.
Layout shifts occur when elements move absent any user interaction. Investigate the causes of layout shifts, such as elements being added, removed, or their fonts changing as the page loads.
Performance issues directly impact user engagement and conversion rates.
Your first network request is the most important. Reduce its latency by avoiding redirects, ensuring a fast server response, and enabling text compression.
Performance issues directly impact user engagement and conversion rates.
Consider setting font-display to swap or optional to ensure text is consistently visible. swap can be further optimized to mitigate layout shifts with font metric overrides.
Performance issues directly impact user engagement and conversion rates.
A forced reflow occurs when JavaScript queries geometric properties (such as offsetWidth) after styles have been invalidated by a change to the DOM state. This can result in poor performance. Learn more about forced reflows and possible mitigations.
Performance issues directly impact user engagement and conversion rates.
Reducing the download time of images can improve the perceived load time of the page and LCP. Learn more about optimizing image size
Performance issues directly impact user engagement and conversion rates.
| URL | Resource Size | Est Savings | |
|---|---|---|---|
Banner com link externo - Aplicativo celular seguro div.cover-banner-tile > div > a > img.left | /pt-br/pagina-inicial/@@collective.cover.banner/f51ad801-... | 304.6 KiB | 226.8 KiB |
Ricardo Stuckert/PR div.tile > div.nitf-basic-tile > a.imag > img | /noticias/202604/201cportugal-pode-ser-a-grande-porta-de-... | 74.1 KiB | 60.0 KiB |
link para o canal do Governo Federal div.cover-banner-tile > div > a > img.left | /pt-br/pagina-inicial/@@collective.cover.banner/e3e952ff-... | 69.2 KiB | 55.6 KiB |
Divulgação/CPB div.tile > div.nitf-basic-tile > a.imag > img | /noticias/202604/gabrielzinho-conquista-premio-laureus-e-... | 60.2 KiB | 45.2 KiB |
gov.br div.itens > div.list-item > a.app-toggle-trigger > img | www.gov.br/pt-br/apps/app-gov.br/@@images/imagem.png | 54.4 KiB | 45.0 KiB |
Link para o site agenciagov.ebc.com.br div.cover-banner-tile > div > a > img.left | /pt-br/pagina-inicial/@@collective.cover.banner/b5d73c53-... | 48.8 KiB | 35.2 KiB |
Roberto Castro/MTur div.tile > div.nitf-basic-tile > a.imag > img | /noticias/202604/nova-ficha-digital-de-hospedes-agiliza-o... | 43.6 KiB | 30.7 KiB |
Carteira Digital de Trânsito div.itens > div.list-item > a.app-toggle-trigger > img | www.gov.br/pt-br/apps/carteira-digital-de-transito-1/@@images/imagem.png | 39.3 KiB | 30.7 KiB |
Agricultor div.swiper-container > div.itens > a.item-tile-perfil-usuario > img | www.gov.br/pt-br/perfil_usuario/agricultor/@@images/image | 32.4 KiB | 28.6 KiB |
Turista div.swiper-container > div.itens > a.item-tile-perfil-usuario > img | www.gov.br/pt-br/perfil_usuario/turista/@@images/image | 25.5 KiB | 21.6 KiB |
Aposentado div.swiper-container > div.itens > a.item-tile-perfil-usuario > img | www.gov.br/pt-br/perfil_usuario/aposentado/@@images/image | 14.7 KiB | 10.8 KiB |
Motorista div.swiper-container > div.itens > a.item-tile-perfil-usuario > img | www.gov.br/pt-br/perfil_usuario/motorista/@@images/image | 14.2 KiB | 10.3 KiB |
Conteúdo acessível em Libras usando o VLibras Widget com opções dos Avatares Íc… body.default-header-template > div.enabled > div.active > img.vp-pop-up | /gh/spbgovbr-vlibras/vlibras-portal@dev/app/assets/access... | 9.7 KiB | 8.8 KiB |
Empreendedor div.swiper-container > div.itens > a.item-tile-perfil-usuario > img | www.gov.br/pt-br/perfil_usuario/empreendedor/@@images/image | 12.3 KiB | 8.4 KiB |
Trabalhador div.swiper-container > div.itens > a.item-tile-perfil-usuario > img | www.gov.br/pt-br/perfil_usuario/trabalhador/@@images/image | 11.2 KiB | 7.3 KiB |
Each subpart has specific improvement strategies. Ideally, most of the LCP time should be spent on loading the resources, not within delays.
Performance issues directly impact user engagement and conversion rates.
HTTP/2 and HTTP/3 offer many benefits over HTTP/1.1, such as multiplexing. Learn more about using modern HTTP.
Performance issues directly impact user engagement and conversion rates.
Avoid chaining critical requests by reducing the length of chains, reducing the download size of resources, or deferring the download of unnecessary resources to improve page load.
Performance issues directly impact user engagement and conversion rates.
Requests are blocking the page's initial render, which may delay LCP. Deferring or inlining can move these network requests out of the critical path.
Performance issues directly impact user engagement and conversion rates.
A long cache lifetime can speed up repeat visits to your page. Learn more about caching.
Performance issues directly impact user engagement and conversion rates.
These insights are also available in the Chrome DevTools Performance Panel - record a trace to view more detailed information.
Redirects introduce additional delays before the page can be loaded. Learn how to avoid page redirects.
Performance issues directly impact user engagement and conversion rates.
| URL | Time Spent |
|---|---|
| www.gov.br/ | 1.2 s |
| www.gov.br/pt-br | 0.0 ms |
These are the largest layout shifts observed on the page. Each table item represents a single layout shift, and shows the element that shifted the most. Below each item are possible root causes that led to the layout shift. Some of these layout shifts may not be included in the CLS metric value due to windowing. Learn how to improve CLS
Performance issues directly impact user engagement and conversion rates.
| Element | Layout shift score |
|---|---|
MAIS ACESSADOS
1
Assinatura Eletrônica
2
Consultar Meu Imposto de Renda
3
En… div#content > div.row > div.row-content > div.column | 0.140 |
MAIS ACESSADOS
1
Assinatura Eletrônica
2
Consultar Meu Imposto de Renda
3
En… main#main-content > div > div#content > div.row | 0.036 |
Serviços para você
MAIS ACESSADOS
1
Assinatura Eletrônica
2
Consultar Meu Imp… body.default-header-template > div#wrapper | 0.014 |
Conteúdo acessível em Libras usando o VLibras Widget com opções dos Avatares Íc… body.default-header-template > div.enabled > div.active | 0.001 |
Órgãos do Governo
Acesso à Informação
Legislação
Acessibilidade
Idioma atual:
P… header.br-header > div.container-lg > div.header-top > div.header-actions | 0.000 |
Conteúdo acessível em Libras usando o VLibras Widget com opções dos Avatares Íc… body.default-header-template > div.enabled > div.active | 0.000 |
Serviços para você div.column > div#a4c5cb90-2f53-400c-82c0-7a6e2ffbedab > div.outstanding-header > h2.outstanding-title | 0.000 |
Conteúdo acessível em Libras usando o VLibras Widget com opções dos Avatares Íc… body.default-header-template > div.enabled > div.active > img.vp-access-button | 0.000 |
Conteúdo acessível em Libras usando o VLibras Widget com opções dos Avatares Íc… body.default-header-template > div.enabled > div.active | 0.000 |
O que você procura? div#placeholder | 0.000 |
Conteúdo acessível em Libras usando o VLibras Widget com opções dos Avatares Íc… body.default-header-template > div.enabled > div.active | 0.000 |
Serviços e Informações do Brasil div.header-wrapper > div.site-name-wrapper > h1.site-name > a | 0.000 |
SERVIÇOS DIGITAIS POR PERFIL div#bd1d3567-0b01-4c52-b1fc-27811db7399e > div.cover-list-tile > div.tile-header > div | 0.000 |
Conteúdo acessível em Libras usando o VLibras Widget com opções dos Avatares Íc… body.default-header-template > div.enabled > div.active > img.vp-access-button | 0.000 |
Time to Interactive is the amount of time it takes for the page to become fully interactive. Learn more about the Time to Interactive metric.
Performance issues directly impact user engagement and conversion rates.
Reduce unused rules from stylesheets and defer CSS not used for above-the-fold content to decrease bytes consumed by network activity. Learn how to reduce unused CSS.
Performance issues directly impact user engagement and conversion rates.
| URL | Transfer Size | Est Savings |
|---|---|---|
| www.gov.br/++theme++padrao_govbr/govbrtheme-45cb9c1.css | 229.3 KiB | 216.2 KiB |
| /portal_css/Sunburst Theme/resourcelgpd.plugindsgov.min-c... | 48.3 KiB | 46.5 KiB |
| cdnjs.cloudflare.com/ajax/libs/font-awesome/6.7.1/css/all.min.css | 21.9 KiB | 21.4 KiB |
| /portal_css/Sunburst Theme/base-cachekey-5d4d530888939b03... | 15.4 KiB | 15.1 KiB |
| cdnjs.cloudflare.com/ajax/libs/font-awesome/5.15.4/css/all.min.css | 10.2 KiB | 10.1 KiB |
Reduce unused JavaScript and defer loading scripts until they are required to decrease bytes consumed by network activity. Learn how to reduce unused JavaScript.
Multi-megabyte JavaScript bundles delay every interactive feature on the page.
This is the Lighthouse audit fired when too much JS is shipped relative to what executes. The fix isn't a config flag — it requires bundle analysis (webpack-bundle-analyzer, rollup-plugin-visualizer), splitting routes into chunks, lazy-loading off-screen components, and removing unused dependencies. Fundamentally different from minification: minifying reduces byte count, this reduces what's downloaded at all.
Source: Google web.dev / Lighthouse
| URL | Transfer Size | Est Savings |
|---|---|---|
| www.gov.br/++theme++padrao_govbr/govbrtheme-45cb9c1.js | 139.5 KiB | 94.4 KiB |
| /portal_javascripts/Sunburst Theme/collective.js.jqueryui... | 69.1 KiB | 48.7 KiB |
| barra.sistema.gov.br/v1/barra-govbr-wc.iife.js | 58.5 KiB | 35.6 KiB |
| www.gov.br/++resource++brasil.gov.tiles/brasilgovtiles-7d5753d.js | 41.1 KiB | 33.5 KiB |
| /portal_javascripts/Sunburst Theme/resourceplone.formwidg... | 39.8 KiB | 32.7 KiB |
| www.gov.br/++resource++brasil.gov.agenda/brasilgovagenda-720c34e.js | 36.5 KiB | 31.9 KiB |
| /portal_javascripts/Sunburst Theme/register_function-cach... | 38.2 KiB | 28.1 KiB |
| /portal_javascripts/Sunburst Theme/resourcebrasil.gov.til... | 24.0 KiB | 20.1 KiB |
Many navigations are performed by going back to a previous page, or forwards again. The back/forward cache (bfcache) can speed up these return navigations. Learn more about the bfcache
Performance issues directly impact user engagement and conversion rates.
| Failure reason | Failure type |
|---|---|
| The page has an unload handler in a sub frame. | Actionable |
Minifying CSS files can reduce network payload sizes. Learn how to minify CSS.
Performance issues directly impact user engagement and conversion rates.
| URL | Transfer Size | Est Savings |
|---|---|---|
| www.gov.br/++theme++padrao_govbr/govbrtheme-45cb9c1.css | 230.3 KiB | 12.8 KiB |
| /portal_css/Sunburst Theme/resourcelgpd.plugindsgov.min-c... | 49.3 KiB | 5.1 KiB |
Minifying JavaScript files can reduce payload sizes and script parse time. Learn how to minify JavaScript.
Performance issues directly impact user engagement and conversion rates.
| URL | Transfer Size | Est Savings |
|---|---|---|
| /portal_javascripts/Sunburst Theme/register_function-cach... | 38.2 KiB | 8.2 KiB |
| /portal_javascripts/Sunburst Theme/resourcebrasil.gov.til... | 24.0 KiB | 5.4 KiB |
| /portal_javascripts/Sunburst Theme/resourcecollective.z3c... | 5.6 KiB | 3.0 KiB |
Large network payloads cost users real money and are highly correlated with long load times. Learn how to reduce payload sizes.
Performance issues directly impact user engagement and conversion rates.
Set an explicit width and height on image elements to reduce layout shifts and improve CLS. Learn how to set image dimensions
Performance issues directly impact user engagement and conversion rates.
| URL | |
|---|---|
Meu SUS Digital div.itens > div.list-item > a.app-toggle-trigger > img | www.gov.br/pt-br/apps/conecte-sus/@@images/imagem.webp |
Agricultor div.swiper-container > div.itens > a.item-tile-perfil-usuario > img | www.gov.br/pt-br/perfil_usuario/agricultor/@@images/image |
Turista div.swiper-container > div.itens > a.item-tile-perfil-usuario > img | www.gov.br/pt-br/perfil_usuario/turista/@@images/image |
Aposentado div.swiper-container > div.itens > a.item-tile-perfil-usuario > img | www.gov.br/pt-br/perfil_usuario/aposentado/@@images/image |
Empreendedor div.swiper-container > div.itens > a.item-tile-perfil-usuario > img | www.gov.br/pt-br/perfil_usuario/empreendedor/@@images/image |
Trabalhador div.swiper-container > div.itens > a.item-tile-perfil-usuario > img | www.gov.br/pt-br/perfil_usuario/trabalhador/@@images/image |
Motorista div.swiper-container > div.itens > a.item-tile-perfil-usuario > img | www.gov.br/pt-br/perfil_usuario/motorista/@@images/image |
More information about the performance of your application. These numbers don't directly affect the Performance score.
These checks highlight opportunities to improve the accessibility of your web app. Automatic detection can only detect a subset of issues and does not guarantee the accessibility of your web app, so manual testing is also encouraged.
When a button doesn't have an accessible name, screen readers announce it as "button", making it unusable for users who rely on screen readers. Learn how to make buttons more accessible.
Performance issues directly impact user engagement and conversion rates.
| Failing Elements |
|---|
div.wrapper-login > div.header-sign-in > div.cta-wrapper > button.br-sign-in div.wrapper-login > div.header-sign-in > div.cta-wrapper > button.br-sign-in |
These are opportunities to improve the semantics of the controls in your application. This may enhance the experience for users of assistive technology, like a screen reader.
Touch targets with sufficient size and spacing help users who may have difficulty targeting small controls to activate the targets. Learn more about touch targets.
Performance issues directly impact user engagement and conversion rates.
| Failing Elements |
|---|
Go to slide 1 div.cover-list-tile > div.swiper-container > div.swiper-pagination-tile-perfis > span.swiper-pagination-bullet |
Go to slide 2 div.cover-list-tile > div.swiper-container > div.swiper-pagination-tile-perfis > span.swiper-pagination-bullet |
Go to slide 3 div.cover-list-tile > div.swiper-container > div.swiper-pagination-tile-perfis > span.swiper-pagination-bullet |
Go to slide 4 div.cover-list-tile > div.swiper-container > div.swiper-pagination-tile-perfis > span.swiper-pagination-bullet |
Buscar serviços por li.plain > ul.submenu > li.dropdown-submenu > a.state-protected |
Orçamento Nacional li.plain > ul.submenu > li > a.state-published |
Serviços para o cidadão li.plain > ul.submenu > li > a.state-published |
Acessibilidade li.plain > ul.submenu > li > a.state-published |
Dados Abertos li.plain > ul.submenu > li > a.state-published |
These items highlight common accessibility best practices.
All sites should be protected with HTTPS, even ones that don't handle sensitive data. This includes avoiding mixed content, where some resources are loaded over HTTP despite the initial request being served over HTTPS. HTTPS prevents intruders from tampering with or passively listening in on the communications between your app and your users, and is a prerequisite for HTTP/2 and many new web platform APIs. Learn more about HTTPS.
Performance issues directly impact user engagement and conversion rates.
| Insecure URL | Request Resolution |
|---|---|
| /noticias/202604/201cportugal-pode-ser-a-grande-porta-de-... | Automatically upgraded to HTTPS |
| /noticias/202604/gabrielzinho-conquista-premio-laureus-e-... | Automatically upgraded to HTTPS |
| /noticias/202604/nova-ficha-digital-de-hospedes-agiliza-o... | Automatically upgraded to HTTPS |
Issues logged to the `Issues` panel in Chrome Devtools indicate unresolved problems. They can come from network request failures, insufficient security controls, and other browser concerns. Open up the Issues panel in Chrome DevTools for more details on each issue.
Performance issues directly impact user engagement and conversion rates.
| Issue type |
|---|
| Mixed content |
Source maps translate minified code to the original source code. This helps developers debug in production. In addition, Lighthouse is able to provide further insights. Consider deploying source maps to take advantage of these benefits. Learn more about source maps.
Performance issues directly impact user engagement and conversion rates.
These checks ensure that your page is following basic search engine optimization advice. There are many additional factors Lighthouse does not score here that may affect your search ranking, including performance on Core Web Vitals. Learn more about Google Search Essentials.
Send Feedback