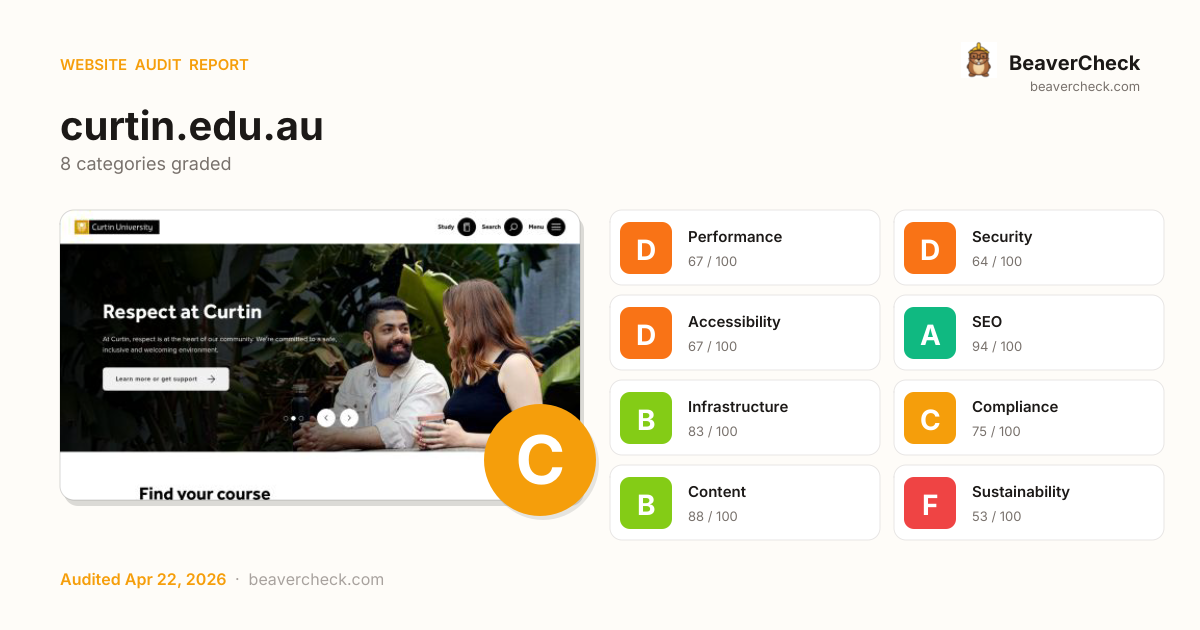
Skip to content
Audit Complete

Results for https://curtin.edu.au

Visit site
AU · AUD (A$) · Estimated Applicable regulations: Privacy Act 1988 · DDA Dev cost: A$ 110/hr How jurisdiction is detected
Spain Spain · Madrid Completed: Apr 22, 2026 23:45 UTC
Download JSON Download Markdown Report

Mobile 375 × 812

Screenshot of the audited page (Mobile 375×812)

Desktop 1440 × 900

Screenshot of the audited page (Desktop 1440×900)
C72

Site Health

Score: 72 / 100

Based on 8 categories, 0 sections

Room to improve — your 11.5s load time is above Google's 2.5s 'Good' threshold.

Several missing protections leave your users and data exposed.

Several issues make your site difficult for assistive technology users.

Well-optimized for search — your content is discoverable.

Good server performance with room for optimization.

Mostly compliant — a few items need attention.

Rich content metadata — your pages look great everywhere.

Heavier than average — reducing page weight saves energy and bandwidth.

How is this calculated?

The overall score is a weighted average of individual category scores. Categories with more impact on user experience and security carry more weight.

Performance 25%Security 25%Accessibility 15%SEO 10%Infrastructure 10%Compliance 8%Content 5%Sustainability 2%

Weights reflect general web best practices. Individual needs may differ.

How the composite score is calculated

How you compare

WordPress · 712 peers
You 72
·
Avg 74
At average
0 50 100
Better than 18% of WordPress sites See full WordPress benchmark →
Adobe Fonts · 229 peers
You 72
·
Avg 73
At average
0 50 100
Better than 28% of Adobe Fonts sites See full Adobe Fonts benchmark →

Top Priorities (5)

1

Content-Security-Policy header is missing

Security gaps expose your site and users to attacks, eroding trust.

Security › Security Headers
2

HSTS header is missing

Security gaps expose your site and users to attacks, eroding trust.

Security › Security Headers
3

No Content-Security-Policy header found

Security gaps expose your site and users to attacks, eroding trust.

Security › Content Security Policy
4

Page weighs 24.3 MB (8.1 MB transferred)

Performance issues directly impact user engagement and conversion rates.

Performance › Page Weight Budget
5

2 button(s) with no accessible text

Accessibility issues exclude users with disabilities — up to 15% of your potential audience.

Accessibility › Link & Button Quality
View fix priority matrix

Fix Priority Matrix

5 findings

Quick Wins

3

High impact, low effort — start here.

Strategic

2

High impact, requires investment.

Easy Improvements

0

Small gains, minimal effort.

Nothing in this quadrant — good news.

Deprioritize

0

Low impact, high effort — do last.

Nothing in this quadrant — good news.

← Low effort High effort →
BeaverCheck badge
Embed this badge
[![BeaverCheck](https://beavercheck.com/badge?url=https%3A%2F%2Fcurtin.edu.au)](https://beavercheck.com/results/3bec0e0c-3e73-498f-b775-35a61f0af5d9)
<a href="https://beavercheck.com/results/3bec0e0c-3e73-498f-b775-35a61f0af5d9"><img src="https://beavercheck.com/badge?url=https%3A%2F%2Fcurtin.edu.au" alt="BeaverCheck Score"></a>
https://beavercheck.com/badge?url=https%3A%2F%2Fcurtin.edu.au

This badge auto-updates with your latest scan result.

What fixing these means

Your site performs reasonably well, but a few targeted fixes could meaningfully improve results. Your LCP of 11.5s exceeds Google's 2.5s 'Good' threshold and the 1 performance issue below directly contributes to it. Addressing the critical issues below would have the most immediate impact on your user trust.

3 security gaps detected — browsers may warn visitors about your site.
Your LCP is 11.5s — fixing the 1 performance critical could bring it under Google's 2.5s 'Good' threshold.
1 accessibility issue excludes users who rely on assistive technology.

Conversion Barriers

3 critical 3 warning

6 barrier(s) likely increasing bounce by ~32%.

Speed (2)

Page takes 11.5s to load

+12% bounce

Users abandon at ~3s — you're 9.0s over the 2.5s threshold

Fix: Optimize render-blocking resources, preload the hero image, and compress images

Page feels frozen for 2.7s

+5% bounce

Clicks on the primary CTA are ignored while JavaScript runs

Fix: Break up long tasks; defer non-critical JavaScript to post-hydration

Trust (3)

Mixed content on HTTPS page

+8% bounce

Browsers block insecure subresources — broken images, missing scripts, warning badge

Fix: Change http:// URLs inside the page to https:// (or protocol-relative)

No HSTS header

+1% bounce

Returning visitors are briefly exposed to downgrade attacks on first request

Fix: Set Strict-Transport-Security: max-age=31536000; includeSubDomains

No Content-Security-Policy header

+1% bounce

Higher XSS blast radius — one compromised script can exfiltrate the checkout form

Fix: Ship a reporting-only CSP first, then enforce once violations are clean

Navigation (1)

2 broken link(s) on the page

+3% bounce

Clicks land on 404s — trust drops and the session often ends

Fix: Fix or remove the broken destinations surfaced on the Content tab

Preliminary CRO audit — each barrier links to the tab with detailed analysis.

Return on Investment

AUD 550 investment → AUD 5,039/month returns + AUD 50,200,000 risk avoided

Payback period: < 1 month First-year ROI: +10893%

Investment

AUD 550

5h · 5 findings

Monthly returns

AUD 5,039 /mo

~AUD 60,464 / year

  • Conversions recovered AUD 5,035
  • Bandwidth savings AUD 3.15

Regulatory risk avoided

AUD 50,200,000

if kept compliant

  • Privacy Act 1988 AUD 50,000,000
  • DDA AUD 200,000

Payback period

0 12mo 24mo

AUD 165 — in quick wins — start here for the fastest payback

Figures combine localized regulatory fine ceilings, search/conversion value priced against local CPC, and bandwidth waste estimates. Results depend on implementation quality and audience composition. Not legal or financial advice.

Full methodology & sources

Estimated Remediation Cost

A$550

5.0 developer hours at A$110/hr

Based on Australia rates (A$110/hr)

Quick wins
A$165 3 fixes in ~90 minutes

Start here for the best return on investment

Cost by category

Cost by effort level

Adjust assumptions
A$ /hr

Rates reflect fully-loaded developer cost including overhead

How developer rates are sourced

What Inaction Is Costing You

AUD 4,183,336 / month at risk

~AUD 50,200,038 / year if left unfixed

Compliance Risk

AUD 50,200,000

Privacy Act 1988DDA
  • No privacy policy link detected
    Privacy Act 1988: AUD 66,000 – AUD 50,000,000
  • 1 advertising/retargeting trackers detected
    Privacy Act 1988: AUD 66,000 – AUD 50,000,000
  • Trackers detected but no cookie policy found
    Privacy Act 1988: AUD 66,000 – AUD 50,000,000

+4 more

Bandwidth Waste

AUD 3.15 /mo

25589.2 MB/mo × 0.123 AUD/GB

  • Optimize transfer: save ~2.6 MB per page load
    Saves AUD 3.15/mo

Compliance figures represent the statutory maximum fine for the most severe triggered category, capped per regulation — not the sum of per-finding penalties. Based on published regulatory fine ranges. This is not legal advice.

Compliance methodology · SEO assumptions · Bandwidth model

Your performance is already good — improvements may show diminishing returns

Unique monthly visitors from your analytics

Purchases, signups, or key actions

Optional — for revenue estimation

additional conversions/month

more engaged visitors from reduced bounce

potential monthly revenue
Current bounce (est.)
After fixes (est.)
Estimated bounce reduction

Fix 5 critical issues to capture this value

How this is calculated

Based on Google/Deloitte research ("Milliseconds Make Millions") showing a ~7% bounce rate increase per additional second of LCP above the 2.5s "Good" threshold.

Your site's LCP: → estimated after fixes.

These are estimates based on industry research — actual results vary

Bounce-rate model & assumptions

Your data stays in your browser — nothing is sent to our servers

Was this report useful?

Thanks for your feedback!

We'll use a cached audit if available, or offer to scan.

Checking for existing audit...

Lighthouse Scores

Industry-standard audits powered by Google Lighthouse.

27
Performance Overall performance score (0–100) based on Core Web Vitals and other metrics. 90+ is good.
90
Accessibility Measures how accessible the page is for users with disabilities. Checks color contrast, ARIA labels, and semantic HTML.
81
Best Practices Checks for modern web development best practices including HTTPS, no console errors, and secure JavaScript.
100
SEO Measures basic SEO optimizations: meta tags, crawlability, link text, and mobile friendliness.

Core Web Vitals

Key metrics that affect user experience.

First Contentful Paint First Contentful Paint — how long until the browser renders the first piece of content. Under 1.8s is good.

5.45 s

Largest Contentful Paint Largest Contentful Paint — how long until the largest visible element loads. Under 2.5s is good.

11.46 s

Total Blocking Time Total Blocking Time — total time the main thread was blocked, preventing user input. Under 200ms is good.

2.72 s

Cumulative Layout Shift Cumulative Layout Shift — measures visual stability. How much the page layout shifts during loading. Under 0.1 is good.

0.001

Speed Index Speed Index — how quickly content is visually displayed during load. Under 3.4s is good.

20.70 s

Time to Interactive Time to Interactive — how long until the page is fully interactive and responds to user input. Under 3.8s is good.

48.56 s

Detailed Report

Audit breakdown by category with detailed findings.

27

Performance

Insights

Remove large, duplicate JavaScript modules from bundles to reduce unnecessary bytes consumed by network activity.

Why this matters

Performance issues directly impact user engagement and conversion rates.

Polyfills and transforms enable older browsers to use new JavaScript features. However, many aren't necessary for modern browsers. Consider modifying your JavaScript build process to not transpile Baseline features, unless you know you must support older browsers. Learn why most sites can deploy ES6+ code without transpiling

Why this matters

Shipping ES5 transpiled code to modern browsers wastes bytes — every user with an evergreen browser pays for compatibility you don't need.

Learn more

Most users today run browsers that natively support ES6+, async/await, optional chaining, and the rest of modern JavaScript. Transpiling to ES5 'just in case' adds 20-40% to your bundle for no benefit. Configure your build to target a modern browserslist, or ship a differential bundle pair (modern + legacy) with the module/nomodule pattern.

Source: Google web.dev / Lighthouse

3rd party code can significantly impact load performance. Reduce and defer loading of 3rd party code to prioritize your page's content.

Why this matters

Performance issues directly impact user engagement and conversion rates.

Your first network request is the most important. Reduce its latency by avoiding redirects, ensuring a fast server response, and enabling text compression.

Why this matters

Performance issues directly impact user engagement and conversion rates.

A forced reflow occurs when JavaScript queries geometric properties (such as offsetWidth) after styles have been invalidated by a change to the DOM state. This can result in poor performance. Learn more about forced reflows and possible mitigations.

Why this matters

Performance issues directly impact user engagement and conversion rates.

headings: [map[key:source label:Top function call valueType:source-location] map[granularity:1 key:reflowTime label:Total reflow time valueType:ms]]
items: [map[reflowTime:35.828 source:map[column:27323 line:2 type:source-location url:https://s30991.pcdn.co/wp-includes/js/jquery/jquery.min.js?ver=3.7.1 urlProvider:network]]]
headings: [map[key:source label:Source valueType:source-location] map[granularity:1 key:reflowTime label:Total reflow time valueType:ms]]
items: [map[reflowTime:144.877 source:map[type:text value:[unattributed]]] map[reflowTime:0.276 source:map[column:29078 line:1 type:source-location url:https://s30991.pcdn.co/wp-content/themes/mimas/dist/js/app.js urlProvider:network]] map[reflowTime:1.302 source:map[column:691533 line:1 type:source-location url:https://s30991.pcdn.co/wp-content/themes/mimas/dist/js/vendor.js urlProvider:network]] map[reflowTime:16.92 source:map[column:694150 line:1 type:source-location url:https://s30991.pcdn.co/wp-content/themes/mimas/dist/js/vendor.js urlProvider:network]] map[reflowTime:22.926 source:map[column:49615 line:1 type:source-location url:https://s30991.pcdn.co/wp-includes/js/jquery/jquery.min.js?ver=3.7.1 urlProvider:network]] map[reflowTime:10.346 source:map[column:49637 line:1 type:source-location url:https://s30991.pcdn.co/wp-includes/js/jquery/jquery.min.js?ver=3.7.1 urlProvider:network]] map[reflowTime:1.288 source:map[column:693855 line:1 type:source-location url:https://s30991.pcdn.co/wp-content/themes/mimas/dist/js/vendor.js urlProvider:network]]]

Each subpart has specific improvement strategies. Ideally, most of the LCP time should be spent on loading the resources, not within delays.

Why this matters

Performance issues directly impact user engagement and conversion rates.

headings: [map[key:label label:Subpart valueType:text] map[key:duration label:Duration valueType:ms]]
items: [map[duration:2121.06 label:Time to first byte subpart:timeToFirstByte] map[duration:188.645 label:Resource load delay subpart:resourceLoadDelay] map[duration:26.475 label:Resource load duration subpart:resourceLoadDuration] map[duration:525.299 label:Element render delay subpart:elementRenderDelay]]
lhId: page-0-DIV
nodeLabel: Curtin Open Day 2026  Sunday 24 May, 10am to 3pm Explore courses, tour campus…
path: 1,HTML,3,BODY,9,MIMAS-MASTHEAD,0,DIV,0,DIV,0,DIV,0,DIV,0,DIV,0,DIV,0,DIV
selector: div#slick-slide00 > div > div.mh-slide__container > div.mh-slide
snippet: <div class="mh-slide" style="--mh-slide-bg: url(https://s30991.pcdn.co/wp-content/uploads/sites/4/2026/…;" data-image-position="">

Optimize LCP by making the LCP image discoverable from the HTML immediately, and avoiding lazy-loading

Why this matters

Performance issues directly impact user engagement and conversion rates.

lhId: page-0-DIV
nodeLabel: Curtin Open Day 2026  Sunday 24 May, 10am to 3pm Explore courses, tour campus…
path: 1,HTML,3,BODY,9,MIMAS-MASTHEAD,0,DIV,0,DIV,0,DIV,0,DIV,0,DIV,0,DIV,0,DIV
selector: div#slick-slide00 > div > div.mh-slide__container > div.mh-slide
snippet: <div class="mh-slide" style="--mh-slide-bg: url(https://s30991.pcdn.co/wp-content/uploads/sites/4/2026/…;" data-image-position="">

Avoid chaining critical requests by reducing the length of chains, reducing the download size of resources, or deferring the download of unnecessary resources to improve page load.

Why this matters

Performance issues directly impact user engagement and conversion rates.

description: [preconnect](https://developer.chrome.com/docs/lighthouse/performance/uses-rel-preconnect/) hints help the browser establish a connection earlier in the page load, saving time when the first request for that origin is made. The following are the origins that the page preconnected to.
title: Preconnected origins
description: Add [preconnect](https://developer.chrome.com/docs/lighthouse/performance/uses-rel-preconnect/) hints to your most important origins, but try to use no more than 4.
title: Preconnect candidates

Requests are blocking the page's initial render, which may delay LCP. Deferring or inlining can move these network requests out of the critical path.

Why this matters

Performance issues directly impact user engagement and conversion rates.

A long cache lifetime can speed up repeat visits to your page. Learn more about caching.

Why this matters

Performance issues directly impact user engagement and conversion rates.

RequestCache TTLTransfer Size
/images/1761ad94-f7b4-466f-ae5f-6e617c13c9fc/6538fb62-bdb...0.0 ms1.0 MiB
/images/1761ad94-f7b4-466f-ae5f-6e617c13c9fc/943ac062-c20...0.0 ms321.4 KiB
/images/1761ad94-f7b4-466f-ae5f-6e617c13c9fc/40cdd8e2-2ef...0.0 ms261.0 KiB
/images/1761ad94-f7b4-466f-ae5f-6e617c13c9fc/c9fabfe3-496...0.0 ms115.9 KiB
connect.facebook.net/en_US/fbevents.js1200.0 s96.6 KiB
i.ytimg.com/vi/8DCiSMOQIx0/maxresdefault.jpg7200.0 s56.2 KiB
/signals/config/415133522630959?v=2.9.303&r=stable&domain...1200.0 s46.5 KiB
www.instagram.com/embed.js1200.0 s33.8 KiB
i.ytimg.com/vi_webp/duUZMki6DDI/maxresdefault.webp7200.0 s36.1 KiB
i.ytimg.com/vi_webp/40ddEmjZ46w/maxresdefault.webp7200.0 s34.3 KiB
scripts.clarity.ms/0.8.60-beta/clarity.js0.0 ms25.0 KiB
/signals/config/547059549414519?v=2.9.303&r=stable&domain...1200.0 s16.7 KiB
js.adsrvr.org/up_loader.1.1.0.js0.0 ms12.3 KiB
snap.licdn.com/li.lms-analytics/insight.min.js86400.0 s18.7 KiB
munchkin.marketo.net/munchkin.js0.0 ms1.2 KiB
js.adsrvr.org/universal_pixel.js0.0 ms958 B
/collect?v=2&fmt=js&pid=1376404&time=1776901333057&url=ht...0.0 ms691 B
/config/au/777363f7-8833-4ecc-a6cb-e757c2dcc623.js?v=3.56...0.0 ms477 B
static.doubleclick.net/instream/ad_status.js900.0 s495 B
/p.css?s=1&k=qji7bck&ht=tk&f=137.138.139.140.169.170.173....604800.0 s172 B
/tr/?id=415133522630959&ev=PageView&dl=https%3A%2F%2Fwww....0.0 ms16 B
/tr/?id=547059549414519&ev=PageView&dl=https%3A%2F%2Fwww....0.0 ms16 B
static.doubleclick.net/instream/ad_status.js900.0 s0 B

Reducing the download time of images can improve the perceived load time of the page and LCP. Learn more about optimizing image size

Why this matters

Performance issues directly impact user engagement and conversion rates.

URLResource SizeEst Savings
Schools must do more than box-ticking to support Indigenous kids: report div.thumb > div.thumb__nail > a > img.thumb-img
s30991.pcdn.co/news/wp-content/uploads/2026/04/SP-20150507-5625-1000x500.jpg169.2 KiB132.8 KiB
Panorama view of Miri city, Sarawak, Borneo, Malaysia div > div.mc-item > a.mc-link > img
/wp-content/uploads/sites/4/2022/12/AdobeStock_220638856-...196.9 KiB112.5 KiB
Nationally defined framework to recognise Culturally Significant Entities div.thumb > div.thumb__nail > a > img.thumb-img
/news/wp-content/uploads/2026/04/Martuwarra-Fitzroy-River...166.5 KiB104.3 KiB
Wide shot of Curtin's main Perth campus div > div.mc-item > a.mc-link > img
/wp-content/uploads/sites/4/2023/06/curtin-perth-2000x100...152.8 KiB98.7 KiB
Study looks to Africa to best support Aussies living with chronic conditions div.thumb > div.thumb__nail > a > img.thumb-img
s30991.pcdn.co/news/wp-content/uploads/2026/04/IMG-20251014-WA0014-1000x500.jpg102.5 KiB66.1 KiB
Curtin appoints Cisco leader to foster future tech talent div.thumb > div.thumb__nail > a > img.thumb-img
/news/wp-content/uploads/2026/04/Carl_Solder_Lecturing_20...79.6 KiB43.1 KiB
Mauritius div > div.mc-item > a.mc-link > img
s30991.pcdn.co/wp-content/uploads/sites/4/2022/12/Mauritius.jpeg.webp55.6 KiB29.6 KiB
Singapore div > div.mc-item > a.mc-link > img
s30991.pcdn.co/wp-content/uploads/sites/4/2022/12/Singapore.jpg.webp37.1 KiB17.8 KiB
Dubai div > div.mc-item > a.mc-link > img
s30991.pcdn.co/wp-content/uploads/sites/4/2022/12/Dubai.jpg.webp35.4 KiB16.1 KiB
Skyline of Colombo, Sri Lanka div > div.mc-item > a.mc-link > img
s30991.pcdn.co/wp-content/uploads/sites/4/2024/11/colombo_skyline.jpg.webp36.9 KiB10.9 KiB

These insights are also available in the Chrome DevTools Performance Panel - record a trace to view more detailed information.

Time to Interactive is the amount of time it takes for the page to become fully interactive. Learn more about the Time to Interactive metric.

Why this matters

Performance issues directly impact user engagement and conversion rates.

TTI

Redirects introduce additional delays before the page can be loaded. Learn how to avoid page redirects.

Why this matters

Performance issues directly impact user engagement and conversion rates.

Estimated savings: 1.7 s
URLTime Spent
curtin.edu.au/1.7 s
www.curtin.edu.au/0.0 ms

The maximum potential First Input Delay that your users could experience is the duration of the longest task. Learn more about the Maximum Potential First Input Delay metric.

Why this matters

Performance issues directly impact user engagement and conversion rates.

Diagnostics

Reduce unused rules from stylesheets and defer CSS not used for above-the-fold content to decrease bytes consumed by network activity. Learn how to reduce unused CSS.

Why this matters

Performance issues directly impact user engagement and conversion rates.

Reduce unused JavaScript and defer loading scripts until they are required to decrease bytes consumed by network activity. Learn how to reduce unused JavaScript.

Why this matters

Multi-megabyte JavaScript bundles delay every interactive feature on the page.

Learn more

This is the Lighthouse audit fired when too much JS is shipped relative to what executes. The fix isn't a config flag — it requires bundle analysis (webpack-bundle-analyzer, rollup-plugin-visualizer), splitting routes into chunks, lazy-loading off-screen components, and removing unused dependencies. Fundamentally different from minification: minifying reduces byte count, this reduces what's downloaded at all.

Source: Google web.dev / Lighthouse

Estimated savings: 1.3 s 1.3 MiB
URLTransfer SizeEst Savings
s30991.pcdn.co/wp-content/themes/mimas/dist/js/vendor.js230.7 KiB208.4 KiB
analytics.tiktok.com/i18n/pixel/static/main.MWE0ZWQ3ZWQwOQ.js120.9 KiB92.8 KiB
www.googletagmanager.com/gtm.js?id=GTM-WKWRXD&l=dataCoreLayer183.2 KiB78.7 KiB
/gtag/destination?id=AW-696927740&l=dataCoreLayer&cx=c&gt...133.9 KiB67.3 KiB
analytics.tiktok.com/i18n/pixel/static/main.MWE0ZWQ3ZWQwOQ.js120.9 KiB65.7 KiB
www.googletagmanager.com/gtag/js?id=G-EKWQ9HJQLL&l=dataCoreLayer&cx=c&gtm=4e64k1176.2 KiB64.9 KiB
www.googletagmanager.com/gtag/js?id=AW-798357996&l=dataCoreLayer&cx=c&gtm=4e64k1144.4 KiB62.4 KiB
www.googletagmanager.com/gtag/js?id=AW-969241043&l=dataCoreLayer&cx=c&gtm=4e64k1137.3 KiB61.4 KiB
www.googletagmanager.com/gtag/js?id=AW-845765649&l=dataCoreLayer&cx=c&gtm=4e64k1137.3 KiB61.4 KiB
www.googletagmanager.com/gtag/js?id=AW-809627420&l=dataCoreLayer&cx=c&gtm=4e64k1137.3 KiB61.4 KiB
www.googletagmanager.com/gtag/js?id=AW-845765595&l=dataCoreLayer&cx=c&gtm=4e64k1137.3 KiB61.4 KiB
www.googletagmanager.com/gtag/js?id=AW-603415810&l=dataCoreLayer&cx=c&gtm=4e64k1137.3 KiB61.4 KiB
www.googletagmanager.com/gtag/js?id=AW-845765673&l=dataCoreLayer&cx=c&gtm=4e64k1137.3 KiB60.7 KiB
www.googletagmanager.com/gtag/js?id=G-SWCC7XWPW9&l=dataCoreLayer&cx=c&gtm=4e64k1156.8 KiB60.0 KiB
www.googletagmanager.com/gtag/js?id=DC-14510064&l=dataCoreLayer&cx=c&gtm=4e64k1130.6 KiB57.4 KiB
s30991.pcdn.co/wp-content/themes/mimas/dist/js/2026/header.js?v=3.5.588.9 KiB56.8 KiB
www.googletagmanager.com/gtm.js?id=GTM-PZM3KG&l=dataCoreLayer198.0 KiB52.6 KiB
connect.facebook.net/en_US/fbevents.js96.5 KiB31.8 KiB
www.instagram.com/embed.js33.7 KiB26.9 KiB

Consider reducing the time spent parsing, compiling, and executing JS. You may find delivering smaller JS payloads helps with this. Learn how to reduce Javascript execution time.

Why this matters

Performance issues directly impact user engagement and conversion rates.

URLTotal CPU TimeScript EvaluationScript Parse
s30991.pcdn.co/wp-includes/js/jquery/jquery.min.js?ver=3.7.12.1 s1.6 s7.5 ms
Unattributable1.5 s96 ms0.0 ms
www.curtin.edu.au/1.4 s21 ms2.6 ms
s30991.pcdn.co/wp-content/themes/mimas/dist/js/vendor.js658 ms92 ms62 ms
www.googletagmanager.com/gtm.js?id=GTM-PZM3KG&l=dataCoreLayer519 ms437 ms55 ms
www.googletagmanager.com/gtm.js?id=GTM-WKWRXD&l=dataCoreLayer453 ms392 ms41 ms
analytics.tiktok.com/i18n/pixel/static/main.MWE0ZWQ3ZWQwOQ.js448 ms318 ms122 ms
www.googletagmanager.com/gtag/js?id=G-EKWQ9HJQLL&l=dataCoreLayer&cx=c&gtm=4e64k1345 ms304 ms35 ms
www.googletagmanager.com/gtag/js?id=DC-14510064&l=dataCoreLayer&cx=c&gtm=4e64k1324 ms206 ms56 ms
/gtag/destination?id=AW-696927740&l=dataCoreLayer&cx=c&gt...294 ms242 ms51 ms
scripts.clarity.ms/0.8.60-beta/clarity.js269 ms212 ms5.0 ms
www.googletagmanager.com/gtag/js?id=G-SWCC7XWPW9&l=dataCoreLayer&cx=c&gtm=4e64k1263 ms229 ms32 ms
sc-static.net/scevent.min.js252 ms192 ms8.6 ms
s30991.pcdn.co/wp-content/themes/mimas/dist/js/2026/header.js?v=3.5.5217 ms117 ms18 ms
www.googletagmanager.com/gtag/js?id=AW-603415810&l=dataCoreLayer&cx=c&gtm=4e64k1214 ms189 ms24 ms
www.googletagmanager.com/gtag/js?id=AW-845765673&l=dataCoreLayer&cx=c&gtm=4e64k1213 ms181 ms30 ms
www.googletagmanager.com/gtag/js?id=AW-798357996&l=dataCoreLayer&cx=c&gtm=4e64k1204 ms174 ms28 ms
www.googletagmanager.com/gtag/js?id=AW-969241043&l=dataCoreLayer&cx=c&gtm=4e64k1197 ms155 ms40 ms
www.googletagmanager.com/gtag/js?id=AW-809627420&l=dataCoreLayer&cx=c&gtm=4e64k1195 ms160 ms33 ms
www.googletagmanager.com/gtag/js?id=AW-845765595&l=dataCoreLayer&cx=c&gtm=4e64k1189 ms162 ms26 ms
snap.licdn.com/li.lms-analytics/insight.min.js169 ms104 ms60 ms
www.googletagmanager.com/gtag/js?id=AW-845765649&l=dataCoreLayer&cx=c&gtm=4e64k1163 ms138 ms23 ms
/signals/config/415133522630959?v=2.9.303&r=stable&domain...137 ms120 ms13 ms
connect.facebook.net/en_US/fbevents.js119 ms86 ms30 ms
/signals/config/547059549414519?v=2.9.303&r=stable&domain...70 ms61 ms6.5 ms

Consider reducing the time spent parsing, compiling and executing JS. You may find delivering smaller JS payloads helps with this. Learn how to minimize main-thread work

Why this matters

Performance issues directly impact user engagement and conversion rates.

CategoryTime Spent
Script Evaluation6.5 s
Other2.3 s
Style & Layout1.2 s
Script Parsing & Compilation871 ms
Garbage Collection341 ms
Rendering209 ms
Parse HTML & CSS129 ms

More information about the performance of your application. These numbers don't directly affect the Performance score.

Layout shift culprits
Optimize DOM size
Modern HTTP
Optimize viewport for mobile
Minify CSS
Minify JavaScript
User Timing marks and measures 13 user timings
Avoid long main-thread tasks 20 long tasks found
Avoid non-composited animations 17 animated elements found
Image elements have explicit `width` and `height`
Page didn't prevent back/forward cache restoration
Network Requests
Network Round Trip Times 300 ms
Server Backend Latencies 260 ms
Tasks
Diagnostics
Metrics
Screenshot Thumbnails
Final Screenshot
Script Treemap Data
Resources Summary
Initial server response time was short Root document took 600 ms
Avoid large layout shifts 1 layout shift found
INP breakdown
90

Accessibility

These checks highlight opportunities to improve the accessibility of your web app. Automatic detection can only detect a subset of issues and does not guarantee the accessibility of your web app, so manual testing is also encouraged.

Names and labels

When a button doesn't have an accessible name, screen readers announce it as "button", making it unusable for users who rely on screen readers. Learn how to make buttons more accessible.

Why this matters

Performance issues directly impact user engagement and conversion rates.

Failing Elements
mimas-block > form.search-form > fieldset.search-bar > button.search-clear mimas-block > form.search-form > fieldset.search-bar > button.search-clear

Including a skip link can help users skip to the main content to save time. Learn more about skip links.

Why this matters

Performance issues directly impact user engagement and conversion rates.

Failing Elements
Skip to the content body.home > nav.skip-links > a.skip-to-content
Skip to search body.home > nav.skip-links > a
Skip to secondary navigation body.home > nav.skip-links > a

These are opportunities to improve the semantics of the controls in your application. This may enhance the experience for users of assistive technology, like a screen reader.

Navigation

Properly ordered headings that do not skip levels convey the semantic structure of the page, making it easier to navigate and understand when using assistive technologies. Learn more about heading order.

Why this matters

Performance issues directly impact user engagement and conversion rates.

Failing Elements
Explore our study areas article.mimas-grid > mimas-block > section.study-areas > h4

These are opportunities to improve keyboard navigation in your application.

Tables and lists

Screen readers have a specific way of announcing lists. Ensuring proper list structure aids screen reader output. Learn more about proper list structure.

Why this matters

Performance issues directly impact user engagement and conversion rates.

Failing Elements
Study Study Study at Curtin Find a course Explore course types Browse study are… div.mm-ocd > div.mm-ocd__content > nav.header__mobile-nav > ul.first-level
Study Study at Curtin Find a course Explore course types Browse study areas Ent… nav.header__mobile-nav > ul.first-level > li > ul#sub-menu-1
Life at Curtin Life at Curtin Regional study Living in Perth Learning and study… nav.header__mobile-nav > ul.first-level > li > ul#sub-menu-2
Engage Engage For industry For education providers, teachers and advisors For a… nav.header__mobile-nav > ul.first-level > li > ul#sub-menu-3
About About Curtin Respect at Curtin Rankings and reputation Learning and teach… nav.header__mobile-nav > ul.first-level > li > ul#sub-menu-4
Research Research at Curtin Research areas Higher degrees by research Our resea… nav.header__mobile-nav > ul.first-level > li > ul#sub-menu-5
News & events News Events Media Centre nav.header__mobile-nav > ul.first-level > li > ul#sub-menu-6

These are opportunities to improve the experience of reading tabular or list data using assistive technology, like a screen reader.

Interactive controls are keyboard focusable
Interactive elements indicate their purpose and state
The page has a logical tab order
Visual order on the page follows DOM order
User focus is not accidentally trapped in a region
The user's focus is directed to new content added to the page
HTML5 landmark elements are used to improve navigation
Offscreen content is hidden from assistive technology
Custom controls have associated labels
Custom controls have ARIA roles
`[aria-*]` attributes match their roles
`[aria-hidden="true"]` is not present on the document `<body>`
`[role]`s have all required `[aria-*]` attributes
Elements with an ARIA `[role]` that require children to contain a specific `[role]` have all required children.
`[role]`s are contained by their required parent element
`[role]` values are valid
`[aria-*]` attributes have valid values
`[aria-*]` attributes are valid and not misspelled
Image elements have `[alt]` attributes
Form elements have associated labels
`[user-scalable="no"]` is not used in the `<meta name="viewport">` element and the `[maximum-scale]` attribute is not less than 5.
ARIA attributes are used as specified for the element's role
`[aria-hidden="true"]` elements do not contain focusable descendents
Elements use only permitted ARIA attributes
Background and foreground colors have a sufficient contrast ratio
Document has a `<title>` element
`<frame>` or `<iframe>` elements have a title
`<html>` element has a `[lang]` attribute
`<html>` element has a valid value for its `[lang]` attribute
Links have a discernible name
List items (`<li>`) are contained within `<ul>`, `<ol>` or `<menu>` parent elements
No element has a `[tabindex]` value greater than 0
Touch targets have sufficient size and spacing.
Document has a main landmark.
Deprecated ARIA roles were not used
ARIA IDs are unique
Image elements do not have `[alt]` attributes that are redundant text.
Elements with visible text labels have matching accessible names.
`[accesskey]` values are unique
`button`, `link`, and `menuitem` elements have accessible names
Elements with `role="dialog"` or `role="alertdialog"` have accessible names.
ARIA input fields have accessible names
ARIA `meter` elements have accessible names
ARIA `progressbar` elements have accessible names
Elements with the `role=text` attribute do not have focusable descendents.
ARIA toggle fields have accessible names
ARIA `tooltip` elements have accessible names
ARIA `treeitem` elements have accessible names
The page contains a heading, skip link, or landmark region
`<dl>`'s contain only properly-ordered `<dt>` and `<dd>` groups, `<script>`, `<template>` or `<div>` elements.
Definition list items are wrapped in `<dl>` elements
No form fields have multiple labels
`<html>` element has an `[xml:lang]` attribute with the same base language as the `[lang]` attribute.
Input buttons have discernible text.
`<input type="image">` elements have `[alt]` text
Links are distinguishable without relying on color.
The document does not use `<meta http-equiv="refresh">`
`<object>` elements have alternate text
Select elements have associated label elements.
Cells in a `<table>` element that use the `[headers]` attribute refer to table cells within the same table.
`<th>` elements and elements with `[role="columnheader"/"rowheader"]` have data cells they describe.
`[lang]` attributes have a valid value
`<video>` elements contain a `<track>` element with `[kind="captions"]`
Tables have different content in the summary attribute and `<caption>`.
All heading elements contain content.
Uses ARIA roles only on compatible elements
Identical links have the same purpose.
Tables use `<caption>` instead of cells with the `[colspan]` attribute to indicate a caption.
`<td>` elements in a large `<table>` have one or more table headers.
81

Best Practices

General

Deprecated APIs will eventually be removed from the browser. Learn more about deprecated APIs.

Why this matters

Performance issues directly impact user engagement and conversion rates.

Deprecation / WarningSource
AttributionReporting
Uses HTTPS
Avoids third-party cookies
Allows users to paste into input fields
Avoids requesting the geolocation permission on page load
Avoids requesting the notification permission on page load
Displays images with correct aspect ratio
Serves images with appropriate resolution
Page has the HTML doctype
Properly defines charset
No browser errors logged to the console
No issues in the `Issues` panel in Chrome Devtools
Ensure CSP is effective against XSS attacks
Use a strong HSTS policy
Ensure proper origin isolation with COOP
Mitigate clickjacking with XFO or CSP
Mitigate DOM-based XSS with Trusted Types
Detected JavaScript libraries
Page has valid source maps
Redirects HTTP traffic to HTTPS
100

SEO

These checks ensure that your page is following basic search engine optimization advice. There are many additional factors Lighthouse does not score here that may affect your search ranking, including performance on Core Web Vitals. Learn more about Google Search Essentials.

Structured data is valid
Page isn’t blocked from indexing
Document has a `<title>` element
Document has a meta description
Page has successful HTTP status code
Links have descriptive text
Links are crawlable
robots.txt is valid
Image elements have `[alt]` attributes
Document has a valid `hreflang`
Document has a valid `rel=canonical`

Lighthouse Scores

Industry-standard audits powered by Google Lighthouse. — Desktop

46
Performance Overall performance score (0–100) based on Core Web Vitals and other metrics. 90+ is good.
93
Accessibility Measures how accessible the page is for users with disabilities. Checks color contrast, ARIA labels, and semantic HTML.
81
Best Practices Checks for modern web development best practices including HTTPS, no console errors, and secure JavaScript.
100
SEO Measures basic SEO optimizations: meta tags, crawlability, link text, and mobile friendliness.

Core Web Vitals

Key metrics that affect user experience. — Desktop

First Contentful Paint First Contentful Paint — how long until the browser renders the first piece of content. Under 1.8s is good.

2.18 s

Largest Contentful Paint Largest Contentful Paint — how long until the largest visible element loads. Under 2.5s is good.

3.59 s

Total Blocking Time Total Blocking Time — total time the main thread was blocked, preventing user input. Under 200ms is good.

184 ms

Cumulative Layout Shift Cumulative Layout Shift — measures visual stability. How much the page layout shifts during loading. Under 0.1 is good.

0.232

Speed Index Speed Index — how quickly content is visually displayed during load. Under 3.4s is good.

7.04 s

Time to Interactive Time to Interactive — how long until the page is fully interactive and responds to user input. Under 3.8s is good.

9.74 s

Detailed Report

Audit breakdown by category with detailed findings.

46

Performance

Insights

Remove large, duplicate JavaScript modules from bundles to reduce unnecessary bytes consumed by network activity.

Why this matters

Performance issues directly impact user engagement and conversion rates.

Polyfills and transforms enable older browsers to use new JavaScript features. However, many aren't necessary for modern browsers. Consider modifying your JavaScript build process to not transpile Baseline features, unless you know you must support older browsers. Learn why most sites can deploy ES6+ code without transpiling

Why this matters

Shipping ES5 transpiled code to modern browsers wastes bytes — every user with an evergreen browser pays for compatibility you don't need.

Learn more

Most users today run browsers that natively support ES6+, async/await, optional chaining, and the rest of modern JavaScript. Transpiling to ES5 'just in case' adds 20-40% to your bundle for no benefit. Configure your build to target a modern browserslist, or ship a differential bundle pair (modern + legacy) with the module/nomodule pattern.

Source: Google web.dev / Lighthouse

3rd party code can significantly impact load performance. Reduce and defer loading of 3rd party code to prioritize your page's content.

Why this matters

Performance issues directly impact user engagement and conversion rates.

Layout shifts occur when elements move absent any user interaction. Investigate the causes of layout shifts, such as elements being added, removed, or their fonts changing as the page loads.

Why this matters

Performance issues directly impact user engagement and conversion rates.

headings: [map[key:node label:Element subItemsHeading:map[key:extra] valueType:node] map[granularity:0.001 key:score label:Layout shift score subItemsHeading:map[key:cause valueType:text] valueType:numeric]]
items: [map[node:map[type:text value:Total] score:0.231573] map[node:map[boundingRect:map[bottom:6297 height:5629 left:0 right:1350 top:668 width:1350] lhId:page-2-MAIN nodeLabel:Find your course Search Explore our study areas Agriculture environment and sus… path:1,HTML,3,BODY,12,MAIN selector:body.home > main snippet:<main class="" data-grid-sidebar=""> type:node] score:0.231489] map[node:map[boundingRect:map[bottom:68 height:48 left:981 right:1312 top:20 width:331] lhId:page-1-NAV nodeLabel:Study Search Menu path:1,HTML,3,BODY,7,HEADER,0,DIV,1,NAV selector:body.home > header.header > div.header__container > nav.header__container--menu snippet:<nav class="header__container--menu" aria-label="header actions"> type:node] score:8.4e-05 subItems:map[items:[map[cause:Unsized image element extra:map[boundingRect:map[bottom:2701 height:533 left:205 right:505 top:2167 width:300] lhId:page-30-IMG nodeLabel:Nicholas is stepping out of his comfort zone and inspiring others to do the sam… path:1,HTML,3,BODY,12,MAIN,0,ARTICLE,2,MIMAS-BLOCK,1,DIV,0,DIV,0,DIV,0,DIV,0,DIV,0,DIV,1,BUTTON,0,IMG selector:div > div.mc-item > button.video__button > img snippet:<img decoding="async" src="https://s30991.pcdn.co/wp-content/uploads/sites/4/2023/09/Nick-Change.webp" alt="Nicholas is stepping out of his comfort zone and inspiring others to do th…" srcset="https://s30991.pcdn.co/wp-content/uploads/sites/4/2023/09/Nick-Change-150x…" sizes="(min-width: 2560px) 2560px, (min-width: 1920px) 1920px, (min-width: 1440px…" loading="lazy"> type:node]]] type:subitems]]]

Your first network request is the most important. Reduce its latency by avoiding redirects, ensuring a fast server response, and enabling text compression.

Why this matters

Performance issues directly impact user engagement and conversion rates.

A forced reflow occurs when JavaScript queries geometric properties (such as offsetWidth) after styles have been invalidated by a change to the DOM state. This can result in poor performance. Learn more about forced reflows and possible mitigations.

Why this matters

Performance issues directly impact user engagement and conversion rates.

headings: [map[key:source label:Top function call valueType:source-location] map[granularity:1 key:reflowTime label:Total reflow time valueType:ms]]
items: [map[reflowTime:57.241 source:map[column:27323 line:2 type:source-location url:https://s30991.pcdn.co/wp-includes/js/jquery/jquery.min.js?ver=3.7.1 urlProvider:network]]]
headings: [map[key:source label:Source valueType:source-location] map[granularity:1 key:reflowTime label:Total reflow time valueType:ms]]
items: [map[reflowTime:119.762 source:map[type:text value:[unattributed]]] map[reflowTime:0.158 source:map[column:29114 line:1 type:source-location url:https://s30991.pcdn.co/wp-content/themes/mimas/dist/js/app.js urlProvider:network]] map[reflowTime:46.059 source:map[column:49615 line:1 type:source-location url:https://s30991.pcdn.co/wp-includes/js/jquery/jquery.min.js?ver=3.7.1 urlProvider:network]] map[reflowTime:0.402 source:map[column:50335 line:1 type:source-location url:https://s30991.pcdn.co/wp-includes/js/jquery/jquery.min.js?ver=3.7.1 urlProvider:network]] map[reflowTime:0.414 source:map[column:50393 line:1 type:source-location url:https://s30991.pcdn.co/wp-includes/js/jquery/jquery.min.js?ver=3.7.1 urlProvider:network]] map[reflowTime:0.244 source:map[column:50457 line:1 type:source-location url:https://s30991.pcdn.co/wp-includes/js/jquery/jquery.min.js?ver=3.7.1 urlProvider:network]] map[reflowTime:4.945 source:map[column:694150 line:1 type:source-location url:https://s30991.pcdn.co/wp-content/themes/mimas/dist/js/vendor.js urlProvider:network]] map[reflowTime:0.286 source:map[column:51395 line:1 type:source-location url:https://s30991.pcdn.co/wp-includes/js/jquery/jquery.min.js?ver=3.7.1 urlProvider:network]] map[reflowTime:2.194 source:map[column:85575 line:1 type:source-location url:https://s30991.pcdn.co/wp-includes/js/jquery/jquery.min.js?ver=3.7.1 urlProvider:network]] map[reflowTime:8.807 source:map[column:49637 line:1 type:source-location url:https://s30991.pcdn.co/wp-includes/js/jquery/jquery.min.js?ver=3.7.1 urlProvider:network]] map[reflowTime:1.892 source:map[column:643539 line:1 type:source-location url:https://s30991.pcdn.co/wp-content/themes/mimas/dist/js/vendor.js urlProvider:network]] map[reflowTime:1.924 source:map[column:693855 line:1 type:source-location url:https://s30991.pcdn.co/wp-content/themes/mimas/dist/js/vendor.js urlProvider:network]]]

Optimize LCP by making the LCP image discoverable from the HTML immediately, and avoiding lazy-loading

Why this matters

Performance issues directly impact user engagement and conversion rates.

lhId: page-0-DIV
nodeLabel: Curtin Open Day 2026  Sunday 24 May, 10am to 3pm Explore courses, tour campus…
path: 1,HTML,3,BODY,9,MIMAS-MASTHEAD,0,DIV,0,DIV,0,DIV,0,DIV,0,DIV,0,DIV,0,DIV
selector: div#slick-slide00 > div > div.mh-slide__container > div.mh-slide
snippet: <div class="mh-slide" style="--mh-slide-bg: url(https://s30991.pcdn.co/wp-content/uploads/sites/4/2026/…;" data-image-position="">

Avoid chaining critical requests by reducing the length of chains, reducing the download size of resources, or deferring the download of unnecessary resources to improve page load.

Why this matters

Performance issues directly impact user engagement and conversion rates.

More than 4 preconnect connections were found. These should be used sparingly and only to the most important origins.
description: [preconnect](https://developer.chrome.com/docs/lighthouse/performance/uses-rel-preconnect/) hints help the browser establish a connection earlier in the page load, saving time when the first request for that origin is made. The following are the origins that the page preconnected to.
title: Preconnected origins
description: Add [preconnect](https://developer.chrome.com/docs/lighthouse/performance/uses-rel-preconnect/) hints to your most important origins, but try to use no more than 4.
title: Preconnect candidates

Requests are blocking the page's initial render, which may delay LCP. Deferring or inlining can move these network requests out of the critical path.

Why this matters

Performance issues directly impact user engagement and conversion rates.

A long cache lifetime can speed up repeat visits to your page. Learn more about caching.

Why this matters

Performance issues directly impact user engagement and conversion rates.

RequestCache TTLTransfer Size
/images/1761ad94-f7b4-466f-ae5f-6e617c13c9fc/6538fb62-bdb...0.0 ms1.0 MiB
/images/1761ad94-f7b4-466f-ae5f-6e617c13c9fc/943ac062-c20...0.0 ms321.4 KiB
/images/1761ad94-f7b4-466f-ae5f-6e617c13c9fc/40cdd8e2-2ef...0.0 ms261.0 KiB
/images/1761ad94-f7b4-466f-ae5f-6e617c13c9fc/c9fabfe3-496...0.0 ms115.9 KiB
connect.facebook.net/en_US/fbevents.js1200.0 s96.6 KiB
i.ytimg.com/vi/8DCiSMOQIx0/maxresdefault.jpg7200.0 s56.2 KiB
/signals/config/415133522630959?v=2.9.303&r=stable&domain...1200.0 s46.5 KiB
www.instagram.com/embed.js1200.0 s33.8 KiB
i.ytimg.com/vi_webp/duUZMki6DDI/maxresdefault.webp7200.0 s36.1 KiB
i.ytimg.com/vi_webp/40ddEmjZ46w/maxresdefault.webp7200.0 s34.3 KiB
scripts.clarity.ms/0.8.60-beta/clarity.js0.0 ms25.0 KiB
/signals/config/547059549414519?v=2.9.303&r=stable&domain...1200.0 s16.7 KiB
js.adsrvr.org/up_loader.1.1.0.js0.0 ms12.3 KiB
snap.licdn.com/li.lms-analytics/insight.min.js86400.0 s18.7 KiB
munchkin.marketo.net/munchkin.js0.0 ms1.2 KiB
js.adsrvr.org/universal_pixel.js0.0 ms958 B
/collect?v=2&fmt=js&pid=1376404&time=1776901400016&url=ht...0.0 ms693 B
/config/au/777363f7-8833-4ecc-a6cb-e757c2dcc623.js?v=3.56...0.0 ms477 B
static.doubleclick.net/instream/ad_status.js900.0 s495 B
/p.css?s=1&k=qji7bck&ht=tk&f=137.138.139.140.169.170.173....604800.0 s172 B
/tr/?id=415133522630959&ev=PageView&dl=https%3A%2F%2Fwww....0.0 ms16 B
/tr/?id=547059549414519&ev=PageView&dl=https%3A%2F%2Fwww....0.0 ms16 B
static.doubleclick.net/instream/ad_status.js900.0 s0 B

Reducing the download time of images can improve the perceived load time of the page and LCP. Learn more about optimizing image size

Why this matters

Performance issues directly impact user engagement and conversion rates.

URLResource SizeEst Savings
Panorama view of Miri city, Sarawak, Borneo, Malaysia div > div.mc-item > a.mc-link > img
/wp-content/uploads/sites/4/2022/12/AdobeStock_220638856-...341.8 KiB280.2 KiB
Wide shot of Curtin's main Perth campus div > div.mc-item > a.mc-link > img
/wp-content/uploads/sites/4/2023/06/curtin-perth-2000x100...284.9 KiB200.4 KiB
Protecting our planet mimas-block > div.checkered-items__container > div.checkered-item > img.animate
/wp-content/uploads/sites/4/2022/12/Working-together.jpg....115.7 KiB82.9 KiB
Fostering inclusion and positivity mimas-block > div.checkered-items__container > div.checkered-item > img.animate
/wp-content/uploads/sites/4/2022/12/Protecting-our-planet...104.0 KiB68.1 KiB
Lara is advocating for female involvement in STEM. div > div.mc-item > button.video__button > img
s30991.pcdn.co/wp-content/uploads/sites/4/2023/09/Lara-Change.webp84.6 KiB63.9 KiB
Working together mimas-block > div.checkered-items__container > div.checkered-item > img.animate
/wp-content/uploads/sites/4/2022/12/Screen-Shot-2022-04-0...94.3 KiB53.8 KiB
Mauritius div > div.mc-item > a.mc-link > img
s30991.pcdn.co/wp-content/uploads/sites/4/2022/12/Mauritius.jpeg.optimal.jpeg56.1 KiB30.1 KiB
Singapore div > div.mc-item > a.mc-link > img
s30991.pcdn.co/wp-content/uploads/sites/4/2022/12/Singapore.jpg.optimal.jpg41.0 KiB21.7 KiB
Dubai div > div.mc-item > a.mc-link > img
s30991.pcdn.co/wp-content/uploads/sites/4/2022/12/Dubai.jpg.optimal.jpg40.7 KiB21.4 KiB
Skyline of Colombo, Sri Lanka div > div.mc-item > a.mc-link > img
/wp-content/uploads/sites/4/2024/11/colombo_skyline.jpg.o...43.8 KiB17.8 KiB

These insights are also available in the Chrome DevTools Performance Panel - record a trace to view more detailed information.

Redirects introduce additional delays before the page can be loaded. Learn how to avoid page redirects.

Why this matters

Performance issues directly impact user engagement and conversion rates.

Estimated savings: 1.1 s
URLTime Spent
curtin.edu.au/1.1 s
www.curtin.edu.au/0.0 ms

Keep the server response time for the main document short because all other requests depend on it. Learn more about the Time to First Byte metric.

Why this matters

Performance issues directly impact user engagement and conversion rates.

Estimated savings: 507 ms
URLTime Spent
www.curtin.edu.au/607 ms

These are the largest layout shifts observed on the page. Each table item represents a single layout shift, and shows the element that shifted the most. Below each item are possible root causes that led to the layout shift. Some of these layout shifts may not be included in the CLS metric value due to windowing. Learn how to improve CLS

Why this matters

Performance issues directly impact user engagement and conversion rates.

ElementLayout shift score
Find your course Search Explore our study areas Agriculture environment and sus… body.home > main
0.231
Study Search Menu body.home > header.header > div.header__container > nav.header__container--menu
0.000

Time to Interactive is the amount of time it takes for the page to become fully interactive. Learn more about the Time to Interactive metric.

Why this matters

Performance issues directly impact user engagement and conversion rates.

TTI

Diagnostics

Reduce unused rules from stylesheets and defer CSS not used for above-the-fold content to decrease bytes consumed by network activity. Learn how to reduce unused CSS.

Why this matters

Performance issues directly impact user engagement and conversion rates.

Reduce unused JavaScript and defer loading scripts until they are required to decrease bytes consumed by network activity. Learn how to reduce unused JavaScript.

Why this matters

Multi-megabyte JavaScript bundles delay every interactive feature on the page.

Learn more

This is the Lighthouse audit fired when too much JS is shipped relative to what executes. The fix isn't a config flag — it requires bundle analysis (webpack-bundle-analyzer, rollup-plugin-visualizer), splitting routes into chunks, lazy-loading off-screen components, and removing unused dependencies. Fundamentally different from minification: minifying reduces byte count, this reduces what's downloaded at all.

Source: Google web.dev / Lighthouse

Estimated savings: 170 ms 1.3 MiB
URLTransfer SizeEst Savings
s30991.pcdn.co/wp-content/themes/mimas/dist/js/vendor.js230.7 KiB208.3 KiB
analytics.tiktok.com/i18n/pixel/static/main.MWE0ZWQ3ZWQwOQ.js120.9 KiB92.8 KiB
www.googletagmanager.com/gtm.js?id=GTM-WKWRXD&l=dataCoreLayer183.2 KiB78.7 KiB
/gtag/destination?id=AW-696927740&l=dataCoreLayer&cx=c&gt...133.9 KiB67.1 KiB
analytics.tiktok.com/i18n/pixel/static/main.MWE0ZWQ3ZWQwOQ.js120.9 KiB66.0 KiB
www.googletagmanager.com/gtag/js?id=G-EKWQ9HJQLL&l=dataCoreLayer&cx=c&gtm=4e64k1176.2 KiB64.9 KiB
www.googletagmanager.com/gtag/js?id=AW-798357996&l=dataCoreLayer&cx=c&gtm=4e64k1144.4 KiB62.4 KiB
www.googletagmanager.com/gtag/js?id=AW-845765649&l=dataCoreLayer&cx=c&gtm=4e64k1137.3 KiB61.4 KiB
www.googletagmanager.com/gtag/js?id=AW-845765595&l=dataCoreLayer&cx=c&gtm=4e64k1137.3 KiB61.4 KiB
www.googletagmanager.com/gtag/js?id=AW-809627420&l=dataCoreLayer&cx=c&gtm=4e64k1137.3 KiB61.4 KiB
www.googletagmanager.com/gtag/js?id=AW-603415810&l=dataCoreLayer&cx=c&gtm=4e64k1137.3 KiB61.4 KiB
www.googletagmanager.com/gtag/js?id=AW-845765673&l=dataCoreLayer&cx=c&gtm=4e64k1137.3 KiB61.4 KiB
www.googletagmanager.com/gtag/js?id=AW-969241043&l=dataCoreLayer&cx=c&gtm=4e64k1137.3 KiB60.7 KiB
www.googletagmanager.com/gtag/js?id=G-SWCC7XWPW9&l=dataCoreLayer&cx=c&gtm=4e64k1156.8 KiB60.0 KiB
s30991.pcdn.co/wp-content/themes/mimas/dist/js/2026/header.js?v=3.5.588.9 KiB58.6 KiB
www.googletagmanager.com/gtag/js?id=DC-14510064&l=dataCoreLayer&cx=c&gtm=4e64k1130.6 KiB57.4 KiB
www.googletagmanager.com/gtm.js?id=GTM-PZM3KG&l=dataCoreLayer198.0 KiB52.6 KiB
connect.facebook.net/en_US/fbevents.js96.5 KiB32.1 KiB
www.instagram.com/embed.js33.7 KiB26.9 KiB

Consider reducing the time spent parsing, compiling and executing JS. You may find delivering smaller JS payloads helps with this. Learn how to minimize main-thread work

Why this matters

Performance issues directly impact user engagement and conversion rates.

CategoryTime Spent
Script Evaluation1.7 s
Other636 ms
Style & Layout287 ms
Script Parsing & Compilation209 ms
Garbage Collection85 ms
Rendering50 ms
Parse HTML & CSS40 ms

More information about the performance of your application. These numbers don't directly affect the Performance score.

Max Potential First Input Delay 100 ms
Optimize DOM size
LCP breakdown
Modern HTTP
Optimize viewport for mobile
Minify CSS
Minify JavaScript
User Timing marks and measures 13 user timings
Avoid long main-thread tasks 9 long tasks found
Avoid non-composited animations 8 animated elements found
Image elements have explicit `width` and `height`
Page didn't prevent back/forward cache restoration
Network Requests
Network Round Trip Times 300 ms
Server Backend Latencies 280 ms
Tasks
Diagnostics
Metrics
Screenshot Thumbnails
Final Screenshot
Script Treemap Data
Resources Summary
INP breakdown
93

Accessibility

These checks highlight opportunities to improve the accessibility of your web app. Automatic detection can only detect a subset of issues and does not guarantee the accessibility of your web app, so manual testing is also encouraged.

Names and labels

When a button doesn't have an accessible name, screen readers announce it as "button", making it unusable for users who rely on screen readers. Learn how to make buttons more accessible.

Why this matters

Performance issues directly impact user engagement and conversion rates.

Failing Elements
mimas-block > form.search-form > fieldset.search-bar > button.search-clear mimas-block > form.search-form > fieldset.search-bar > button.search-clear

Including a skip link can help users skip to the main content to save time. Learn more about skip links.

Why this matters

Performance issues directly impact user engagement and conversion rates.

Failing Elements
Skip to the content body.home > nav.skip-links > a.skip-to-content
Skip to search body.home > nav.skip-links > a
Skip to secondary navigation body.home > nav.skip-links > a

These are opportunities to improve the semantics of the controls in your application. This may enhance the experience for users of assistive technology, like a screen reader.

Navigation

Properly ordered headings that do not skip levels convey the semantic structure of the page, making it easier to navigate and understand when using assistive technologies. Learn more about heading order.

Why this matters

Performance issues directly impact user engagement and conversion rates.

Failing Elements
Explore our study areas article.mimas-grid > mimas-block > section.study-areas > h4

These are opportunities to improve keyboard navigation in your application.

Interactive controls are keyboard focusable
Interactive elements indicate their purpose and state
The page has a logical tab order
Visual order on the page follows DOM order
User focus is not accidentally trapped in a region
The user's focus is directed to new content added to the page
HTML5 landmark elements are used to improve navigation
Offscreen content is hidden from assistive technology
Custom controls have associated labels
Custom controls have ARIA roles
`[aria-*]` attributes match their roles
`[aria-hidden="true"]` is not present on the document `<body>`
`[role]`s have all required `[aria-*]` attributes
Elements with an ARIA `[role]` that require children to contain a specific `[role]` have all required children.
`[role]`s are contained by their required parent element
`[role]` values are valid
`[aria-*]` attributes have valid values
`[aria-*]` attributes are valid and not misspelled
Image elements have `[alt]` attributes
Form elements have associated labels
`[user-scalable="no"]` is not used in the `<meta name="viewport">` element and the `[maximum-scale]` attribute is not less than 5.
ARIA attributes are used as specified for the element's role
`[aria-hidden="true"]` elements do not contain focusable descendents
Elements use only permitted ARIA attributes
Background and foreground colors have a sufficient contrast ratio
Document has a `<title>` element
`<frame>` or `<iframe>` elements have a title
`<html>` element has a `[lang]` attribute
`<html>` element has a valid value for its `[lang]` attribute
Links have a discernible name
Lists contain only `<li>` elements and script supporting elements (`<script>` and `<template>`).
List items (`<li>`) are contained within `<ul>`, `<ol>` or `<menu>` parent elements
No element has a `[tabindex]` value greater than 0
Touch targets have sufficient size and spacing.
Document has a main landmark.
Deprecated ARIA roles were not used
Image elements do not have `[alt]` attributes that are redundant text.
Elements with visible text labels have matching accessible names.
`[accesskey]` values are unique
`button`, `link`, and `menuitem` elements have accessible names
Elements with `role="dialog"` or `role="alertdialog"` have accessible names.
ARIA input fields have accessible names
ARIA `meter` elements have accessible names
ARIA `progressbar` elements have accessible names
Elements with the `role=text` attribute do not have focusable descendents.
ARIA toggle fields have accessible names
ARIA `tooltip` elements have accessible names
ARIA `treeitem` elements have accessible names
The page contains a heading, skip link, or landmark region
`<dl>`'s contain only properly-ordered `<dt>` and `<dd>` groups, `<script>`, `<template>` or `<div>` elements.
Definition list items are wrapped in `<dl>` elements
ARIA IDs are unique
No form fields have multiple labels
`<html>` element has an `[xml:lang]` attribute with the same base language as the `[lang]` attribute.
Input buttons have discernible text.
`<input type="image">` elements have `[alt]` text
Links are distinguishable without relying on color.
The document does not use `<meta http-equiv="refresh">`
`<object>` elements have alternate text
Select elements have associated label elements.
Cells in a `<table>` element that use the `[headers]` attribute refer to table cells within the same table.
`<th>` elements and elements with `[role="columnheader"/"rowheader"]` have data cells they describe.
`[lang]` attributes have a valid value
`<video>` elements contain a `<track>` element with `[kind="captions"]`
Tables have different content in the summary attribute and `<caption>`.
All heading elements contain content.
Uses ARIA roles only on compatible elements
Identical links have the same purpose.
Tables use `<caption>` instead of cells with the `[colspan]` attribute to indicate a caption.
`<td>` elements in a large `<table>` have one or more table headers.
81

Best Practices

General

Deprecated APIs will eventually be removed from the browser. Learn more about deprecated APIs.

Why this matters

Performance issues directly impact user engagement and conversion rates.

Deprecation / WarningSource
AttributionReporting
Uses HTTPS
Avoids third-party cookies
Allows users to paste into input fields
Avoids requesting the geolocation permission on page load
Avoids requesting the notification permission on page load
Displays images with correct aspect ratio
Serves images with appropriate resolution
Page has the HTML doctype
Properly defines charset
No browser errors logged to the console
No issues in the `Issues` panel in Chrome Devtools
Ensure CSP is effective against XSS attacks
Use a strong HSTS policy
Ensure proper origin isolation with COOP
Mitigate clickjacking with XFO or CSP
Mitigate DOM-based XSS with Trusted Types
Detected JavaScript libraries
Page has valid source maps
Redirects HTTP traffic to HTTPS
100

SEO

These checks ensure that your page is following basic search engine optimization advice. There are many additional factors Lighthouse does not score here that may affect your search ranking, including performance on Core Web Vitals. Learn more about Google Search Essentials.

Structured data is valid
Page isn’t blocked from indexing
Document has a `<title>` element
Document has a meta description
Page has successful HTTP status code
Links have descriptive text
Links are crawlable
robots.txt is valid
Image elements have `[alt]` attributes
Document has a valid `hreflang`
Document has a valid `rel=canonical`

Send Feedback