Netherlands · Amsterdam Completed: Apr 4, 2026 16:08 UTC
Mobile 375 × 812
Desktop 1440 × 900
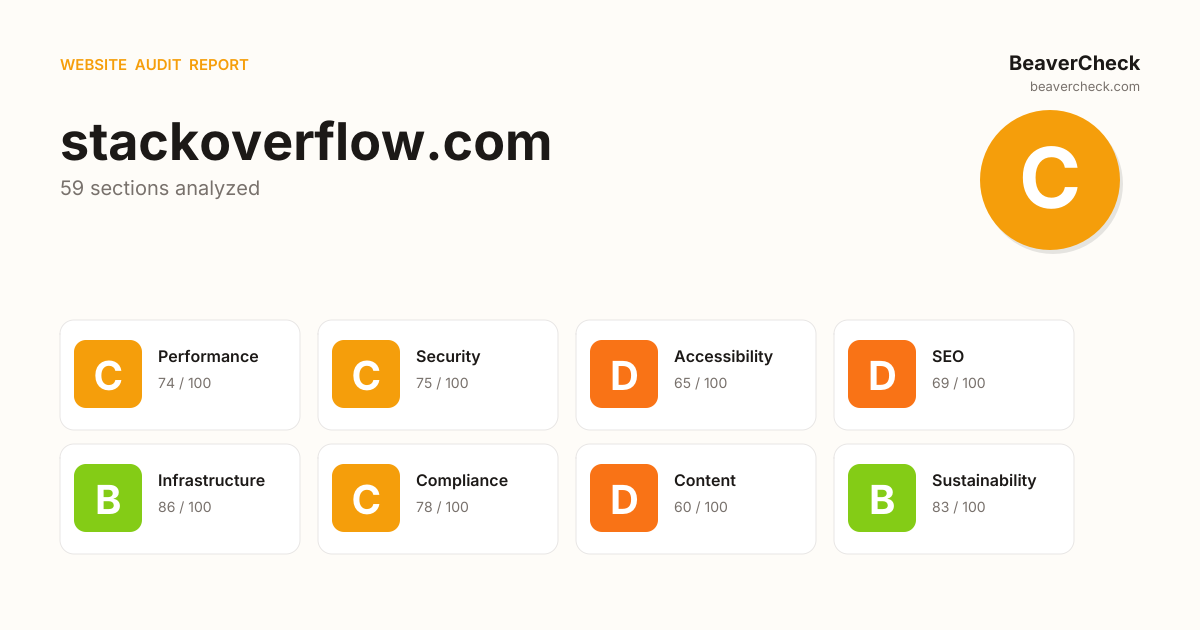
Score: 73 / 100
Based on 8 categories, 0 sections
The overall score is a weighted average of individual category scores. Categories with more impact on user experience and security carry more weight.
Weights reflect general web best practices. Individual needs may differ.
Cookie '__cflb' is missing the Secure flag
Cookie 'prov' is missing the Secure flag
Cookie '__cf_bm' has no SameSite attribute
Cookie 'prov' has no SameSite attribute
Cross-Origin-Embedder-Policy header is missing
[](https://beavercheck.com/results/6e5d781d-6c18-4396-86ec-cd047873c542)<a href="https://beavercheck.com/results/6e5d781d-6c18-4396-86ec-cd047873c542"><img src="https://beavercheck.com/badge?url=https%3A%2F%2Fstackoverflow.com" alt="BeaverCheck Score"></a>https://beavercheck.com/badge?url=https%3A%2F%2Fstackoverflow.comThis badge auto-updates with your latest scan result.
Thanks for your feedback!
Industry-standard audits powered by Google Lighthouse.
Key metrics that affect user experience.
First Contentful Paint First Contentful Paint — how long until the browser renders the first piece of content. Under 1.8s is good.
4.17 s
Largest Contentful Paint Largest Contentful Paint — how long until the largest visible element loads. Under 2.5s is good.
13.64 s
Total Blocking Time Total Blocking Time — total time the main thread was blocked, preventing user input. Under 200ms is good.
2.77 s
Cumulative Layout Shift Cumulative Layout Shift — measures visual stability. How much the page layout shifts during loading. Under 0.1 is good.
0.000
Speed Index Speed Index — how quickly content is visually displayed during load. Under 3.4s is good.
7.10 s
Time to Interactive Time to Interactive — how long until the page is fully interactive and responds to user input. Under 3.8s is good.
13.77 s
Audit breakdown by category with detailed findings.
Remove large, duplicate JavaScript modules from bundles to reduce unnecessary bytes consumed by network activity.
Polyfills and transforms enable older browsers to use new JavaScript features. However, many aren't necessary for modern browsers. Consider modifying your JavaScript build process to not transpile Baseline features, unless you know you must support older browsers. Learn why most sites can deploy ES6+ code without transpiling
3rd party code can significantly impact load performance. Reduce and defer loading of 3rd party code to prioritize your page's content.
A long cache lifetime can speed up repeat visits to your page. Learn more about caching.
Your first network request is the most important. Reduce its latency by avoiding redirects, ensuring a fast server response, and enabling text compression.
A forced reflow occurs when JavaScript queries geometric properties (such as offsetWidth) after styles have been invalidated by a change to the DOM state. This can result in poor performance. Learn more about forced reflows and possible mitigations.
Avoid chaining critical requests by reducing the length of chains, reducing the download size of resources, or deferring the download of unnecessary resources to improve page load.
Requests are blocking the page's initial render, which may delay LCP. Deferring or inlining can move these network requests out of the critical path.
Reducing the download time of images can improve the perceived load time of the page and LCP. Learn more about optimizing image size
| URL | Resource Size | Est Savings | |
|---|---|---|---|
div#hot-network-questions > ul > li.js-hidden > div.favicon div#hot-network-questions > ul > li.js-hidden > div.favicon | stackoverflow.com/Content/Img/favicons-sprite32.png?v=91e30776b0a0 | 274.8 KiB | 200.7 KiB |
These insights are also available in the Chrome DevTools Performance Panel - record a trace to view more detailed information.
The maximum potential First Input Delay that your users could experience is the duration of the longest task. Learn more about the Maximum Potential First Input Delay metric.
Redirects introduce additional delays before the page can be loaded. Learn how to avoid page redirects.
| URL | Time Spent |
|---|---|
| stackoverflow.com/ | 783 ms |
| stackoverflow.com/questions | 0.0 ms |
Time to Interactive is the amount of time it takes for the page to become fully interactive. Learn more about the Time to Interactive metric.
Reduce unused rules from stylesheets and defer CSS not used for above-the-fold content to decrease bytes consumed by network activity. Learn how to reduce unused CSS.
| URL | Transfer Size | Est Savings |
|---|---|---|
| stackoverflow.com/Content/Shared/stacks.css?v=b2264ccf0463 | 110.1 KiB | 102.6 KiB |
| stackoverflow.com/Content/Sites/stackoverflow/primary.css?v=880dfade9e7f | 74.2 KiB | 68.3 KiB |
Reduce unused JavaScript and defer loading scripts until they are required to decrease bytes consumed by network activity. Learn how to reduce unused JavaScript.
| URL | Transfer Size | Est Savings |
|---|---|---|
| s.lngtdv.com/prebid/stackoverflow/prebid10.27.0.1774971607.min.js | 171.8 KiB | 141.2 KiB |
| /pagead/managed/js/gpt/m202604010101/pubads_impl.js?cb=31... | 182.4 KiB | 137.6 KiB |
| stackoverflow.com/Content/Js/full-anon.en.js?v=037e97b07fca | 128.7 KiB | 94.8 KiB |
| cdn.cookielaw.org/scripttemplates/202601.2.0/otBannerSdk.js | 128.2 KiB | 71.9 KiB |
| accounts.google.com/gsi/client | 92.7 KiB | 69.9 KiB |
| www.googletagmanager.com/gtag/js?id=G-WCZ03SZFCQ | 153.0 KiB | 59.1 KiB |
| s.lngtdv.com/stackoverflow/default.1775148653.js | 71.0 KiB | 41.1 KiB |
| stackoverflow.com/Content/Js/webpack-chunks/svelte.en.js?v=f773033c4e0b | 32.0 KiB | 31.8 KiB |
| stackoverflow.com/Content/Js/webpack-chunks/svelte.en.js?v=f773033c4e0b | 32.0 KiB | 31.8 KiB |
Consider reducing the time spent parsing, compiling, and executing JS. You may find delivering smaller JS payloads helps with this. Learn how to reduce Javascript execution time.
Consider reducing the time spent parsing, compiling and executing JS. You may find delivering smaller JS payloads helps with this. Learn how to minimize main-thread work
| Category | Time Spent |
|---|---|
| Script Evaluation | 4.5 s |
| Style & Layout | 1.1 s |
| Other | 1.1 s |
| Script Parsing & Compilation | 832 ms |
| Parse HTML & CSS | 328 ms |
| Garbage Collection | 158 ms |
| Rendering | 106 ms |
More information about the performance of your application. These numbers don't directly affect the Performance score.
These checks highlight opportunities to improve the accessibility of your web app. Automatic detection can only detect a subset of issues and does not guarantee the accessibility of your web app, so manual testing is also encouraged.
Low-contrast text is difficult or impossible for many users to read. Learn how to provide sufficient color contrast.
| Failing Elements |
|---|
15 div#content > div#mainbar > div.s-pagination > a.s-pagination--item |
These are opportunities to improve the legibility of your content.
Properly ordered headings that do not skip levels convey the semantic structure of the page, making it easier to navigate and understand when using assistive technologies. Learn more about heading order.
| Failing Elements |
|---|
Why is Spring Boot still used in large-scale systems despite newer backend fram… div.bb > div#question-summary-79920167 > div.s-post-summary--content > h3.s-post-summary--content-title |
Hot Network Questions div#content > div#sidebar > div#hot-network-questions > h4 |
These are opportunities to improve keyboard navigation in your application.
Link text (and alternate text for images, when used as links) that is discernible, unique, and focusable improves the navigation experience for screen reader users. Learn how to make links accessible.
| Failing Elements |
|---|
body.questions-page > header.s-topbar > div.s-topbar--container > a.s-topbar--menu-btn body.questions-page > header.s-topbar > div.s-topbar--container > a.s-topbar--menu-btn |
div.s-post-summary--content > div.s-post-summary--meta > div.s-post-summary--meta-tags > a.themed div.s-post-summary--content > div.s-post-summary--meta > div.s-post-summary--meta-tags > a.themed |
div.s-post-summary--content > div.s-post-summary--meta > div.s-post-summary--meta-tags > a.themed div.s-post-summary--content > div.s-post-summary--meta > div.s-post-summary--meta-tags > a.themed |
div.s-post-summary--content > div.s-post-summary--meta > div.s-post-summary--meta-tags > a.themed div.s-post-summary--content > div.s-post-summary--meta > div.s-post-summary--meta-tags > a.themed |
These are opportunities to improve the semantics of the controls in your application. This may enhance the experience for users of assistive technology, like a screen reader.
Touch targets with sufficient size and spacing help users who may have difficulty targeting small controls to activate the targets. Learn more about touch targets.
| Failing Elements |
|---|
BUSINESS nav.site-footer--nav > div.site-footer--col > h5.-title > a.js-gps-track |
Stack Internal div.site-footer--col > ul.-list > li > a.js-gps-track |
Technology div > ul.-list > li > a.-link |
Business div > ul.-list > li > a.-link |
These items highlight common accessibility best practices.
Image natural dimensions should be proportional to the display size and the pixel ratio to maximize image clarity. Learn how to provide responsive images.
| URL | Displayed size | Actual size | Expected size | |
|---|---|---|---|---|
site logo div.s-modal--dialog > h1#signup-modal-title > div.s-modal--header > img.h48 | stackoverflow.com/Content/Sites/stackoverflow/Img/icon-48.png?v=6452e6a98212 | 48 x 48 | 48 x 48 | 72 x 72 |
Deprecated APIs will eventually be removed from the browser. Learn more about deprecated APIs.
| Deprecation / Warning | Source |
|---|---|
| SharedStorage | |
| StorageType.persistent is deprecated. Please use standardized navigator.storage instead. | |
| Fledge |
Errors logged to the console indicate unresolved problems. They can come from network request failures and other browser concerns. Learn more about this errors in console diagnostic audit
| Source | Description |
|---|---|
Not signed in with the identity provider. |
These checks ensure that your page is following basic search engine optimization advice. There are many additional factors Lighthouse does not score here that may affect your search ranking, including performance on Core Web Vitals. Learn more about Google Search Essentials.
Meta descriptions may be included in search results to concisely summarize page content. Learn more about the meta description.
Descriptive link text helps search engines understand your content. Learn how to make links more accessible.
| Link destination | Link Text |
|---|---|
| /internal/?utm_medium=referral&utm_source=stackoverflow-c... | Learn more |
| /internal/?utm_medium=referral&utm_source=stackoverflow-c... | Learn more |
Format your HTML in a way that enables crawlers to better understand your app’s content.
Industry-standard audits powered by Google Lighthouse. — Desktop
Key metrics that affect user experience. — Desktop
First Contentful Paint First Contentful Paint — how long until the browser renders the first piece of content. Under 1.8s is good.
712 ms
Largest Contentful Paint Largest Contentful Paint — how long until the largest visible element loads. Under 2.5s is good.
2.61 s
Total Blocking Time Total Blocking Time — total time the main thread was blocked, preventing user input. Under 200ms is good.
286 ms
Cumulative Layout Shift Cumulative Layout Shift — measures visual stability. How much the page layout shifts during loading. Under 0.1 is good.
0.001
Speed Index Speed Index — how quickly content is visually displayed during load. Under 3.4s is good.
1.56 s
Time to Interactive Time to Interactive — how long until the page is fully interactive and responds to user input. Under 3.8s is good.
2.61 s
Audit breakdown by category with detailed findings.
Remove large, duplicate JavaScript modules from bundles to reduce unnecessary bytes consumed by network activity.
Polyfills and transforms enable older browsers to use new JavaScript features. However, many aren't necessary for modern browsers. Consider modifying your JavaScript build process to not transpile Baseline features, unless you know you must support older browsers. Learn why most sites can deploy ES6+ code without transpiling
3rd party code can significantly impact load performance. Reduce and defer loading of 3rd party code to prioritize your page's content.
A long cache lifetime can speed up repeat visits to your page. Learn more about caching.
Your first network request is the most important. Reduce its latency by avoiding redirects, ensuring a fast server response, and enabling text compression.
A forced reflow occurs when JavaScript queries geometric properties (such as offsetWidth) after styles have been invalidated by a change to the DOM state. This can result in poor performance. Learn more about forced reflows and possible mitigations.
Reducing the download time of images can improve the perceived load time of the page and LCP. Learn more about optimizing image size
| URL | Resource Size | Est Savings | |
|---|---|---|---|
div#hot-network-questions > ul > li.js-hidden > div.favicon div#hot-network-questions > ul > li.js-hidden > div.favicon | stackoverflow.com/Content/Img/favicons-sprite16.png?v=7c49858b1c47 | 87.4 KiB | 68.8 KiB |
Avoid chaining critical requests by reducing the length of chains, reducing the download size of resources, or deferring the download of unnecessary resources to improve page load.
Requests are blocking the page's initial render, which may delay LCP. Deferring or inlining can move these network requests out of the critical path.
These insights are also available in the Chrome DevTools Performance Panel - record a trace to view more detailed information.
Redirects introduce additional delays before the page can be loaded. Learn how to avoid page redirects.
| URL | Time Spent |
|---|---|
| stackoverflow.com/ | 225 ms |
| stackoverflow.com/questions | 0.0 ms |
The maximum potential First Input Delay that your users could experience is the duration of the longest task. Learn more about the Maximum Potential First Input Delay metric.
Time to Interactive is the amount of time it takes for the page to become fully interactive. Learn more about the Time to Interactive metric.
Reduce unused rules from stylesheets and defer CSS not used for above-the-fold content to decrease bytes consumed by network activity. Learn how to reduce unused CSS.
| URL | Transfer Size | Est Savings |
|---|---|---|
| stackoverflow.com/Content/Shared/stacks.css?v=b2264ccf0463 | 110.1 KiB | 102.6 KiB |
| stackoverflow.com/Content/Sites/stackoverflow/primary.css?v=880dfade9e7f | 74.2 KiB | 68.7 KiB |
Reduce unused JavaScript and defer loading scripts until they are required to decrease bytes consumed by network activity. Learn how to reduce unused JavaScript.
| URL | Transfer Size | Est Savings |
|---|---|---|
| /pagead/managed/js/gpt/m202603310101/pubads_impl.js?cb=31... | 182.4 KiB | 135.7 KiB |
| stackoverflow.com/Content/Js/full-anon.en.js?v=037e97b07fca | 128.7 KiB | 94.8 KiB |
| cdn.cookielaw.org/scripttemplates/202601.2.0/otBannerSdk.js | 128.2 KiB | 71.9 KiB |
| accounts.google.com/gsi/client | 92.7 KiB | 69.9 KiB |
| s.lngtdv.com/stackoverflow/default.1775148653.js | 71.0 KiB | 42.6 KiB |
| stackoverflow.com/Content/Js/webpack-chunks/svelte.en.js?v=f773033c4e0b | 32.0 KiB | 31.8 KiB |
| stackoverflow.com/Content/Js/webpack-chunks/svelte.en.js?v=f773033c4e0b | 32.0 KiB | 31.8 KiB |
| /Content/Js/third-party/npm/@stackoverflow/stacks/dist/js... | 30.4 KiB | 20.7 KiB |
More information about the performance of your application. These numbers don't directly affect the Performance score.
These checks highlight opportunities to improve the accessibility of your web app. Automatic detection can only detect a subset of issues and does not guarantee the accessibility of your web app, so manual testing is also encouraged.
Low-contrast text is difficult or impossible for many users to read. Learn how to provide sufficient color contrast.
| Failing Elements |
|---|
15 div#content > div#mainbar > div.s-pagination > a.s-pagination--item |
These are opportunities to improve the legibility of your content.
Properly ordered headings that do not skip levels convey the semantic structure of the page, making it easier to navigate and understand when using assistive technologies. Learn more about heading order.
| Failing Elements |
|---|
Why is Spring Boot still used in large-scale systems despite newer backend fram… div.bb > div#question-summary-79920167 > div.s-post-summary--content > h3.s-post-summary--content-title |
Hot Network Questions div#content > div#sidebar > div#hot-network-questions > h4 |
These are opportunities to improve keyboard navigation in your application.
Link text (and alternate text for images, when used as links) that is discernible, unique, and focusable improves the navigation experience for screen reader users. Learn how to make links accessible.
| Failing Elements |
|---|
div.s-post-summary--content > div.s-post-summary--meta > div.s-post-summary--meta-tags > a.themed div.s-post-summary--content > div.s-post-summary--meta > div.s-post-summary--meta-tags > a.themed |
div.s-post-summary--content > div.s-post-summary--meta > div.s-post-summary--meta-tags > a.themed div.s-post-summary--content > div.s-post-summary--meta > div.s-post-summary--meta-tags > a.themed |
div.s-post-summary--content > div.s-post-summary--meta > div.s-post-summary--meta-tags > a.themed div.s-post-summary--content > div.s-post-summary--meta > div.s-post-summary--meta-tags > a.themed |
These are opportunities to improve the semantics of the controls in your application. This may enhance the experience for users of assistive technology, like a screen reader.
Deprecated APIs will eventually be removed from the browser. Learn more about deprecated APIs.
| Deprecation / Warning | Source |
|---|---|
| SharedStorage | |
| StorageType.persistent is deprecated. Please use standardized navigator.storage instead. | |
| Fledge |
Errors logged to the console indicate unresolved problems. They can come from network request failures and other browser concerns. Learn more about this errors in console diagnostic audit
| Source | Description |
|---|---|
Not signed in with the identity provider. |
These checks ensure that your page is following basic search engine optimization advice. There are many additional factors Lighthouse does not score here that may affect your search ranking, including performance on Core Web Vitals. Learn more about Google Search Essentials.
Meta descriptions may be included in search results to concisely summarize page content. Learn more about the meta description.
Descriptive link text helps search engines understand your content. Learn how to make links more accessible.
| Link destination | Link Text |
|---|---|
| /internal/?utm_medium=referral&utm_source=stackoverflow-c... | Learn more |
| /internal/?utm_medium=referral&utm_source=stackoverflow-c... | Learn more |
Format your HTML in a way that enables crawlers to better understand your app’s content.
Send Feedback