Global Performance
6/6 locations ✓Acceptable global latency — average 244ms across 6 locations, fastest from Santa Clara (18ms), slowest from Singapore (703ms). Sucuri edge cache (HIT). 1 location above the 500ms target.
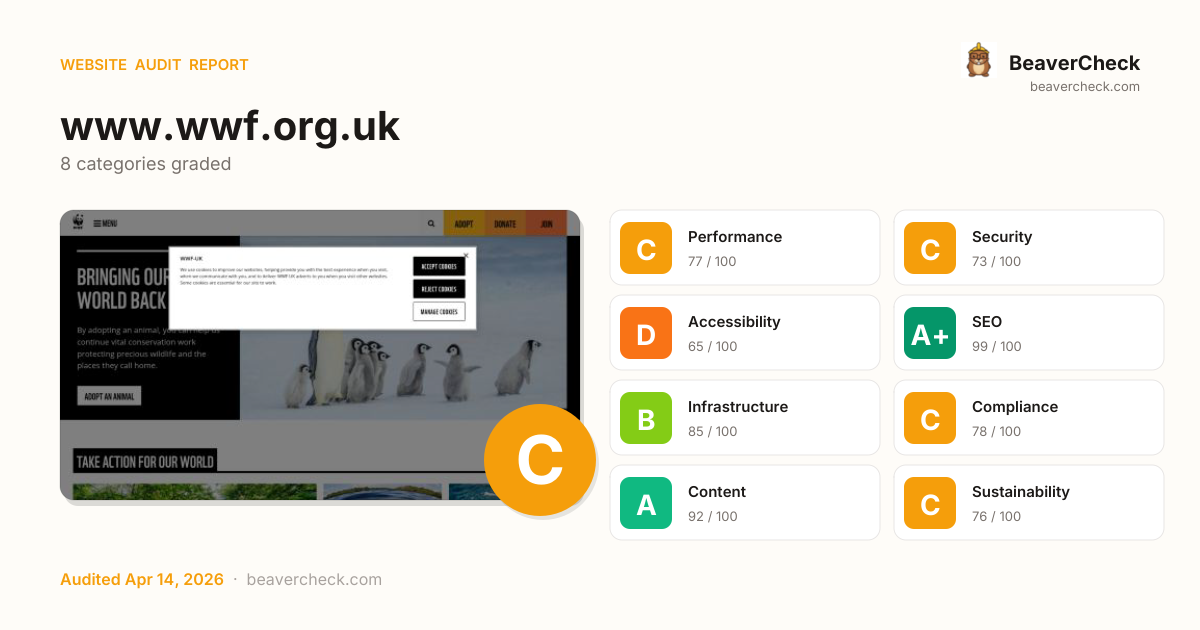
Audit overview
Accessibility needs attention; the rest of the categories are in good shape.
Fix Priority Matrix
5 findingsQuick Wins
3High impact, low effort — start here.
Strategic
2High impact, requires investment.
Easy Improvements
0Small gains, minimal effort.
Nothing in this quadrant — good news.
Deprioritize
0Low impact, high effort — do last.
Nothing in this quadrant — good news.
Screenshots
Top Priorities (5)
1 link(s) with no accessible text
Links with no accessible text (empty <a></a>, image-only no alt, icon-only no aria-label) are unidentifiable to screen readers.
2 control(s) without accessible label
Form controls without labels — assistive tech announces 'edit text' with no context; users can't complete forms.
67 third-party resources (67% of weight)
Informational: third-party resource count and their share of page weight. High share caps perf gains from frontend optimization.
Cross-Origin-Embedder-Policy header is missing
COEP enforces that all embedded resources opt-in to cross-origin embedding — required for cross-origin isolation features.
Cross-Origin-Opener-Policy header is missing
COOP isolates your top-level browsing context from cross-origin windows — without it, popup-based side-channel attacks remain possible.
Business case
What fixing the audit's findings is worth -- and what ignoring them keeps costing.
Return on investment
£206 investment → £5,730/month returns + GBP 18,050,000 risk avoided
Figures combine localized regulatory fine ceilings, search/conversion value priced against local CPC, and bandwidth waste estimates. Results depend on implementation quality and audience composition. Not legal or financial advice.
Conversion barriers
5 barrier(s) likely increasing bounce by ~27%.
- Page takes 15.4s to loadUsers abandon at ~3s — you're 12.9s over the 2.5s threshold→ Optimize render-blocking resources, preload the hero image, and compress images
- Page feels frozen for 728msClicks on the primary CTA are ignored while JavaScript runs→ Break up long tasks; defer non-critical JavaScript to post-hydration
- No Content-Security-Policy headerHigher XSS blast radius — one compromised script can exfiltrate the checkout form→ Ship a reporting-only CSP first, then enforce once violations are clean
- 2 form field(s) without a labelScreen readers skip unlabeled fields; autofill can't identify them; checkout abandonment spikes→ Associate every input with a visible <label for="…">; add autocomplete attributes
- 1 broken link(s) on the pageClicks land on 404s — trust drops and the session often ends→ Fix or remove the broken destinations surfaced on the Content tab
Preliminary CRO audit — each barrier links to the tab with detailed analysis.
Remediation cost
Start here for the best return on investment
Cost by category
Cost by effort level
Adjust assumptions
Team composition
Multiplier applied to dev hours to reflect QA, design, and PM overhead. Use Dev only for solo work; Full team for projects with formal review processes.
Rates reflect fully-loaded developer cost including overhead
Warning:Cost of inaction
Compliance Risk
£18,050,000
- No privacy policy link detectedUK GDPR: GBP 10,000 – GBP 17,500,000
- Trackers detected but no cookie policy foundUK GDPR: GBP 10,000 – GBP 17,500,000
- Trackers detected but no cookie policy foundPECR: GBP 1,000 – GBP 500,000
Bounce-Rate Cost
£5,729 /mo
+27.3pp bounce · ~2,728 lost visitors/mo
CPC: GBP 2.10
Bandwidth Waste
£0.42 /mo
6665.3 MB/mo × 0.063 GBP/GB
- Optimize transfer: save ~667 KB per page loadSaves £0.42/mo
Compliance figures represent the statutory maximum fine for the most severe triggered category, capped per regulation — not the sum of per-finding penalties. Based on published regulatory fine ranges. This is not legal advice.
Unique monthly visitors from your analytics
Purchases, signups, or key actions
Optional — for revenue estimation
more engaged visitors from reduced bounce
Fix 2 critical issues to capture this value
How this is calculated
Based on Google/Deloitte research ("Milliseconds Make Millions") showing a ~7% bounce rate increase per additional second of LCP above the 2.5s "Good" threshold.
Your site's LCP: → estimated after fixes.
These are estimates based on industry research — actual results vary
Your data stays in your browser — nothing is sent to our servers
Lighthouse
Mobile
First Contentful Paint First Contentful Paint — how long until the browser renders the first piece of content. Under 1.8s is good.
6.14 s
Largest Contentful Paint Largest Contentful Paint — how long until the largest visible element loads. Under 2.5s is good.
15.43 s
Total Blocking Time Total Blocking Time — total time the main thread was blocked, preventing user input. Under 200ms is good.
728 ms
Cumulative Layout Shift Cumulative Layout Shift — measures visual stability. How much the page layout shifts during loading. Under 0.1 is good.
0.011
Speed Index Speed Index — how quickly content is visually displayed during load. Under 3.4s is good.
7.85 s
Time to Interactive Time to Interactive — how long until the page is fully interactive and responds to user input. Under 3.8s is good.
15.49 s
Desktop
First Contentful Paint First Contentful Paint — how long until the browser renders the first piece of content. Under 1.8s is good.
1.46 s
Largest Contentful Paint Largest Contentful Paint — how long until the largest visible element loads. Under 2.5s is good.
1.50 s
Total Blocking Time Total Blocking Time — total time the main thread was blocked, preventing user input. Under 200ms is good.
47 ms
Cumulative Layout Shift Cumulative Layout Shift — measures visual stability. How much the page layout shifts during loading. Under 0.1 is good.
0.073
Speed Index Speed Index — how quickly content is visually displayed during load. Under 3.4s is good.
2.06 s
Time to Interactive Time to Interactive — how long until the page is fully interactive and responds to user input. Under 3.8s is good.
2.86 s
Categories
8Performance
67 third-party resources (67% of weight)
Security
Cross-Origin-Embedder-Policy header is missing
Accessibility
1 link(s) with no accessible text
SEO
All checks pass
Infrastructure
All checks pass
Compliance
All checks pass
Content
All checks pass
Sustainability
All checks pass
How you compare
Where this site stands against peers running the same stack.
Top 10% of Drupal sites score 94+ on Infrastructure; you're at 85 — closing this gap is the highest-leverage improvement.
Technology stack
Drupal, on PHP, hosted on Acquia Cloud Platform, with Cloudflare CDN
Stack Architecture
 AB Tasty
  Google Tag Manager
  Microsoft Clarity
  Drupal
  AOS
AOS  Font Awesome 6.7.2
 Google Font API HSTS
  HTTP/3
  Omny Studio
  OneTrust
  Open Graph
  Slick 1.8.1
 UptimeRobot
  Varnish
  Vimeo
Vimeo  jQuery 3.7.1
 jQuery UI 1.13.2
 PHP
PHP  Cloudflare
  Sucuri
  cdnjs
cdnjs  Acquia Cloud Platform
  Amazon Web Services
 All Detected Technologies (24)
Cloudflare is a web-infrastructure and website-security company, providing content-delivery-network services, DDoS mitigation, Internet security, and distributed domain-name-server services.
Sucuri is a cybersecurity company that provides website security solutions and services.
cdnjs is a free distributed JS library delivery service.
Acquia Cloud Platform is a Drupal-tuned application lifecycle management suite with an infrastructure to support Drupal deployment workflow processes.
Amazon Web Services (AWS) is a comprehensive cloud services platform offering compute power, database storage, content delivery and other functionality.
PHP is a general-purpose scripting language used for web development.
Drupal is a free and open-source web content management framework.
JavaScript library to animate elements on your page as you scroll.
Font Awesome is a font and icon toolkit based on CSS and Less.
Google Font API is a web service that supports open-source font files that can be used on your web designs.
HTTP Strict Transport Security (HSTS) informs browsers that the site should only be accessed using HTTPS.
HTTP/3 is the third major version of the Hypertext Transfer Protocol used to exchange information on the World Wide Web.
Omny Studio is a podcast hosting solution, which enables radio stations and enterprises to manage, monetize, publish, share, edit and analyze audio episodes.
OneTrust is a cloud-based data privacy management compliance platform.
Open Graph is a protocol that is used to integrate any web page into the social graph.
UptimeRobot is a web-based software that is designed to monitor the sites frequently to check whether any site is down owing to server problem or any bug in coding.
Varnish is a reverse caching proxy.
Vimeo is a video hosting, sharing and services platform. Vimeo operation an ad-free basis by providing subscription plans.
jQuery is a JavaScript library which is a free, open-source software designed to simplify HTML DOM tree traversal and manipulation, as well as event handling, CSS animation, and Ajax.
jQuery UI is a collection of GUI widgets, animated visual effects, and themes implemented with jQuery, Cascading Style Sheets, and HTML.
AB Tasty is a customer experience optimisation company. AB Tasty offers AI-driven experimentation, personalisation, and product optimisation platforms for user testing.
Google Tag Manager is a tag management system (TMS) that allows you to quickly and easily update measurement codes and related code fragments collectively known as tags on your website or mobile app.
Microsoft's Clarity is a analytics tool which provides website usage statistics, session recording, and heatmaps.
Observations (2)
No build tool detected
A framework (AOS) was detected but no bundler was identified. The build tool may not be detectable from output patterns, or the site may use the framework's built-in bundler.
Complex technology stack detected
24 technologies identified. A complex stack increases maintenance burden and attack surface. Consider whether all components are actively needed.
Show your score
Drop this badge on your README, marketing site, or status page. It auto-updates every time the audit re-runs and links back to this report.
This badge auto-updates with your latest scan result.
[](https://beavercheck.com/results/79e835de-2a84-4e38-a751-559414d75197)<a href="https://beavercheck.com/results/79e835de-2a84-4e38-a751-559414d75197"><img src="https://beavercheck.com/badge?url=https%3A%2F%2Fwww.wwf.org.uk" alt="BeaverCheck Score"></a>https://beavercheck.com/badge?url=https%3A%2F%2Fwww.wwf.org.ukExport & share
Download the audit, share with your team, or grab a fix plan ready to copy into your tracker.
Copies markdown to clipboard
Fix Plan
Three-week roadmap to ship the audit's findings, with one-click copy targets for your tracker.
Three-week fix plan
2 sprints · 3h total → projected B (84)
Sprint 1: Quick Wins
+4Highest ROI — low effort, high impact
- · 1 link(s) with no accessible text
- · 67 third-party resources (67% of weight)
- · Cross-Origin-Opener-Policy header is missing
Sprint 2: Core Fixes
+2Medium effort, high structural impact
- · 2 control(s) without accessible label
- · Cross-Origin-Embedder-Policy header is missing