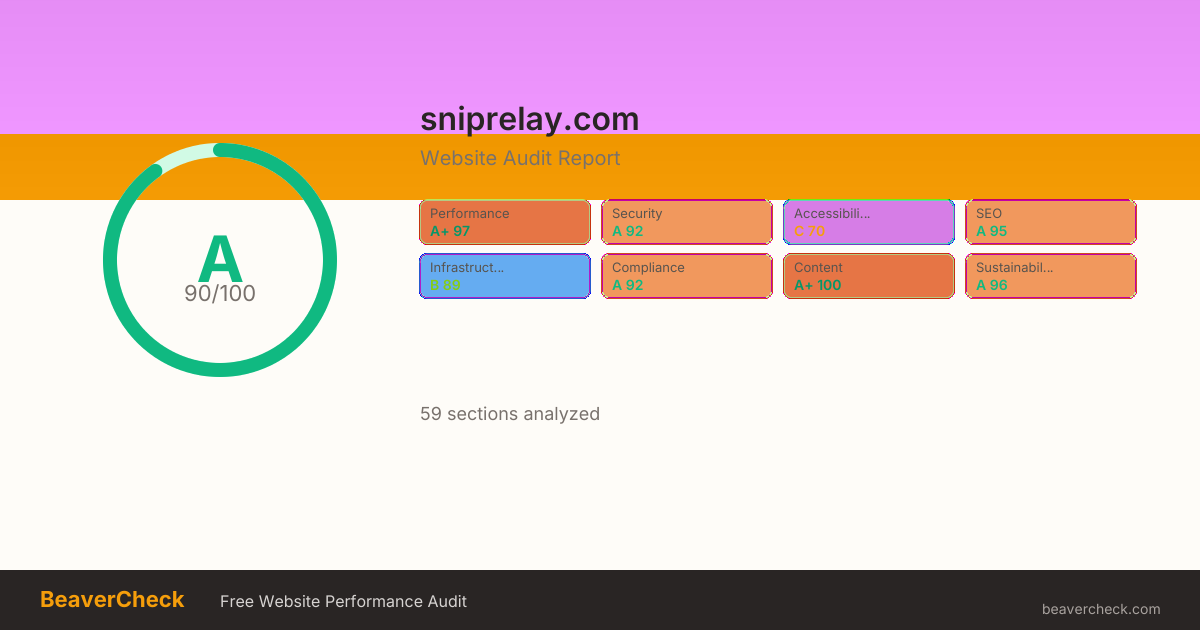
Singapore · Singapore Completed: Apr 2, 2026 22:56 UTC
Mobile 375 × 812
Desktop 1440 × 900
Score: 90 / 100
Based on 8 categories, 0 sections
The overall score is a weighted average of individual category scores. Categories with more impact on user experience and security carry more weight.
Weights reflect general web best practices. Individual needs may differ.
'unsafe-inline' found in script source
No <main> landmark found
Cookie 'csrftoken' is missing the HttpOnly flag
Cross-Origin-Embedder-Policy header is missing
Unattributable: 269ms CPU time
[](https://beavercheck.com/results/89073317-e17f-43be-911c-3065f1a1d3b7)<a href="https://beavercheck.com/results/89073317-e17f-43be-911c-3065f1a1d3b7"><img src="https://beavercheck.com/badge?url=https%3A%2F%2Fsniprelay.com" alt="BeaverCheck Score"></a>https://beavercheck.com/badge?url=https%3A%2F%2Fsniprelay.comThis badge auto-updates with your latest scan result.
Thanks for your feedback!
Industry-standard audits powered by Google Lighthouse.
Key metrics that affect user experience.
First Contentful Paint First Contentful Paint — how long until the browser renders the first piece of content. Under 1.8s is good.
1.09 s
Largest Contentful Paint Largest Contentful Paint — how long until the largest visible element loads. Under 2.5s is good.
1.18 s
Total Blocking Time Total Blocking Time — total time the main thread was blocked, preventing user input. Under 200ms is good.
44 ms
Cumulative Layout Shift Cumulative Layout Shift — measures visual stability. How much the page layout shifts during loading. Under 0.1 is good.
0.000
Speed Index Speed Index — how quickly content is visually displayed during load. Under 3.4s is good.
1.93 s
Time to Interactive Time to Interactive — how long until the page is fully interactive and responds to user input. Under 3.8s is good.
1.18 s
Audit breakdown by category with detailed findings.
Remove large, duplicate JavaScript modules from bundles to reduce unnecessary bytes consumed by network activity.
Polyfills and transforms enable older browsers to use new JavaScript features. However, many aren't necessary for modern browsers. Consider modifying your JavaScript build process to not transpile Baseline features, unless you know you must support older browsers. Learn why most sites can deploy ES6+ code without transpiling
3rd party code can significantly impact load performance. Reduce and defer loading of 3rd party code to prioritize your page's content.
Avoid chaining critical requests by reducing the length of chains, reducing the download size of resources, or deferring the download of unnecessary resources to improve page load.
These insights are also available in the Chrome DevTools Performance Panel - record a trace to view more detailed information.
Set an explicit width and height on image elements to reduce layout shifts and improve CLS. Learn how to set image dimensions
| URL | |
|---|---|
SnipRelay Logo div.flex > a.flex > div.flex > img.w-auto | sniprelay.com/static/img/logo/sniprelay.df0e5215cb16.svg |
More information about the performance of your application. These numbers don't directly affect the Performance score.
These checks highlight opportunities to improve the accessibility of your web app. Automatic detection can only detect a subset of issues and does not guarantee the accessibility of your web app, so manual testing is also encouraged.
Low-contrast text is difficult or impossible for many users to read. Learn how to provide sufficient color contrast.
| Failing Elements |
|---|
Telegram div.flex > div.inline-flex > button#btn-telegram > span.flex |
($0.00 USD) div.grid > div.flex > div.mb-6 > p.mt-1 |
Discord div.grid > div.flex > div.flex > span.py-1 |
Telegram div.grid > div.flex > div.flex > span.py-1 |
CORE LIMITS div.grid > div.flex > div.flex-grow > p.mb-4 |
($5.44 USD) div.grid > div.flex > div.mb-6 > p#usd-personal |
Telegram div.grid > div.flex > div.flex > span.flex |
($10.89 USD) div.grid > div.flex > div.mb-6 > p#usd-server |
per server div.grid > div.flex > div.mb-6 > p.mt-1 |
COMMUNITY BENEFITS div.grid > div.flex > div.flex-grow > p.mb-4 |
($2.17 USD) div.mx-auto > div.flex > div.flex > span.text-xs |
YouTube div.px-4 > div.grid > div.flex > span.text-xs |
Twitch div.px-4 > div.grid > div.flex > span.text-xs |
TikTok div.px-4 > div.grid > div.flex > span.text-xs |
X (Twitter) div.px-4 > div.grid > div.flex > span.text-xs |
Instagram div.px-4 > div.grid > div.flex > span.text-xs |
Reddit div.px-4 > div.grid > div.flex > span.text-xs |
Facebook div.px-4 > div.grid > div.flex > span.text-xs |
+10k div.grid > div.flex > div.flex > span.text-xs |
Others div.px-4 > div.grid > div.flex > span.text-xs |
Add to Telegram section.overflow-hidden > div.relative > div.flex > a.inline-flex |
View Commands section.overflow-hidden > div.relative > div.flex > a.text-indigo-200 |
Read FAQ section.overflow-hidden > div.relative > div.flex > a.text-indigo-200 |
Get Support section.overflow-hidden > div.relative > div.flex > a.text-indigo-200 |
These are opportunities to improve the legibility of your content.
One main landmark helps screen reader users navigate a web page. Learn more about landmarks.
| Failing Elements |
|---|
html html |
These items highlight common accessibility best practices.
These checks ensure that your page is following basic search engine optimization advice. There are many additional factors Lighthouse does not score here that may affect your search ranking, including performance on Core Web Vitals. Learn more about Google Search Essentials.
Industry-standard audits powered by Google Lighthouse. — Desktop
Key metrics that affect user experience. — Desktop
First Contentful Paint First Contentful Paint — how long until the browser renders the first piece of content. Under 1.8s is good.
282 ms
Largest Contentful Paint Largest Contentful Paint — how long until the largest visible element loads. Under 2.5s is good.
302 ms
Total Blocking Time Total Blocking Time — total time the main thread was blocked, preventing user input. Under 200ms is good.
0 ms
Cumulative Layout Shift Cumulative Layout Shift — measures visual stability. How much the page layout shifts during loading. Under 0.1 is good.
0.000
Speed Index Speed Index — how quickly content is visually displayed during load. Under 3.4s is good.
788 ms
Time to Interactive Time to Interactive — how long until the page is fully interactive and responds to user input. Under 3.8s is good.
302 ms
Audit breakdown by category with detailed findings.
Remove large, duplicate JavaScript modules from bundles to reduce unnecessary bytes consumed by network activity.
Polyfills and transforms enable older browsers to use new JavaScript features. However, many aren't necessary for modern browsers. Consider modifying your JavaScript build process to not transpile Baseline features, unless you know you must support older browsers. Learn why most sites can deploy ES6+ code without transpiling
3rd party code can significantly impact load performance. Reduce and defer loading of 3rd party code to prioritize your page's content.
Avoid chaining critical requests by reducing the length of chains, reducing the download size of resources, or deferring the download of unnecessary resources to improve page load.
These insights are also available in the Chrome DevTools Performance Panel - record a trace to view more detailed information.
Set an explicit width and height on image elements to reduce layout shifts and improve CLS. Learn how to set image dimensions
| URL | |
|---|---|
SnipRelay Logo div.flex > a.flex > div.flex > img.w-auto | sniprelay.com/static/img/logo/sniprelay.df0e5215cb16.svg |
More information about the performance of your application. These numbers don't directly affect the Performance score.
These checks highlight opportunities to improve the accessibility of your web app. Automatic detection can only detect a subset of issues and does not guarantee the accessibility of your web app, so manual testing is also encouraged.
Low-contrast text is difficult or impossible for many users to read. Learn how to provide sufficient color contrast.
| Failing Elements |
|---|
Telegram div.flex > div.inline-flex > button#btn-telegram > span.flex |
($0.00 USD) div.grid > div.flex > div.mb-6 > p.mt-1 |
Discord div.grid > div.flex > div.flex > span.py-1 |
Telegram div.grid > div.flex > div.flex > span.py-1 |
CORE LIMITS div.grid > div.flex > div.flex-grow > p.mb-4 |
($5.44 USD) div.grid > div.flex > div.mb-6 > p#usd-personal |
Telegram div.grid > div.flex > div.flex > span.flex |
($10.89 USD) div.grid > div.flex > div.mb-6 > p#usd-server |
per server div.grid > div.flex > div.mb-6 > p.mt-1 |
COMMUNITY BENEFITS div.grid > div.flex > div.flex-grow > p.mb-4 |
($2.17 USD) div.mx-auto > div.flex > div.flex > span.text-xs |
YouTube div.px-4 > div.grid > div.flex > span.text-xs |
Twitch div.px-4 > div.grid > div.flex > span.text-xs |
TikTok div.px-4 > div.grid > div.flex > span.text-xs |
X (Twitter) div.px-4 > div.grid > div.flex > span.text-xs |
Instagram div.px-4 > div.grid > div.flex > span.text-xs |
Reddit div.px-4 > div.grid > div.flex > span.text-xs |
Facebook div.px-4 > div.grid > div.flex > span.text-xs |
+10k div.grid > div.flex > div.flex > span.text-xs |
Others div.px-4 > div.grid > div.flex > span.text-xs |
Add to Telegram section.overflow-hidden > div.relative > div.flex > a.inline-flex |
See Pricing section.overflow-hidden > div.relative > div.flex > a.text-indigo-200 |
Get Support section.overflow-hidden > div.relative > div.flex > a.text-indigo-200 |
These are opportunities to improve the legibility of your content.
One main landmark helps screen reader users navigate a web page. Learn more about landmarks.
| Failing Elements |
|---|
html html |
These items highlight common accessibility best practices.
These checks ensure that your page is following basic search engine optimization advice. There are many additional factors Lighthouse does not score here that may affect your search ranking, including performance on Core Web Vitals. Learn more about Google Search Essentials.
Send Feedback